Zip Codes with the Highest Percentage of Population Employed in Food Preparation & Serving in Farmington, MI
RELATED REPORTS & OPTIONS
Food Preparation & Serving
Farmington
Compare Zip Codes
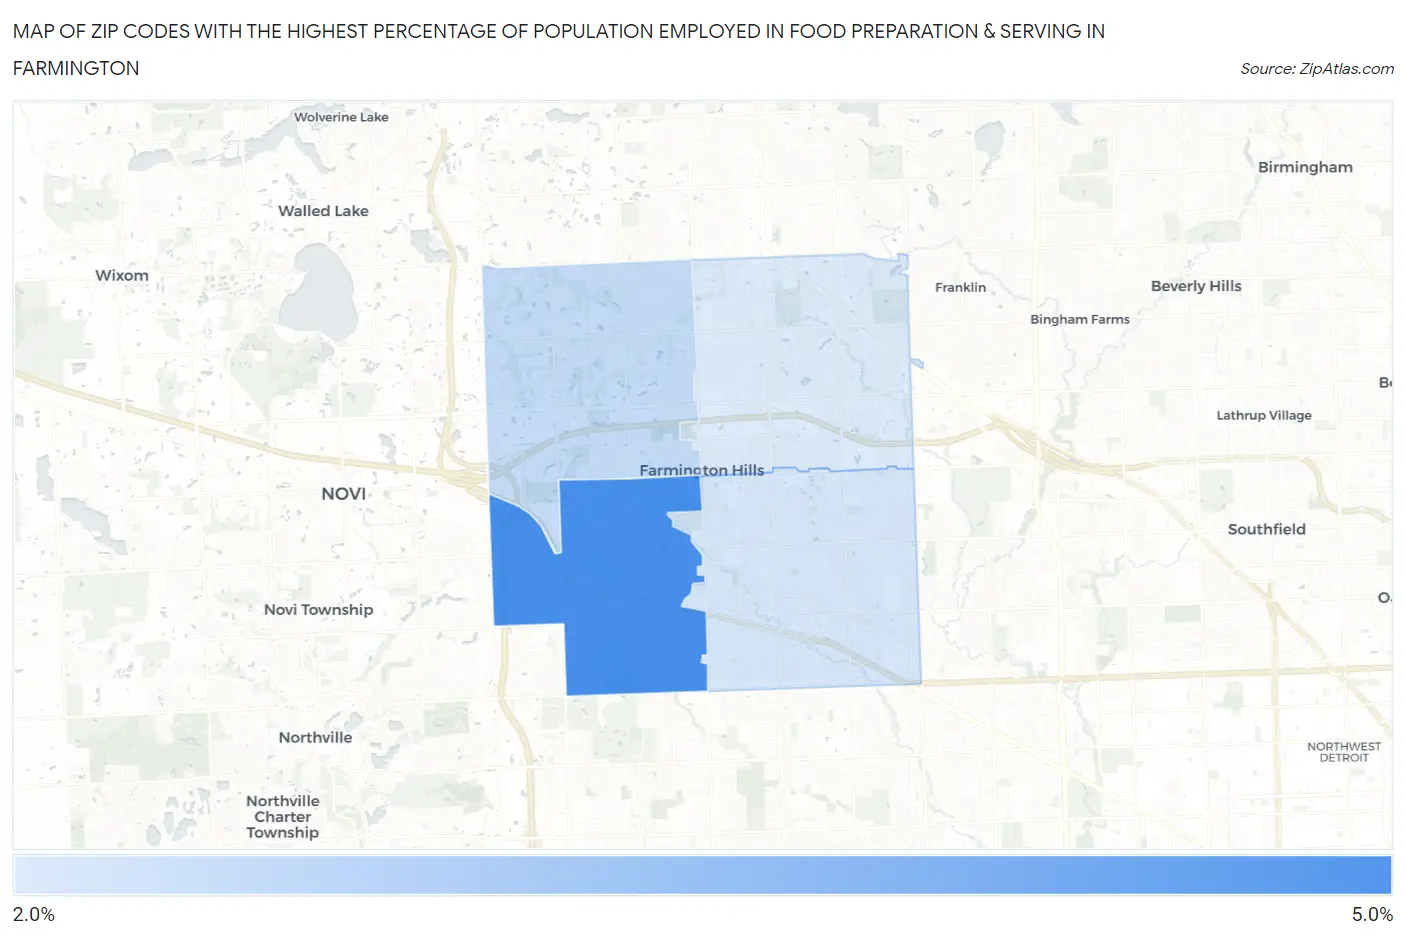
Map of Zip Codes with the Highest Percentage of Population Employed in Food Preparation & Serving in Farmington
2.7%
4.2%
Zip Codes with the Highest Percentage of Population Employed in Food Preparation & Serving in Farmington, MI
| Zip Code | % Employed | vs State | vs National | |
| 1. | 48335 | 4.2% | 5.7%(-1.45)#619 | 5.3%(-1.07)#16,244 |
| 2. | 48331 | 2.9% | 5.7%(-2.74)#799 | 5.3%(-2.36)#21,518 |
| 3. | 48336 | 2.8% | 5.7%(-2.92)#812 | 5.3%(-2.53)#22,222 |
| 4. | 48334 | 2.7% | 5.7%(-3.00)#820 | 5.3%(-2.61)#22,496 |
1
Common Questions
What are the Top 3 Zip Codes with the Highest Percentage of Population Employed in Food Preparation & Serving in Farmington, MI?
Top 3 Zip Codes with the Highest Percentage of Population Employed in Food Preparation & Serving in Farmington, MI are:
What zip code has the Highest Percentage of Population Employed in Food Preparation & Serving in Farmington, MI?
48335 has the Highest Percentage of Population Employed in Food Preparation & Serving in Farmington, MI with 4.2%.
What is the Percentage of Population Employed in Food Preparation & Serving in Farmington, MI?
Percentage of Population Employed in Food Preparation & Serving in Farmington is 2.4%.
What is the Percentage of Population Employed in Food Preparation & Serving in Michigan?
Percentage of Population Employed in Food Preparation & Serving in Michigan is 5.7%.
What is the Percentage of Population Employed in Food Preparation & Serving in the United States?
Percentage of Population Employed in Food Preparation & Serving in the United States is 5.3%.