Zip Codes with the Highest Percentage of Population Employed in Food Preparation & Serving in East Lansing, MI
RELATED REPORTS & OPTIONS
Food Preparation & Serving
East Lansing
Compare Zip Codes
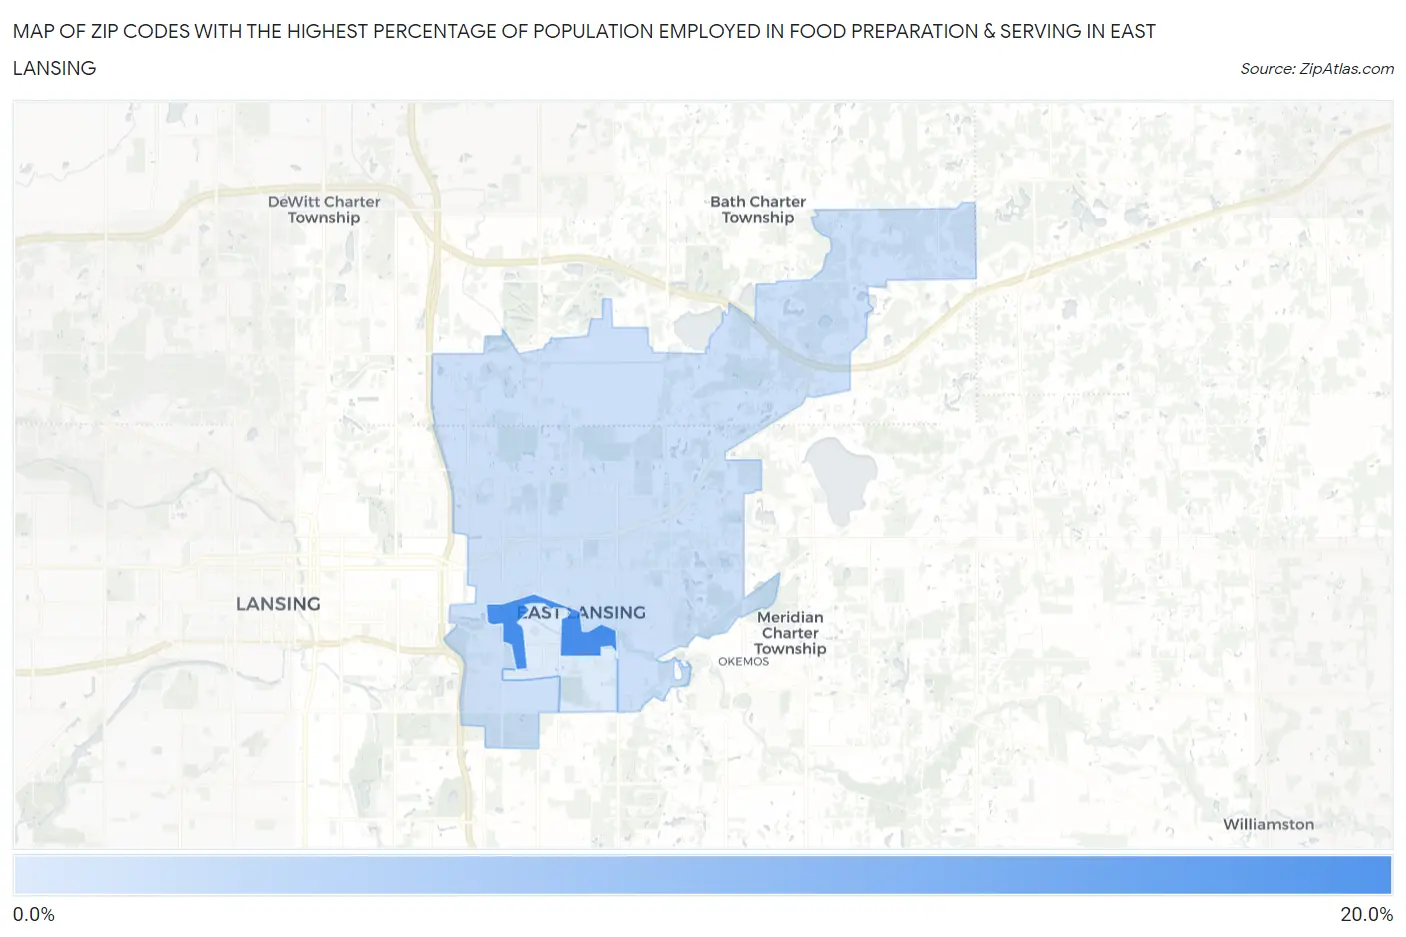
Map of Zip Codes with the Highest Percentage of Population Employed in Food Preparation & Serving in East Lansing
7.2%
16.1%
Zip Codes with the Highest Percentage of Population Employed in Food Preparation & Serving in East Lansing, MI
| Zip Code | % Employed | vs State | vs National | |
| 1. | 48825 | 16.1% | 5.7%(+10.5)#20 | 5.3%(+10.8)#843 |
| 2. | 48823 | 8.1% | 5.7%(+2.44)#144 | 5.3%(+2.82)#4,555 |
| 3. | 48824 | 7.2% | 5.7%(+1.56)#203 | 5.3%(+1.94)#6,061 |
1
Common Questions
What are the Top Zip Codes with the Highest Percentage of Population Employed in Food Preparation & Serving in East Lansing, MI?
Top Zip Codes with the Highest Percentage of Population Employed in Food Preparation & Serving in East Lansing, MI are:
What zip code has the Highest Percentage of Population Employed in Food Preparation & Serving in East Lansing, MI?
48825 has the Highest Percentage of Population Employed in Food Preparation & Serving in East Lansing, MI with 16.1%.
What is the Percentage of Population Employed in Food Preparation & Serving in East Lansing, MI?
Percentage of Population Employed in Food Preparation & Serving in East Lansing is 9.6%.
What is the Percentage of Population Employed in Food Preparation & Serving in Michigan?
Percentage of Population Employed in Food Preparation & Serving in Michigan is 5.7%.
What is the Percentage of Population Employed in Food Preparation & Serving in the United States?
Percentage of Population Employed in Food Preparation & Serving in the United States is 5.3%.