Zip Codes with the Highest Percentage of Population Employed in Food Preparation & Serving in Saint Clair Shores, MI
RELATED REPORTS & OPTIONS
Food Preparation & Serving
Saint Clair Shores
Compare Zip Codes
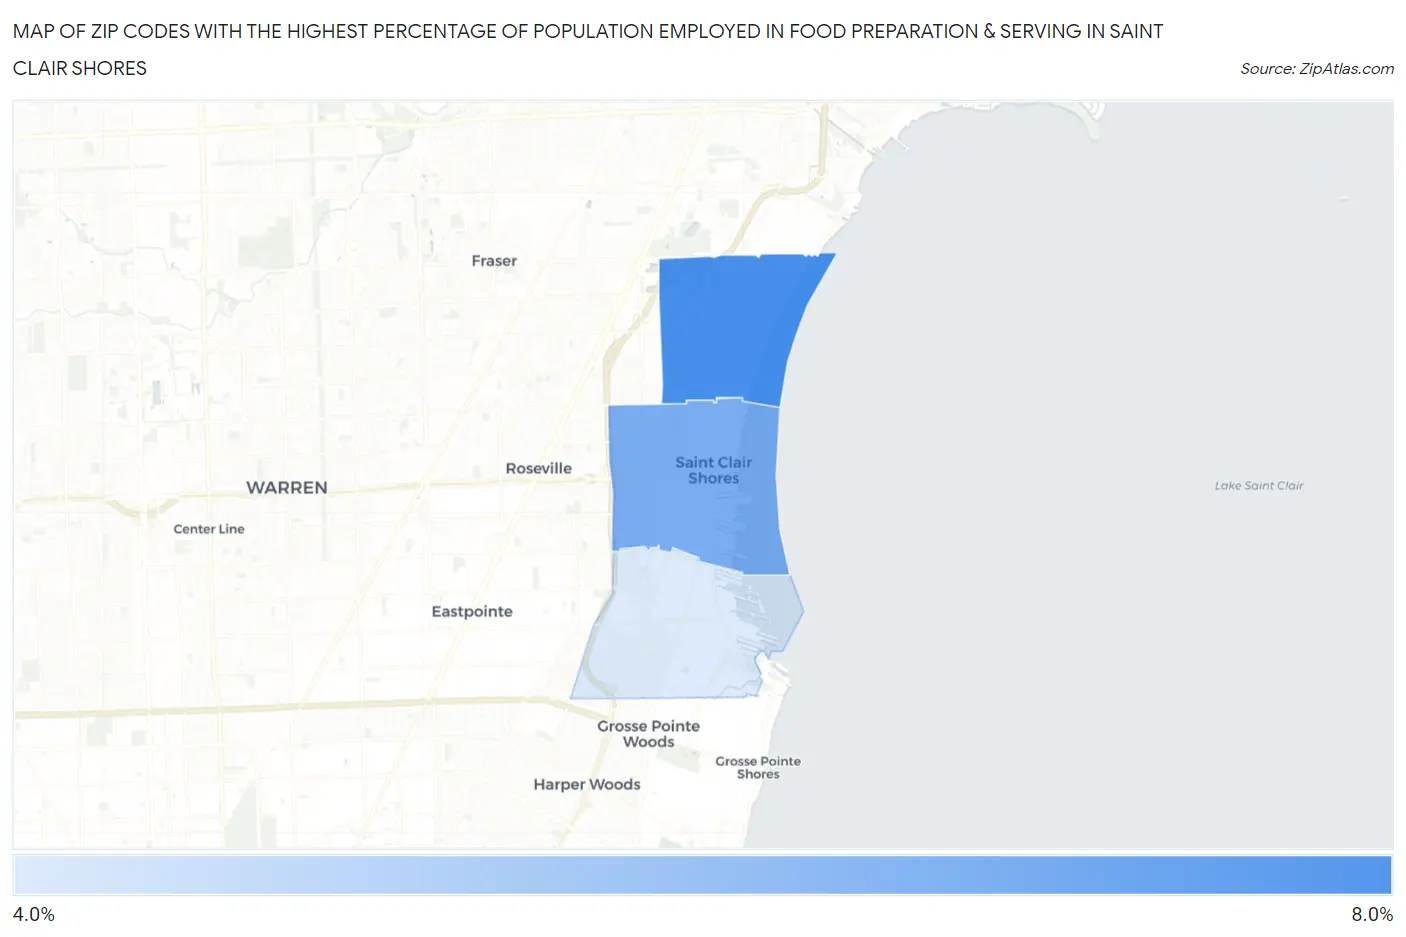
Map of Zip Codes with the Highest Percentage of Population Employed in Food Preparation & Serving in Saint Clair Shores
4.3%
6.5%
Zip Codes with the Highest Percentage of Population Employed in Food Preparation & Serving in Saint Clair Shores, MI
| Zip Code | % Employed | vs State | vs National | |
| 1. | 48082 | 6.5% | 5.7%(+0.857)#279 | 5.3%(+1.24)#7,799 |
| 2. | 48081 | 5.8% | 5.7%(+0.102)#378 | 5.3%(+0.489)#10,104 |
| 3. | 48080 | 4.3% | 5.7%(-1.39)#600 | 5.3%(-1.01)#15,965 |
1
Common Questions
What are the Top Zip Codes with the Highest Percentage of Population Employed in Food Preparation & Serving in Saint Clair Shores, MI?
Top Zip Codes with the Highest Percentage of Population Employed in Food Preparation & Serving in Saint Clair Shores, MI are:
What zip code has the Highest Percentage of Population Employed in Food Preparation & Serving in Saint Clair Shores, MI?
48082 has the Highest Percentage of Population Employed in Food Preparation & Serving in Saint Clair Shores, MI with 6.5%.
What is the Percentage of Population Employed in Food Preparation & Serving in Michigan?
Percentage of Population Employed in Food Preparation & Serving in Michigan is 5.7%.
What is the Percentage of Population Employed in Food Preparation & Serving in the United States?
Percentage of Population Employed in Food Preparation & Serving in the United States is 5.3%.