Zip Codes with the Highest Percentage of Population Employed in Food Preparation & Serving in Westland, MI
RELATED REPORTS & OPTIONS
Food Preparation & Serving
Westland
Compare Zip Codes
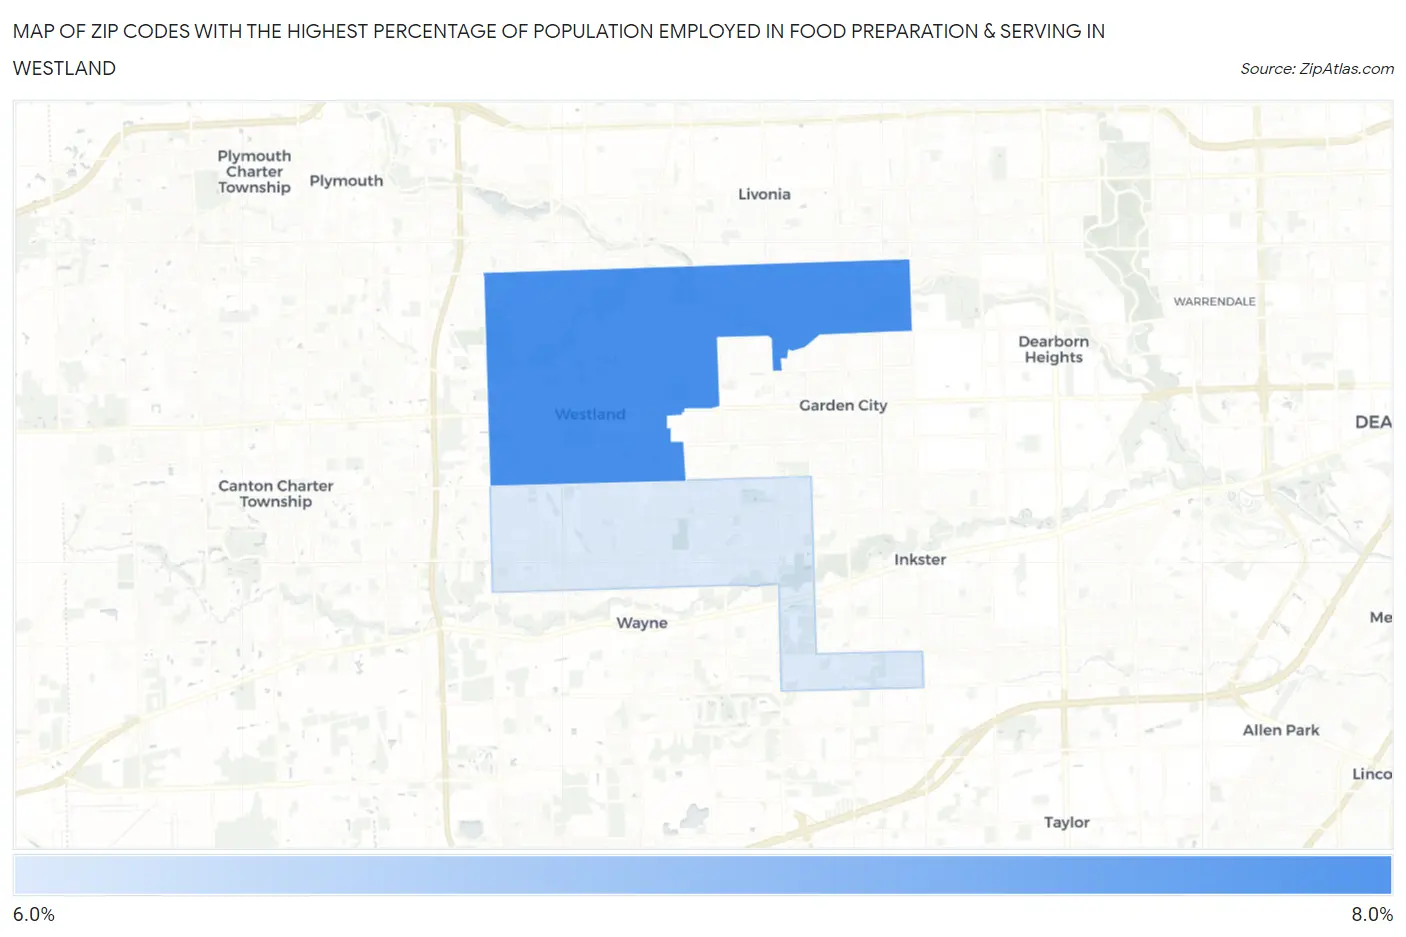
Map of Zip Codes with the Highest Percentage of Population Employed in Food Preparation & Serving in Westland
6.2%
6.2%
Zip Codes with the Highest Percentage of Population Employed in Food Preparation & Serving in Westland, MI
| Zip Code | % Employed | vs State | vs National | |
| 1. | 48185 | 6.2% | 5.7%(+0.536)#316 | 5.3%(+0.923)#8,704 |
| 2. | 48186 | 6.2% | 5.7%(+0.495)#324 | 5.3%(+0.881)#8,827 |
1
Common Questions
What are the Top Zip Codes with the Highest Percentage of Population Employed in Food Preparation & Serving in Westland, MI?
Top Zip Codes with the Highest Percentage of Population Employed in Food Preparation & Serving in Westland, MI are:
What zip code has the Highest Percentage of Population Employed in Food Preparation & Serving in Westland, MI?
48185 has the Highest Percentage of Population Employed in Food Preparation & Serving in Westland, MI with 6.2%.
What is the Percentage of Population Employed in Food Preparation & Serving in Westland, MI?
Percentage of Population Employed in Food Preparation & Serving in Westland is 6.2%.
What is the Percentage of Population Employed in Food Preparation & Serving in Michigan?
Percentage of Population Employed in Food Preparation & Serving in Michigan is 5.7%.
What is the Percentage of Population Employed in Food Preparation & Serving in the United States?
Percentage of Population Employed in Food Preparation & Serving in the United States is 5.3%.