Zip Codes with the Highest Percentage of Population Employed in Construction & Extraction in Michigan
RELATED REPORTS & OPTIONS
Construction & Extraction
Michigan
Compare Zip Codes
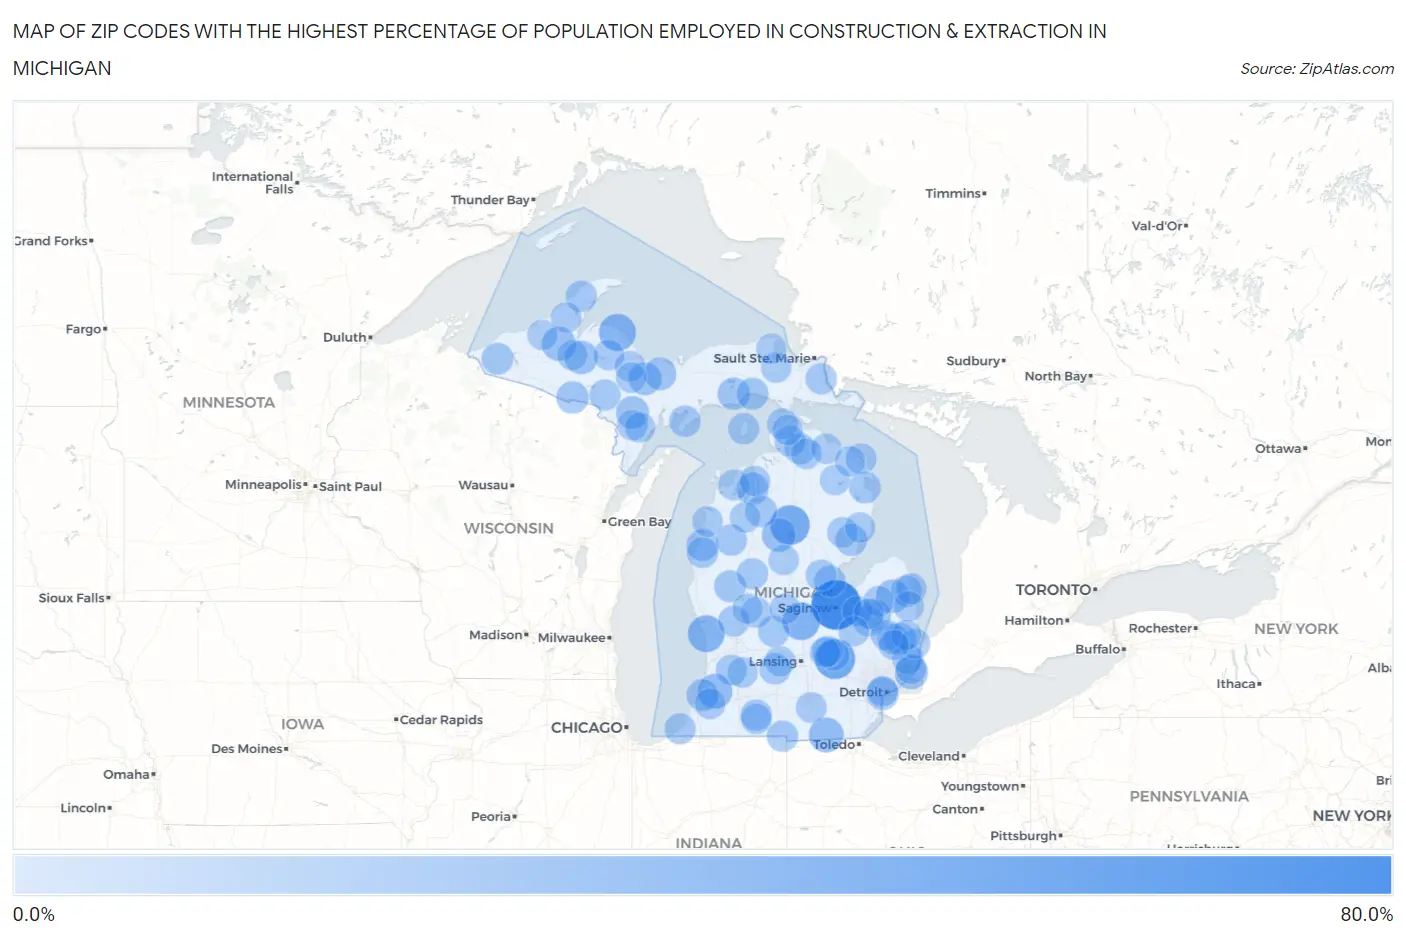
Map of Zip Codes with the Highest Percentage of Population Employed in Construction & Extraction in Michigan
0.0%
80.0%
Zip Codes with the Highest Percentage of Population Employed in Construction & Extraction in Michigan
| Zip Code | % Employed | vs State | vs National | |
| 1. | 48724 | 78.5% | 4.4%(+74.1)#1 | 5.0%(+73.5)#47 |
| 2. | 48816 | 45.7% | 4.4%(+41.3)#2 | 5.0%(+40.7)#158 |
| 3. | 48627 | 42.5% | 4.4%(+38.1)#3 | 5.0%(+37.5)#187 |
| 4. | 48862 | 35.7% | 4.4%(+31.3)#4 | 5.0%(+30.7)#285 |
| 5. | 49808 | 33.8% | 4.4%(+29.4)#5 | 5.0%(+28.8)#315 |
| 6. | 49409 | 32.9% | 4.4%(+28.5)#6 | 5.0%(+27.9)#332 |
| 7. | 49027 | 25.9% | 4.4%(+21.6)#7 | 5.0%(+20.9)#552 |
| 8. | 49289 | 25.9% | 4.4%(+21.6)#8 | 5.0%(+20.9)#556 |
| 9. | 49952 | 23.1% | 4.4%(+18.7)#9 | 5.0%(+18.1)#717 |
| 10. | 49667 | 22.2% | 4.4%(+17.8)#10 | 5.0%(+17.2)#783 |
| 11. | 48410 | 20.8% | 4.4%(+16.5)#11 | 5.0%(+15.8)#906 |
| 12. | 49919 | 20.8% | 4.4%(+16.5)#12 | 5.0%(+15.8)#907 |
| 13. | 48028 | 20.6% | 4.4%(+16.3)#13 | 5.0%(+15.6)#926 |
| 14. | 49833 | 19.1% | 4.4%(+14.8)#14 | 5.0%(+14.2)#1,110 |
| 15. | 49873 | 19.1% | 4.4%(+14.8)#15 | 5.0%(+14.2)#1,111 |
| 16. | 49826 | 18.8% | 4.4%(+14.4)#16 | 5.0%(+13.8)#1,172 |
| 17. | 49838 | 17.7% | 4.4%(+13.3)#17 | 5.0%(+12.7)#1,341 |
| 18. | 49927 | 17.4% | 4.4%(+13.1)#18 | 5.0%(+12.4)#1,398 |
| 19. | 48209 | 17.1% | 4.4%(+12.7)#19 | 5.0%(+12.1)#1,448 |
| 20. | 49629 | 16.6% | 4.4%(+12.3)#20 | 5.0%(+11.6)#1,563 |
| 21. | 49762 | 16.1% | 4.4%(+11.7)#21 | 5.0%(+11.1)#1,697 |
| 22. | 49634 | 15.6% | 4.4%(+11.2)#22 | 5.0%(+10.6)#1,822 |
| 23. | 49043 | 15.5% | 4.4%(+11.1)#23 | 5.0%(+10.5)#1,858 |
| 24. | 49312 | 15.4% | 4.4%(+11.0)#24 | 5.0%(+10.4)#1,882 |
| 25. | 48748 | 15.3% | 4.4%(+10.9)#25 | 5.0%(+10.3)#1,901 |
| 26. | 49968 | 15.3% | 4.4%(+10.9)#26 | 5.0%(+10.3)#1,924 |
| 27. | 48760 | 15.2% | 4.4%(+10.8)#27 | 5.0%(+10.2)#1,962 |
| 28. | 48022 | 15.1% | 4.4%(+10.7)#28 | 5.0%(+10.1)#1,992 |
| 29. | 49680 | 15.0% | 4.4%(+10.6)#29 | 5.0%(+10.0)#2,013 |
| 30. | 49835 | 14.9% | 4.4%(+10.6)#30 | 5.0%(+9.95)#2,049 |
| 31. | 49766 | 14.9% | 4.4%(+10.5)#31 | 5.0%(+9.91)#2,061 |
| 32. | 49638 | 14.8% | 4.4%(+10.5)#32 | 5.0%(+9.83)#2,094 |
| 33. | 49096 | 14.6% | 4.4%(+10.3)#33 | 5.0%(+9.63)#2,185 |
| 34. | 48418 | 14.3% | 4.4%(+9.93)#34 | 5.0%(+9.30)#2,309 |
| 35. | 48634 | 14.3% | 4.4%(+9.92)#35 | 5.0%(+9.29)#2,311 |
| 36. | 49942 | 14.3% | 4.4%(+9.92)#36 | 5.0%(+9.29)#2,332 |
| 37. | 49066 | 13.9% | 4.4%(+9.51)#37 | 5.0%(+8.88)#2,517 |
| 38. | 48834 | 13.9% | 4.4%(+9.51)#38 | 5.0%(+8.88)#2,522 |
| 39. | 49255 | 13.7% | 4.4%(+9.38)#39 | 5.0%(+8.75)#2,571 |
| 40. | 48465 | 13.5% | 4.4%(+9.10)#40 | 5.0%(+8.47)#2,726 |
| 41. | 49782 | 13.4% | 4.4%(+9.07)#41 | 5.0%(+8.44)#2,740 |
| 42. | 49710 | 13.4% | 4.4%(+9.05)#42 | 5.0%(+8.42)#2,748 |
| 43. | 49639 | 13.3% | 4.4%(+8.97)#43 | 5.0%(+8.35)#2,774 |
| 44. | 49411 | 13.0% | 4.4%(+8.63)#44 | 5.0%(+8.00)#2,939 |
| 45. | 49749 | 12.8% | 4.4%(+8.46)#45 | 5.0%(+7.83)#3,031 |
| 46. | 49116 | 12.8% | 4.4%(+8.45)#46 | 5.0%(+7.83)#3,038 |
| 47. | 49881 | 12.8% | 4.4%(+8.39)#47 | 5.0%(+7.76)#3,079 |
| 48. | 48064 | 12.7% | 4.4%(+8.38)#48 | 5.0%(+7.75)#3,083 |
| 49. | 48652 | 12.7% | 4.4%(+8.30)#49 | 5.0%(+7.67)#3,144 |
| 50. | 49716 | 12.6% | 4.4%(+8.24)#50 | 5.0%(+7.61)#3,183 |
| 51. | 49328 | 12.6% | 4.4%(+8.21)#51 | 5.0%(+7.59)#3,198 |
| 52. | 49330 | 12.5% | 4.4%(+8.09)#52 | 5.0%(+7.46)#3,302 |
| 53. | 49718 | 12.3% | 4.4%(+7.93)#53 | 5.0%(+7.30)#3,403 |
| 54. | 49777 | 12.2% | 4.4%(+7.88)#54 | 5.0%(+7.25)#3,427 |
| 55. | 48014 | 12.2% | 4.4%(+7.80)#55 | 5.0%(+7.17)#3,475 |
| 56. | 49653 | 12.1% | 4.4%(+7.78)#56 | 5.0%(+7.15)#3,496 |
| 57. | 48434 | 12.1% | 4.4%(+7.76)#57 | 5.0%(+7.13)#3,520 |
| 58. | 48739 | 11.9% | 4.4%(+7.57)#58 | 5.0%(+6.95)#3,626 |
| 59. | 49322 | 11.8% | 4.4%(+7.42)#59 | 5.0%(+6.80)#3,727 |
| 60. | 48435 | 11.8% | 4.4%(+7.41)#60 | 5.0%(+6.78)#3,734 |
| 61. | 49234 | 11.7% | 4.4%(+7.36)#61 | 5.0%(+6.73)#3,786 |
| 62. | 49057 | 11.7% | 4.4%(+7.33)#62 | 5.0%(+6.70)#3,810 |
| 63. | 49874 | 11.6% | 4.4%(+7.26)#63 | 5.0%(+6.63)#3,864 |
| 64. | 49040 | 11.5% | 4.4%(+7.14)#64 | 5.0%(+6.51)#3,954 |
| 65. | 48210 | 11.5% | 4.4%(+7.13)#65 | 5.0%(+6.50)#3,959 |
| 66. | 48729 | 11.5% | 4.4%(+7.13)#66 | 5.0%(+6.50)#3,960 |
| 67. | 48444 | 11.4% | 4.4%(+7.05)#67 | 5.0%(+6.42)#4,021 |
| 68. | 49814 | 11.4% | 4.4%(+7.05)#68 | 5.0%(+6.42)#4,026 |
| 69. | 49871 | 11.4% | 4.4%(+7.03)#69 | 5.0%(+6.40)#4,039 |
| 70. | 49728 | 11.3% | 4.4%(+6.97)#70 | 5.0%(+6.35)#4,078 |
| 71. | 49955 | 11.3% | 4.4%(+6.93)#71 | 5.0%(+6.31)#4,110 |
| 72. | 48001 | 11.3% | 4.4%(+6.92)#72 | 5.0%(+6.29)#4,122 |
| 73. | 48877 | 11.2% | 4.4%(+6.87)#73 | 5.0%(+6.25)#4,162 |
| 74. | 48414 | 11.1% | 4.4%(+6.75)#74 | 5.0%(+6.12)#4,265 |
| 75. | 49705 | 11.1% | 4.4%(+6.75)#75 | 5.0%(+6.12)#4,271 |
| 76. | 49613 | 11.0% | 4.4%(+6.65)#76 | 5.0%(+6.03)#4,350 |
| 77. | 49344 | 11.0% | 4.4%(+6.65)#77 | 5.0%(+6.02)#4,354 |
| 78. | 48768 | 11.0% | 4.4%(+6.59)#78 | 5.0%(+5.97)#4,403 |
| 79. | 49841 | 10.9% | 4.4%(+6.58)#79 | 5.0%(+5.95)#4,416 |
| 80. | 48861 | 10.9% | 4.4%(+6.54)#80 | 5.0%(+5.91)#4,452 |
| 81. | 49649 | 10.9% | 4.4%(+6.52)#81 | 5.0%(+5.89)#4,478 |
| 82. | 48857 | 10.9% | 4.4%(+6.52)#82 | 5.0%(+5.89)#4,479 |
| 83. | 49929 | 10.9% | 4.4%(+6.50)#83 | 5.0%(+5.88)#4,501 |
| 84. | 48419 | 10.9% | 4.4%(+6.50)#84 | 5.0%(+5.87)#4,506 |
| 85. | 49896 | 10.8% | 4.4%(+6.43)#85 | 5.0%(+5.80)#4,566 |
| 86. | 48074 | 10.8% | 4.4%(+6.42)#86 | 5.0%(+5.80)#4,568 |
| 87. | 48744 | 10.8% | 4.4%(+6.39)#87 | 5.0%(+5.76)#4,604 |
| 88. | 48750 | 10.7% | 4.4%(+6.35)#88 | 5.0%(+5.72)#4,629 |
| 89. | 48625 | 10.7% | 4.4%(+6.32)#89 | 5.0%(+5.69)#4,664 |
| 90. | 49648 | 10.6% | 4.4%(+6.27)#90 | 5.0%(+5.65)#4,715 |
| 91. | 48437 | 10.6% | 4.4%(+6.27)#91 | 5.0%(+5.64)#4,718 |
| 92. | 49970 | 10.6% | 4.4%(+6.27)#92 | 5.0%(+5.64)#4,719 |
| 93. | 49759 | 10.6% | 4.4%(+6.24)#93 | 5.0%(+5.61)#4,755 |
| 94. | 49755 | 10.6% | 4.4%(+6.19)#94 | 5.0%(+5.56)#4,797 |
| 95. | 49746 | 10.5% | 4.4%(+6.14)#95 | 5.0%(+5.51)#4,848 |
| 96. | 49776 | 10.5% | 4.4%(+6.10)#96 | 5.0%(+5.47)#4,899 |
| 97. | 48006 | 10.4% | 4.4%(+6.08)#97 | 5.0%(+5.45)#4,921 |
| 98. | 48002 | 10.4% | 4.4%(+6.01)#98 | 5.0%(+5.38)#4,996 |
| 99. | 49329 | 10.3% | 4.4%(+5.97)#99 | 5.0%(+5.34)#5,052 |
| 100. | 49768 | 10.3% | 4.4%(+5.95)#100 | 5.0%(+5.32)#5,064 |
Common Questions
What are the Top 10 Zip Codes with the Highest Percentage of Population Employed in Construction & Extraction in Michigan?
Top 10 Zip Codes with the Highest Percentage of Population Employed in Construction & Extraction in Michigan are:
What zip code has the Highest Percentage of Population Employed in Construction & Extraction in Michigan?
48724 has the Highest Percentage of Population Employed in Construction & Extraction in Michigan with 78.5%.
What is the Percentage of Population Employed in Construction & Extraction in the State of Michigan?
Percentage of Population Employed in Construction & Extraction in Michigan is 4.4%.
What is the Percentage of Population Employed in Construction & Extraction in the United States?
Percentage of Population Employed in Construction & Extraction in the United States is 5.0%.