Zip Codes with the Lowest Percentage of Single Mothers in Michigan
RELATED REPORTS & OPTIONS
Fewest Single Mothers
Michigan
Compare Zip Codes
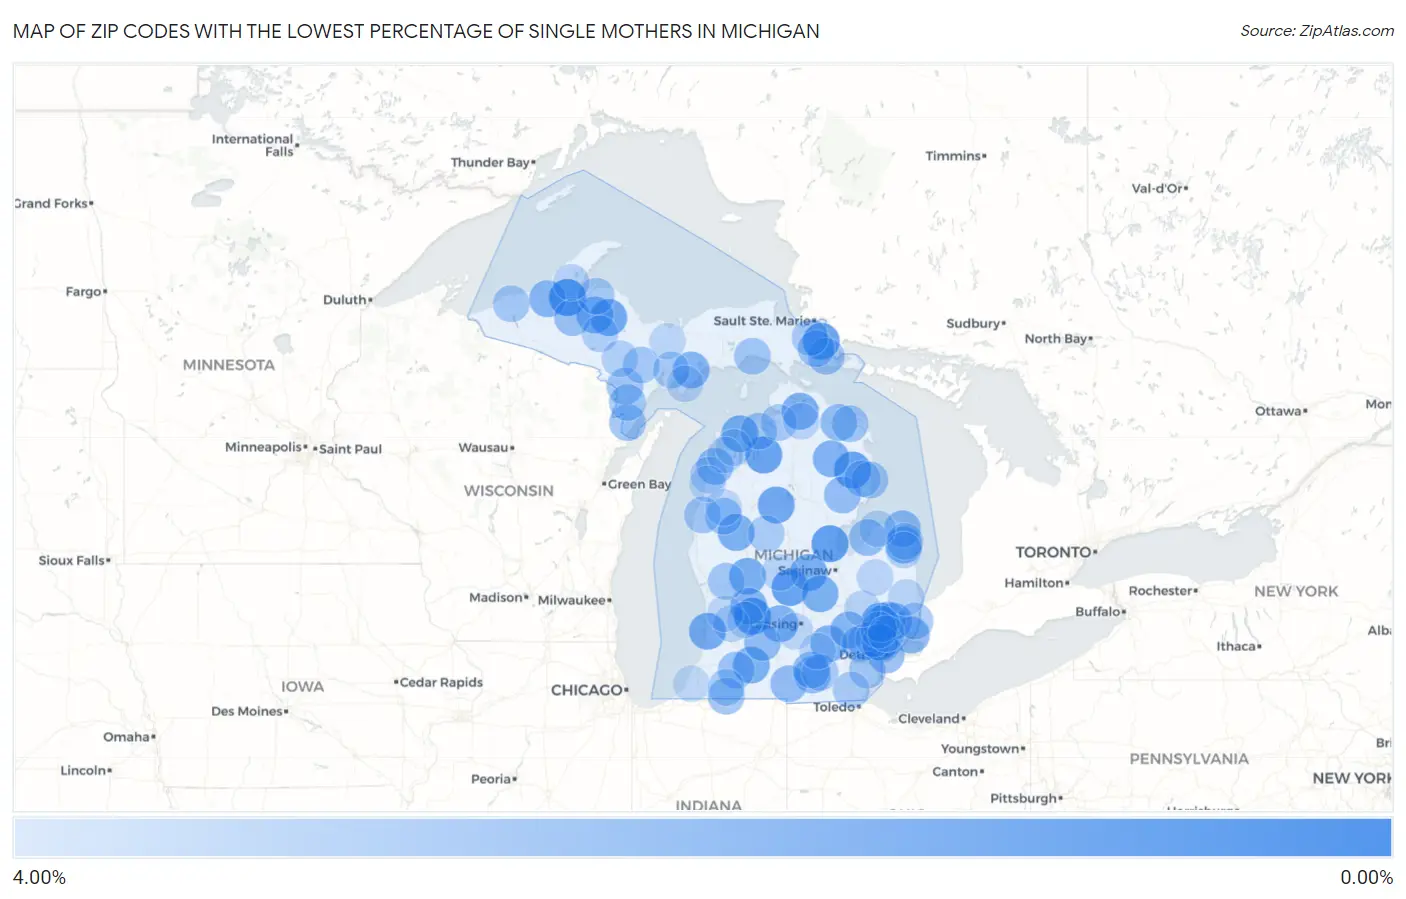
Map of Zip Codes with the Lowest Percentage of Single Mothers in Michigan
4.00%
0.00%
Zip Codes with the Lowest Percentage of Single Mothers in Michigan
| Zip Code | % Single Mothers | vs State | vs National | |
| 1. | 49958 | 0.43% | 11.08%(-10.7)#1 | 11.49%(-11.1)#57 |
| 2. | 49302 | 0.64% | 11.08%(-10.4)#2 | 11.49%(-10.8)#132 |
| 3. | 48634 | 0.69% | 11.08%(-10.4)#3 | 11.49%(-10.8)#155 |
| 4. | 49710 | 0.84% | 11.08%(-10.2)#4 | 11.49%(-10.6)#257 |
| 5. | 48856 | 0.88% | 11.08%(-10.2)#5 | 11.49%(-10.6)#281 |
| 6. | 49612 | 0.91% | 11.08%(-10.2)#6 | 11.49%(-10.6)#296 |
| 7. | 48705 | 0.94% | 11.08%(-10.1)#7 | 11.49%(-10.5)#325 |
| 8. | 48363 | 1.01% | 11.08%(-10.1)#8 | 11.49%(-10.5)#381 |
| 9. | 49632 | 1.09% | 11.08%(-9.99)#9 | 11.49%(-10.4)#448 |
| 10. | 49814 | 1.13% | 11.08%(-9.95)#10 | 11.49%(-10.4)#481 |
| 11. | 49406 | 1.23% | 11.08%(-9.86)#11 | 11.49%(-10.3)#562 |
| 12. | 49670 | 1.34% | 11.08%(-9.74)#12 | 11.49%(-10.1)#642 |
| 13. | 48662 | 1.36% | 11.08%(-9.73)#13 | 11.49%(-10.1)#652 |
| 14. | 49339 | 1.38% | 11.08%(-9.71)#14 | 11.49%(-10.1)#666 |
| 15. | 49623 | 1.43% | 11.08%(-9.66)#15 | 11.49%(-10.1)#713 |
| 16. | 48841 | 1.44% | 11.08%(-9.65)#16 | 11.49%(-10.1)#724 |
| 17. | 49088 | 1.45% | 11.08%(-9.64)#17 | 11.49%(-10.0)#737 |
| 18. | 48069 | 1.45% | 11.08%(-9.63)#18 | 11.49%(-10.0)#749 |
| 19. | 49749 | 1.49% | 11.08%(-9.59)#19 | 11.49%(-10.00)#780 |
| 20. | 48137 | 1.54% | 11.08%(-9.55)#20 | 11.49%(-9.95)#822 |
| 21. | 48861 | 1.58% | 11.08%(-9.51)#21 | 11.49%(-9.91)#861 |
| 22. | 48619 | 1.59% | 11.08%(-9.50)#22 | 11.49%(-9.90)#875 |
| 23. | 49861 | 1.62% | 11.08%(-9.46)#23 | 11.49%(-9.87)#909 |
| 24. | 48028 | 1.63% | 11.08%(-9.46)#24 | 11.49%(-9.86)#917 |
| 25. | 49301 | 1.66% | 11.08%(-9.42)#25 | 11.49%(-9.82)#947 |
| 26. | 49817 | 1.67% | 11.08%(-9.42)#26 | 11.49%(-9.82)#951 |
| 27. | 48470 | 1.67% | 11.08%(-9.42)#27 | 11.49%(-9.82)#952 |
| 28. | 48353 | 1.69% | 11.08%(-9.39)#28 | 11.49%(-9.80)#970 |
| 29. | 48096 | 1.69% | 11.08%(-9.39)#29 | 11.49%(-9.80)#971 |
| 30. | 49948 | 1.70% | 11.08%(-9.38)#30 | 11.49%(-9.78)#992 |
| 31. | 48468 | 1.88% | 11.08%(-9.21)#31 | 11.49%(-9.61)#1,164 |
| 32. | 49233 | 1.93% | 11.08%(-9.16)#32 | 11.49%(-9.56)#1,224 |
| 33. | 49640 | 1.94% | 11.08%(-9.14)#33 | 11.49%(-9.54)#1,249 |
| 34. | 49743 | 1.98% | 11.08%(-9.11)#34 | 11.49%(-9.51)#1,278 |
| 35. | 49050 | 2.00% | 11.08%(-9.09)#35 | 11.49%(-9.49)#1,300 |
| 36. | 48226 | 2.04% | 11.08%(-9.05)#36 | 11.49%(-9.45)#1,353 |
| 37. | 49227 | 2.05% | 11.08%(-9.04)#37 | 11.49%(-9.44)#1,366 |
| 38. | 48739 | 2.05% | 11.08%(-9.03)#38 | 11.49%(-9.44)#1,371 |
| 39. | 48720 | 2.08% | 11.08%(-9.00)#39 | 11.49%(-9.40)#1,402 |
| 40. | 49234 | 2.09% | 11.08%(-9.00)#40 | 11.49%(-9.40)#1,414 |
| 41. | 49736 | 2.14% | 11.08%(-8.94)#41 | 11.49%(-9.34)#1,486 |
| 42. | 49970 | 2.15% | 11.08%(-8.93)#42 | 11.49%(-9.34)#1,503 |
| 43. | 48331 | 2.18% | 11.08%(-8.91)#43 | 11.49%(-9.31)#1,534 |
| 44. | 49893 | 2.18% | 11.08%(-8.91)#44 | 11.49%(-9.31)#1,536 |
| 45. | 49774 | 2.20% | 11.08%(-8.88)#45 | 11.49%(-9.29)#1,559 |
| 46. | 48095 | 2.21% | 11.08%(-8.88)#46 | 11.49%(-9.28)#1,563 |
| 47. | 48738 | 2.23% | 11.08%(-8.86)#47 | 11.49%(-9.26)#1,588 |
| 48. | 49644 | 2.23% | 11.08%(-8.85)#48 | 11.49%(-9.25)#1,598 |
| 49. | 49087 | 2.24% | 11.08%(-8.85)#49 | 11.49%(-9.25)#1,603 |
| 50. | 49130 | 2.24% | 11.08%(-8.85)#50 | 11.49%(-9.25)#1,605 |
| 51. | 48374 | 2.26% | 11.08%(-8.83)#51 | 11.49%(-9.23)#1,631 |
| 52. | 49847 | 2.33% | 11.08%(-8.76)#52 | 11.49%(-9.16)#1,701 |
| 53. | 49729 | 2.33% | 11.08%(-8.75)#53 | 11.49%(-9.16)#1,711 |
| 54. | 49303 | 2.35% | 11.08%(-8.74)#54 | 11.49%(-9.14)#1,734 |
| 55. | 49776 | 2.35% | 11.08%(-8.73)#55 | 11.49%(-9.13)#1,740 |
| 56. | 49411 | 2.38% | 11.08%(-8.70)#56 | 11.49%(-9.11)#1,775 |
| 57. | 49762 | 2.38% | 11.08%(-8.70)#57 | 11.49%(-9.11)#1,778 |
| 58. | 49821 | 2.40% | 11.08%(-8.69)#58 | 11.49%(-9.09)#1,795 |
| 59. | 48164 | 2.40% | 11.08%(-8.68)#59 | 11.49%(-9.08)#1,806 |
| 60. | 49818 | 2.46% | 11.08%(-8.62)#60 | 11.49%(-9.03)#1,879 |
| 61. | 48054 | 2.47% | 11.08%(-8.61)#61 | 11.49%(-9.01)#1,891 |
| 62. | 49971 | 2.48% | 11.08%(-8.61)#62 | 11.49%(-9.01)#1,899 |
| 63. | 48301 | 2.52% | 11.08%(-8.57)#63 | 11.49%(-8.97)#1,946 |
| 64. | 49878 | 2.52% | 11.08%(-8.56)#64 | 11.49%(-8.97)#1,948 |
| 65. | 49962 | 2.53% | 11.08%(-8.55)#65 | 11.49%(-8.96)#1,973 |
| 66. | 49230 | 2.56% | 11.08%(-8.52)#66 | 11.49%(-8.92)#2,009 |
| 67. | 49796 | 2.56% | 11.08%(-8.52)#67 | 11.49%(-8.92)#2,022 |
| 68. | 49270 | 2.57% | 11.08%(-8.51)#68 | 11.49%(-8.92)#2,028 |
| 69. | 48745 | 2.59% | 11.08%(-8.50)#69 | 11.49%(-8.90)#2,047 |
| 70. | 48070 | 2.59% | 11.08%(-8.49)#70 | 11.49%(-8.90)#2,054 |
| 71. | 48306 | 2.61% | 11.08%(-8.47)#71 | 11.49%(-8.88)#2,079 |
| 72. | 49724 | 2.61% | 11.08%(-8.47)#72 | 11.49%(-8.88)#2,080 |
| 73. | 49095 | 2.65% | 11.08%(-8.43)#73 | 11.49%(-8.84)#2,133 |
| 74. | 49679 | 2.66% | 11.08%(-8.42)#74 | 11.49%(-8.82)#2,153 |
| 75. | 48441 | 2.69% | 11.08%(-8.40)#75 | 11.49%(-8.80)#2,179 |
| 76. | 49879 | 2.74% | 11.08%(-8.34)#76 | 11.49%(-8.74)#2,256 |
| 77. | 49831 | 2.78% | 11.08%(-8.31)#77 | 11.49%(-8.71)#2,292 |
| 78. | 49635 | 2.78% | 11.08%(-8.30)#78 | 11.49%(-8.71)#2,299 |
| 79. | 49653 | 2.88% | 11.08%(-8.20)#79 | 11.49%(-8.60)#2,432 |
| 80. | 48456 | 2.88% | 11.08%(-8.20)#80 | 11.49%(-8.60)#2,434 |
| 81. | 49323 | 2.91% | 11.08%(-8.18)#81 | 11.49%(-8.58)#2,469 |
| 82. | 48725 | 2.91% | 11.08%(-8.17)#82 | 11.49%(-8.57)#2,477 |
| 83. | 49916 | 2.93% | 11.08%(-8.16)#83 | 11.49%(-8.56)#2,497 |
| 84. | 48309 | 2.94% | 11.08%(-8.15)#84 | 11.49%(-8.55)#2,509 |
| 85. | 49835 | 2.96% | 11.08%(-8.13)#85 | 11.49%(-8.53)#2,540 |
| 86. | 48006 | 2.96% | 11.08%(-8.13)#86 | 11.49%(-8.53)#2,543 |
| 87. | 48891 | 2.99% | 11.08%(-8.10)#87 | 11.49%(-8.50)#2,599 |
| 88. | 48438 | 3.00% | 11.08%(-8.09)#88 | 11.49%(-8.49)#2,603 |
| 89. | 49799 | 3.01% | 11.08%(-8.07)#89 | 11.49%(-8.48)#2,623 |
| 90. | 48760 | 3.04% | 11.08%(-8.05)#90 | 11.49%(-8.45)#2,683 |
| 91. | 49316 | 3.07% | 11.08%(-8.01)#91 | 11.49%(-8.41)#2,732 |
| 92. | 48821 | 3.09% | 11.08%(-7.99)#92 | 11.49%(-8.40)#2,755 |
| 93. | 49664 | 3.11% | 11.08%(-7.97)#93 | 11.49%(-8.37)#2,798 |
| 94. | 49689 | 3.12% | 11.08%(-7.97)#94 | 11.49%(-8.37)#2,802 |
| 95. | 49259 | 3.12% | 11.08%(-7.97)#95 | 11.49%(-8.37)#2,804 |
| 96. | 48314 | 3.12% | 11.08%(-7.96)#96 | 11.49%(-8.37)#2,808 |
| 97. | 49816 | 3.12% | 11.08%(-7.96)#97 | 11.49%(-8.36)#2,814 |
| 98. | 49426 | 3.16% | 11.08%(-7.92)#98 | 11.49%(-8.33)#2,878 |
| 99. | 49613 | 3.18% | 11.08%(-7.90)#99 | 11.49%(-8.30)#2,919 |
| 100. | 49101 | 3.19% | 11.08%(-7.89)#100 | 11.49%(-8.30)#2,926 |
Common Questions
What are the Top 10 Zip Codes with the Lowest Percentage of Single Mothers in Michigan?
Top 10 Zip Codes with the Lowest Percentage of Single Mothers in Michigan are:
What zip code has the Lowest Percentage of Single Mothers in Michigan?
49958 has the Lowest Percentage of Single Mothers in Michigan with 0.43%.
What is the Percentage of Single Mothers in the State of Michigan?
Percentage of Single Mothers in Michigan is 11.08%.
What is the Percentage of Single Mothers in the United States?
Percentage of Single Mothers in the United States is 11.49%.