Zip Codes with the Highest Percentage of Population Employed in Food Preparation & Serving in Midland, MI
RELATED REPORTS & OPTIONS
Food Preparation & Serving
Midland
Compare Zip Codes
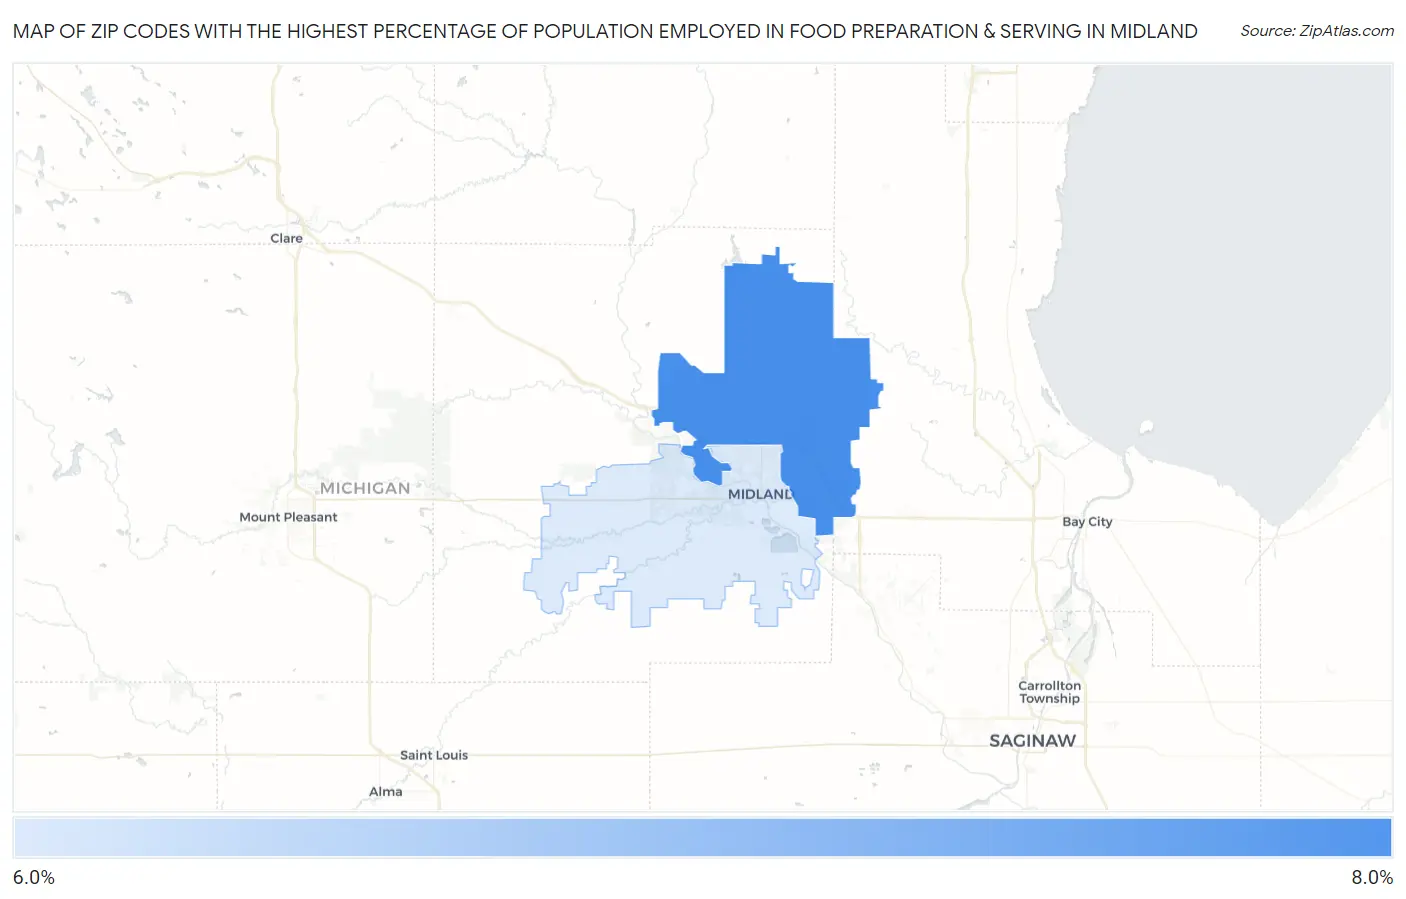
Map of Zip Codes with the Highest Percentage of Population Employed in Food Preparation & Serving in Midland
6.3%
6.3%
Zip Codes with the Highest Percentage of Population Employed in Food Preparation & Serving in Midland, MI
| Zip Code | % Employed | vs State | vs National | |
| 1. | 48642 | 6.3% | 5.7%(+0.646)#302 | 5.3%(+1.03)#8,381 |
| 2. | 48640 | 6.3% | 5.7%(+0.587)#308 | 5.3%(+0.974)#8,548 |
1
Common Questions
What are the Top Zip Codes with the Highest Percentage of Population Employed in Food Preparation & Serving in Midland, MI?
Top Zip Codes with the Highest Percentage of Population Employed in Food Preparation & Serving in Midland, MI are:
What zip code has the Highest Percentage of Population Employed in Food Preparation & Serving in Midland, MI?
48642 has the Highest Percentage of Population Employed in Food Preparation & Serving in Midland, MI with 6.3%.
What is the Percentage of Population Employed in Food Preparation & Serving in Midland, MI?
Percentage of Population Employed in Food Preparation & Serving in Midland is 7.2%.
What is the Percentage of Population Employed in Food Preparation & Serving in Michigan?
Percentage of Population Employed in Food Preparation & Serving in Michigan is 5.7%.
What is the Percentage of Population Employed in Food Preparation & Serving in the United States?
Percentage of Population Employed in Food Preparation & Serving in the United States is 5.3%.