Zip Codes with the Highest Percentage of Households with Income Above $200,000 in Michigan
RELATED REPORTS & OPTIONS
Household Income | $200k+
Michigan
Compare Zip Codes
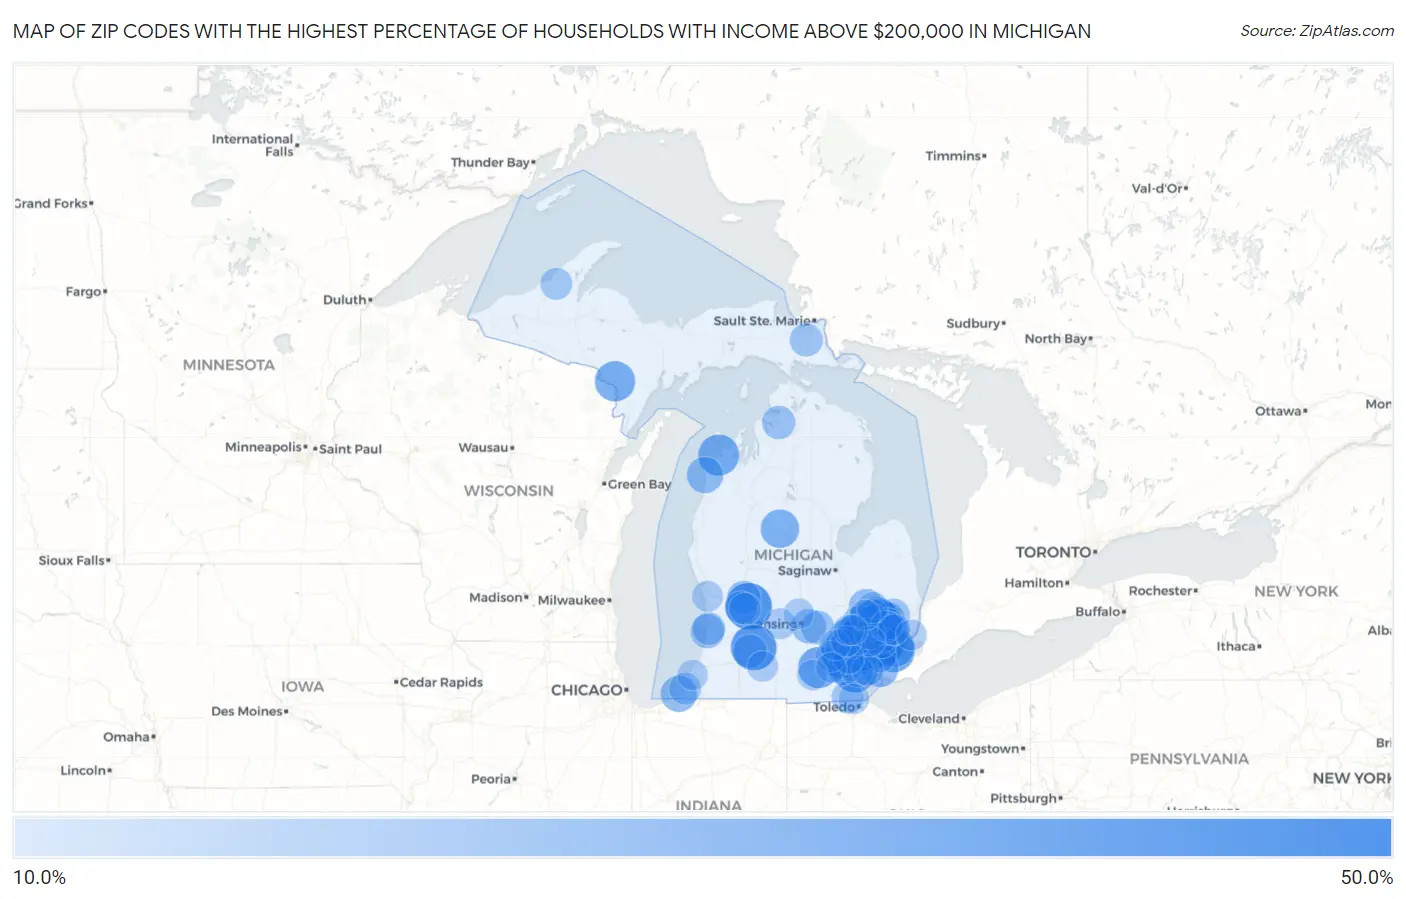
Map of Zip Codes with the Highest Percentage of Households with Income Above $200,000 in Michigan
10.0%
50.0%
Zip Codes with the Highest Percentage of Households with Income Above $200,000 in Michigan
| Zip Code | Households with Income > $200k | vs State | vs National | |
| 1. | 48374 | 45.2% | 8.2%(+37.0)#1 | 11.4%(+33.8)#421 |
| 2. | 48070 | 44.9% | 8.2%(+36.7)#2 | 11.4%(+33.5)#432 |
| 3. | 48302 | 43.2% | 8.2%(+35.0)#3 | 11.4%(+31.8)#494 |
| 4. | 48025 | 41.7% | 8.2%(+33.5)#4 | 11.4%(+30.3)#563 |
| 5. | 48301 | 40.3% | 8.2%(+32.1)#5 | 11.4%(+28.9)#635 |
| 6. | 48168 | 40.0% | 8.2%(+31.8)#6 | 11.4%(+28.6)#646 |
| 7. | 49301 | 40.0% | 8.2%(+31.8)#7 | 11.4%(+28.6)#647 |
| 8. | 48009 | 38.8% | 8.2%(+30.6)#8 | 11.4%(+27.4)#722 |
| 9. | 49060 | 38.7% | 8.2%(+30.5)#9 | 11.4%(+27.3)#732 |
| 10. | 48190 | 37.5% | 8.2%(+29.3)#10 | 11.4%(+26.1)#805 |
| 11. | 48098 | 37.1% | 8.2%(+28.9)#11 | 11.4%(+25.7)#829 |
| 12. | 48306 | 36.3% | 8.2%(+28.1)#12 | 11.4%(+24.9)#887 |
| 13. | 48069 | 35.6% | 8.2%(+27.4)#13 | 11.4%(+24.2)#932 |
| 14. | 48304 | 35.5% | 8.2%(+27.3)#14 | 11.4%(+24.1)#942 |
| 15. | 48363 | 34.6% | 8.2%(+26.4)#15 | 11.4%(+23.2)#1,006 |
| 16. | 48323 | 34.3% | 8.2%(+26.1)#16 | 11.4%(+22.9)#1,034 |
| 17. | 48230 | 32.5% | 8.2%(+24.3)#17 | 11.4%(+21.1)#1,208 |
| 18. | 49261 | 31.5% | 8.2%(+23.3)#18 | 11.4%(+20.1)#1,301 |
| 19. | 48324 | 31.2% | 8.2%(+23.0)#19 | 11.4%(+19.8)#1,330 |
| 20. | 49636 | 31.2% | 8.2%(+23.0)#20 | 11.4%(+19.8)#1,333 |
| 21. | 49852 | 30.0% | 8.2%(+21.8)#21 | 11.4%(+18.6)#1,459 |
| 22. | 48236 | 28.1% | 8.2%(+19.9)#22 | 11.4%(+16.7)#1,702 |
| 23. | 48178 | 28.0% | 8.2%(+19.8)#23 | 11.4%(+16.6)#1,720 |
| 24. | 48633 | 27.1% | 8.2%(+18.9)#24 | 11.4%(+15.7)#1,872 |
| 25. | 48103 | 25.6% | 8.2%(+17.4)#25 | 11.4%(+14.2)#2,076 |
| 26. | 48348 | 25.3% | 8.2%(+17.1)#26 | 11.4%(+13.9)#2,128 |
| 27. | 48380 | 25.1% | 8.2%(+16.9)#27 | 11.4%(+13.7)#2,177 |
| 28. | 48130 | 24.6% | 8.2%(+16.4)#28 | 11.4%(+13.2)#2,266 |
| 29. | 48309 | 24.4% | 8.2%(+16.2)#29 | 11.4%(+13.0)#2,292 |
| 30. | 48138 | 24.4% | 8.2%(+16.2)#30 | 11.4%(+13.0)#2,299 |
| 31. | 48382 | 24.2% | 8.2%(+16.0)#31 | 11.4%(+12.8)#2,333 |
| 32. | 48167 | 24.2% | 8.2%(+16.0)#32 | 11.4%(+12.8)#2,334 |
| 33. | 48085 | 24.1% | 8.2%(+15.9)#33 | 11.4%(+12.7)#2,349 |
| 34. | 49129 | 23.6% | 8.2%(+15.4)#34 | 11.4%(+12.2)#2,454 |
| 35. | 49628 | 23.6% | 8.2%(+15.4)#35 | 11.4%(+12.2)#2,456 |
| 36. | 48370 | 23.3% | 8.2%(+15.1)#36 | 11.4%(+11.9)#2,505 |
| 37. | 48105 | 22.8% | 8.2%(+14.6)#37 | 11.4%(+11.4)#2,596 |
| 38. | 48381 | 22.4% | 8.2%(+14.2)#38 | 11.4%(+11.0)#2,695 |
| 39. | 48170 | 22.2% | 8.2%(+14.0)#39 | 11.4%(+10.8)#2,725 |
| 40. | 48095 | 22.0% | 8.2%(+13.8)#40 | 11.4%(+10.6)#2,786 |
| 41. | 48322 | 21.4% | 8.2%(+13.2)#41 | 11.4%(+10.00)#2,898 |
| 42. | 48360 | 20.9% | 8.2%(+12.7)#42 | 11.4%(+9.50)#3,058 |
| 43. | 48864 | 20.7% | 8.2%(+12.5)#43 | 11.4%(+9.30)#3,107 |
| 44. | 48440 | 20.7% | 8.2%(+12.5)#44 | 11.4%(+9.30)#3,122 |
| 45. | 48188 | 20.6% | 8.2%(+12.4)#45 | 11.4%(+9.20)#3,124 |
| 46. | 48331 | 20.6% | 8.2%(+12.4)#46 | 11.4%(+9.20)#3,130 |
| 47. | 49406 | 20.0% | 8.2%(+11.8)#47 | 11.4%(+8.60)#3,294 |
| 48. | 48114 | 19.9% | 8.2%(+11.7)#48 | 11.4%(+8.50)#3,319 |
| 49. | 49083 | 19.7% | 8.2%(+11.5)#49 | 11.4%(+8.30)#3,375 |
| 50. | 48375 | 19.5% | 8.2%(+11.3)#50 | 11.4%(+8.10)#3,427 |
| 51. | 48895 | 19.4% | 8.2%(+11.2)#51 | 11.4%(+8.00)#3,471 |
| 52. | 49306 | 19.1% | 8.2%(+10.9)#52 | 11.4%(+7.70)#3,547 |
| 53. | 49796 | 19.0% | 8.2%(+10.8)#53 | 11.4%(+7.60)#3,580 |
| 54. | 48350 | 18.5% | 8.2%(+10.3)#54 | 11.4%(+7.10)#3,709 |
| 55. | 48187 | 18.3% | 8.2%(+10.1)#55 | 11.4%(+6.90)#3,741 |
| 56. | 49752 | 18.3% | 8.2%(+10.1)#56 | 11.4%(+6.90)#3,762 |
| 57. | 48176 | 17.8% | 8.2%(+9.60)#57 | 11.4%(+6.40)#3,903 |
| 58. | 48084 | 17.8% | 8.2%(+9.60)#58 | 11.4%(+6.40)#3,906 |
| 59. | 49453 | 17.8% | 8.2%(+9.60)#59 | 11.4%(+6.40)#3,919 |
| 60. | 49506 | 17.6% | 8.2%(+9.40)#60 | 11.4%(+6.20)#3,961 |
| 61. | 48005 | 17.6% | 8.2%(+9.40)#61 | 11.4%(+6.20)#3,980 |
| 62. | 48315 | 17.5% | 8.2%(+9.30)#62 | 11.4%(+6.10)#4,010 |
| 63. | 48307 | 17.2% | 8.2%(+9.00)#63 | 11.4%(+5.80)#4,097 |
| 64. | 48120 | 17.2% | 8.2%(+9.00)#64 | 11.4%(+5.80)#4,118 |
| 65. | 48367 | 17.2% | 8.2%(+9.00)#65 | 11.4%(+5.80)#4,123 |
| 66. | 48042 | 17.1% | 8.2%(+8.90)#66 | 11.4%(+5.70)#4,143 |
| 67. | 48383 | 16.9% | 8.2%(+8.70)#67 | 11.4%(+5.50)#4,227 |
| 68. | 48143 | 16.9% | 8.2%(+8.70)#68 | 11.4%(+5.50)#4,242 |
| 69. | 49267 | 16.7% | 8.2%(+8.50)#69 | 11.4%(+5.30)#4,300 |
| 70. | 49125 | 16.6% | 8.2%(+8.40)#70 | 11.4%(+5.20)#4,346 |
| 71. | 49965 | 16.6% | 8.2%(+8.40)#71 | 11.4%(+5.20)#4,353 |
| 72. | 49546 | 16.4% | 8.2%(+8.20)#72 | 11.4%(+5.00)#4,408 |
| 73. | 48165 | 16.4% | 8.2%(+8.20)#73 | 11.4%(+5.00)#4,419 |
| 74. | 48191 | 16.2% | 8.2%(+8.00)#74 | 11.4%(+4.80)#4,499 |
| 75. | 48067 | 16.1% | 8.2%(+7.90)#75 | 11.4%(+4.70)#4,519 |
| 76. | 48371 | 16.0% | 8.2%(+7.80)#76 | 11.4%(+4.60)#4,561 |
| 77. | 48164 | 16.0% | 8.2%(+7.80)#77 | 11.4%(+4.60)#4,575 |
| 78. | 48362 | 15.9% | 8.2%(+7.70)#78 | 11.4%(+4.50)#4,612 |
| 79. | 48094 | 15.8% | 8.2%(+7.60)#79 | 11.4%(+4.40)#4,650 |
| 80. | 48118 | 15.7% | 8.2%(+7.50)#80 | 11.4%(+4.30)#4,693 |
| 81. | 48320 | 15.6% | 8.2%(+7.40)#81 | 11.4%(+4.20)#4,738 |
| 82. | 48316 | 15.5% | 8.2%(+7.30)#82 | 11.4%(+4.10)#4,757 |
| 83. | 48455 | 15.5% | 8.2%(+7.30)#83 | 11.4%(+4.10)#4,772 |
| 84. | 48044 | 15.1% | 8.2%(+6.90)#84 | 11.4%(+3.70)#4,928 |
| 85. | 48028 | 15.1% | 8.2%(+6.90)#85 | 11.4%(+3.70)#4,963 |
| 86. | 49456 | 15.0% | 8.2%(+6.80)#86 | 11.4%(+3.60)#4,984 |
| 87. | 49233 | 14.9% | 8.2%(+6.70)#87 | 11.4%(+3.50)#5,050 |
| 88. | 48861 | 14.9% | 8.2%(+6.70)#88 | 11.4%(+3.50)#5,052 |
| 89. | 48334 | 14.8% | 8.2%(+6.60)#89 | 11.4%(+3.40)#5,082 |
| 90. | 48104 | 14.7% | 8.2%(+6.50)#90 | 11.4%(+3.30)#5,114 |
| 91. | 48116 | 14.7% | 8.2%(+6.50)#91 | 11.4%(+3.30)#5,124 |
| 92. | 48169 | 14.6% | 8.2%(+6.40)#92 | 11.4%(+3.20)#5,181 |
| 93. | 48353 | 14.6% | 8.2%(+6.40)#93 | 11.4%(+3.20)#5,192 |
| 94. | 49051 | 14.6% | 8.2%(+6.40)#94 | 11.4%(+3.20)#5,198 |
| 95. | 48462 | 14.5% | 8.2%(+6.30)#95 | 11.4%(+3.10)#5,225 |
| 96. | 48144 | 14.5% | 8.2%(+6.30)#96 | 11.4%(+3.10)#5,226 |
| 97. | 48357 | 14.5% | 8.2%(+6.30)#97 | 11.4%(+3.10)#5,227 |
| 98. | 48820 | 14.3% | 8.2%(+6.10)#98 | 11.4%(+2.90)#5,308 |
| 99. | 49085 | 14.2% | 8.2%(+6.00)#99 | 11.4%(+2.80)#5,358 |
| 100. | 48158 | 14.2% | 8.2%(+6.00)#100 | 11.4%(+2.80)#5,372 |
Common Questions
What are the Top 10 Zip Codes with the Highest Percentage of Households with Income Above $200,000 in Michigan?
Top 10 Zip Codes with the Highest Percentage of Households with Income Above $200,000 in Michigan are:
What zip code has the Highest Percentage of Households with Income Above $200,000 in Michigan?
48374 has the Highest Percentage of Households with Income Above $200,000 in Michigan with 45.2%.
What is the Percentage of Households with Income Above $200,000 in the State of Michigan?
Percentage of Households with Income Above $200,000 in Michigan is 8.2%.
What is the Percentage of Households with Income Above $200,000 in the United States?
Percentage of Households with Income Above $200,000 in the United States is 11.4%.