Zip Codes with the Highest Percentage of Population Employed in Food Preparation & Serving in Burton, MI
RELATED REPORTS & OPTIONS
Food Preparation & Serving
Burton
Compare Zip Codes
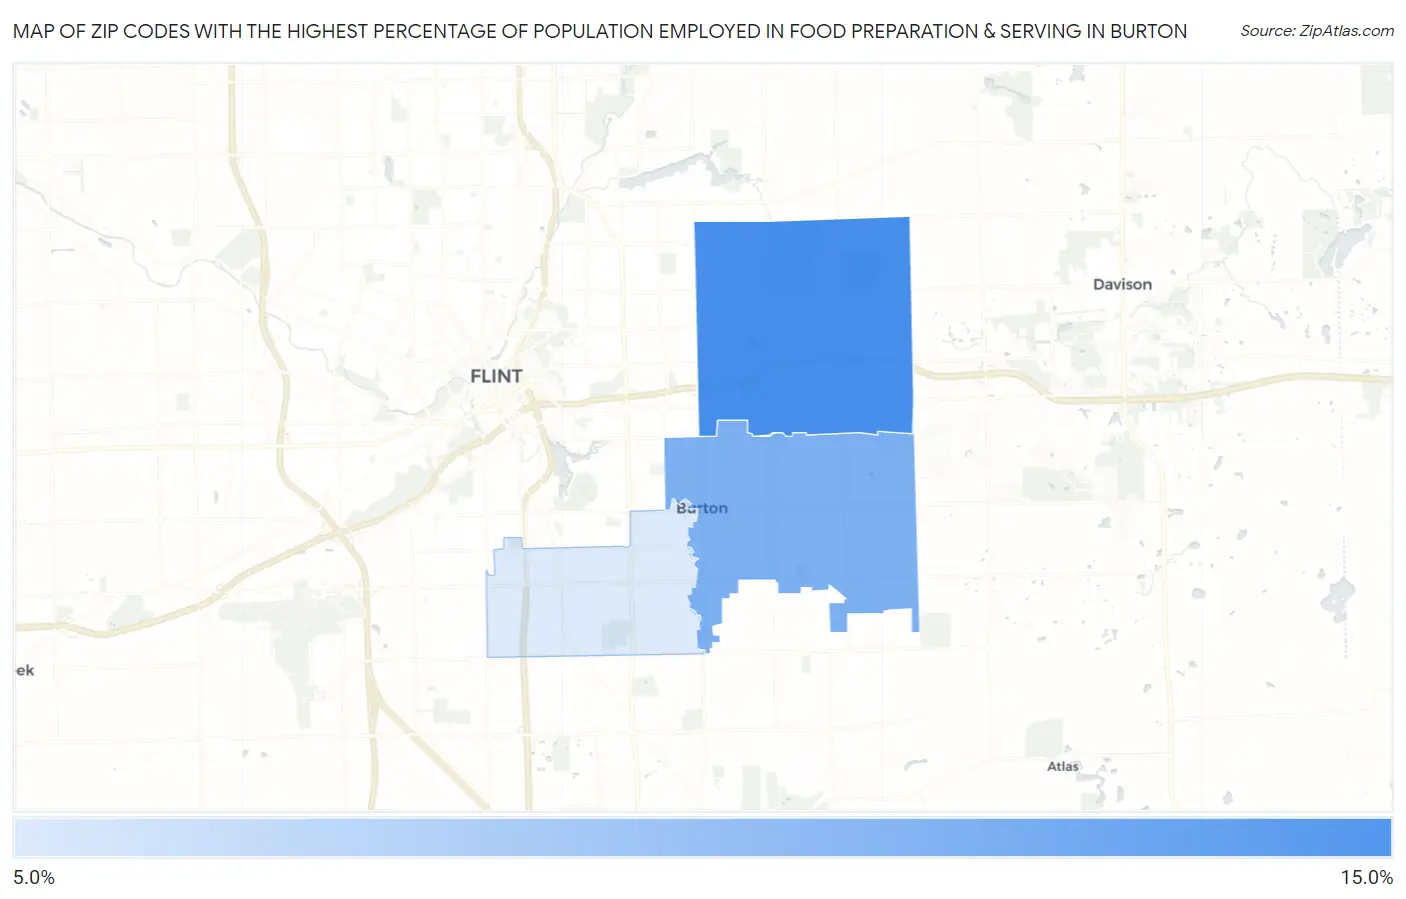
Map of Zip Codes with the Highest Percentage of Population Employed in Food Preparation & Serving in Burton
5.6%
10.0%
Zip Codes with the Highest Percentage of Population Employed in Food Preparation & Serving in Burton, MI
| Zip Code | % Employed | vs State | vs National | |
| 1. | 48509 | 10.0% | 5.7%(+4.37)#67 | 5.3%(+4.76)#2,596 |
| 2. | 48519 | 8.5% | 5.7%(+2.78)#127 | 5.3%(+3.17)#4,113 |
| 3. | 48529 | 5.6% | 5.7%(-0.038)#397 | 5.3%(+0.348)#10,579 |
1
Common Questions
What are the Top Zip Codes with the Highest Percentage of Population Employed in Food Preparation & Serving in Burton, MI?
Top Zip Codes with the Highest Percentage of Population Employed in Food Preparation & Serving in Burton, MI are:
What zip code has the Highest Percentage of Population Employed in Food Preparation & Serving in Burton, MI?
48509 has the Highest Percentage of Population Employed in Food Preparation & Serving in Burton, MI with 10.0%.
What is the Percentage of Population Employed in Food Preparation & Serving in Burton, MI?
Percentage of Population Employed in Food Preparation & Serving in Burton is 7.4%.
What is the Percentage of Population Employed in Food Preparation & Serving in Michigan?
Percentage of Population Employed in Food Preparation & Serving in Michigan is 5.7%.
What is the Percentage of Population Employed in Food Preparation & Serving in the United States?
Percentage of Population Employed in Food Preparation & Serving in the United States is 5.3%.