Zip Codes with the Highest Percentage of Population Employed in Food Preparation & Serving in Livonia, MI
RELATED REPORTS & OPTIONS
Food Preparation & Serving
Livonia
Compare Zip Codes
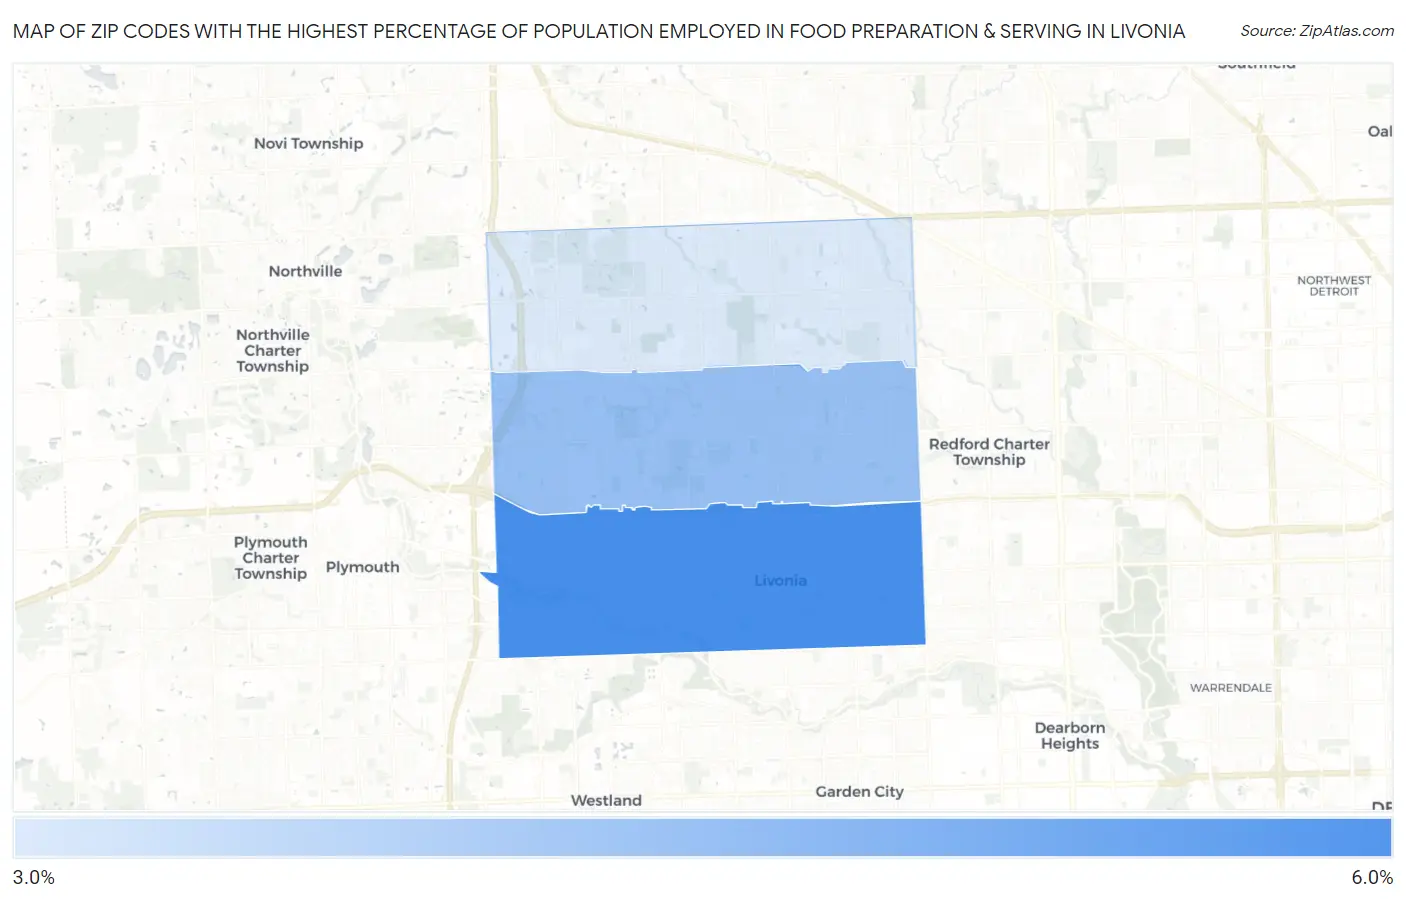
Map of Zip Codes with the Highest Percentage of Population Employed in Food Preparation & Serving in Livonia
3.4%
5.7%
Zip Codes with the Highest Percentage of Population Employed in Food Preparation & Serving in Livonia, MI
| Zip Code | % Employed | vs State | vs National | |
| 1. | 48150 | 5.7% | 5.7%(+0.012)#394 | 5.3%(+0.399)#10,405 |
| 2. | 48154 | 4.4% | 5.7%(-1.22)#569 | 5.3%(-0.838)#15,209 |
| 3. | 48152 | 3.4% | 5.7%(-2.27)#741 | 5.3%(-1.88)#19,612 |
1
Common Questions
What are the Top Zip Codes with the Highest Percentage of Population Employed in Food Preparation & Serving in Livonia, MI?
Top Zip Codes with the Highest Percentage of Population Employed in Food Preparation & Serving in Livonia, MI are:
What zip code has the Highest Percentage of Population Employed in Food Preparation & Serving in Livonia, MI?
48150 has the Highest Percentage of Population Employed in Food Preparation & Serving in Livonia, MI with 5.7%.
What is the Percentage of Population Employed in Food Preparation & Serving in Livonia, MI?
Percentage of Population Employed in Food Preparation & Serving in Livonia is 4.5%.
What is the Percentage of Population Employed in Food Preparation & Serving in Michigan?
Percentage of Population Employed in Food Preparation & Serving in Michigan is 5.7%.
What is the Percentage of Population Employed in Food Preparation & Serving in the United States?
Percentage of Population Employed in Food Preparation & Serving in the United States is 5.3%.