Zip Codes with the Highest Percentage of Households Heated by Fuel Oil / Kerosene in Michigan
RELATED REPORTS & OPTIONS
Fuel Oil Heating
Michigan
Compare Zip Codes
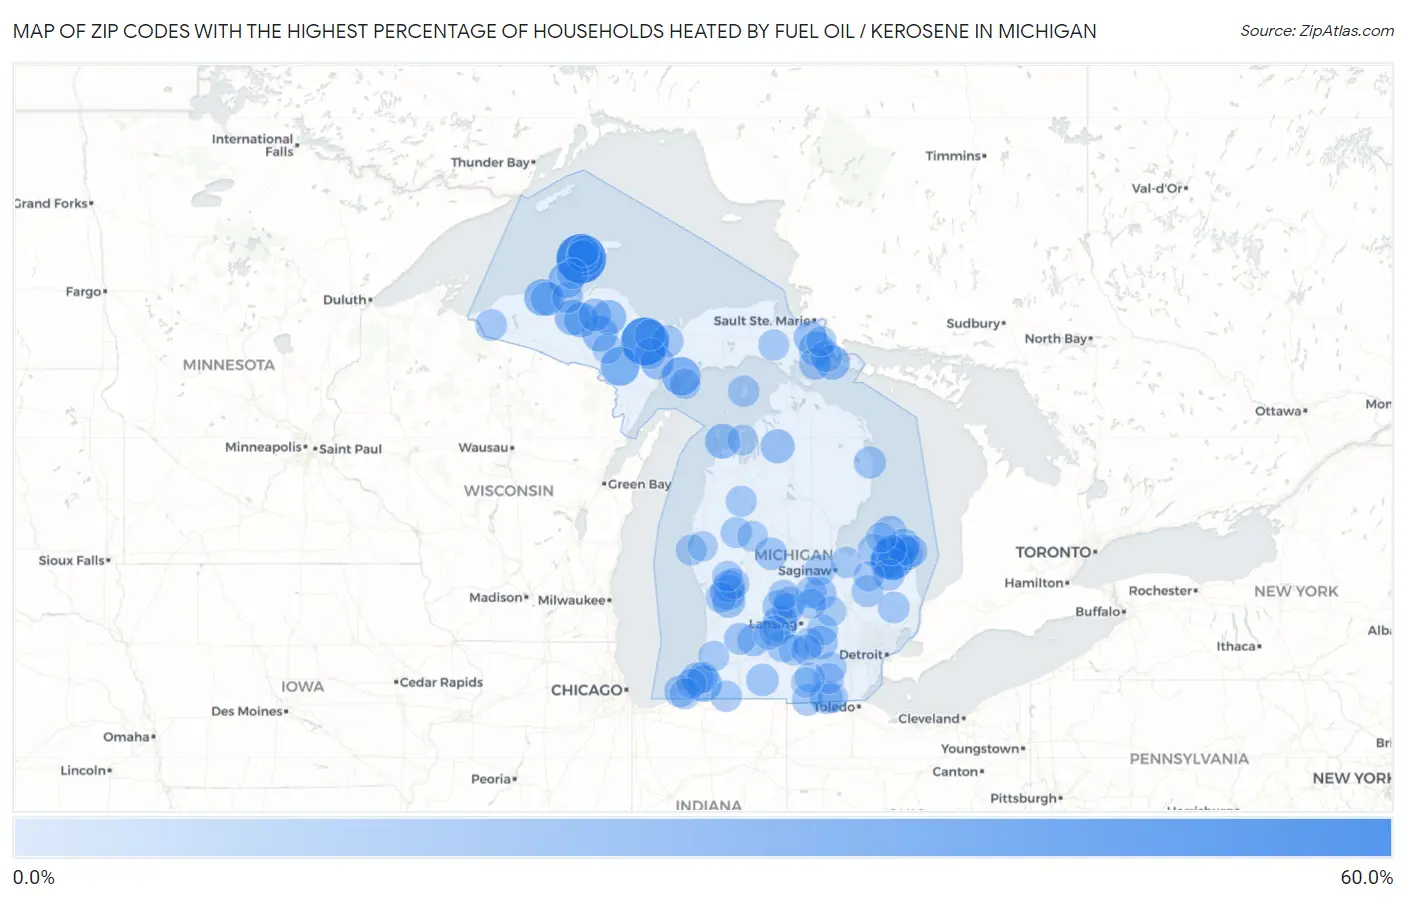
Map of Zip Codes with the Highest Percentage of Households Heated by Fuel Oil / Kerosene in Michigan
0.0%
60.0%
Zip Codes with the Highest Percentage of Households Heated by Fuel Oil / Kerosene in Michigan
| Zip Code | Fuel Oil Heating | vs State | vs National | |
| 1. | 49942 | 52.6% | 0.90%(+51.7)#1 | 4.2%(+48.4)#1,661 |
| 2. | 49833 | 48.1% | 0.90%(+47.2)#2 | 4.2%(+43.9)#1,968 |
| 3. | 48410 | 36.5% | 0.90%(+35.6)#3 | 4.2%(+32.3)#2,836 |
| 4. | 49834 | 26.5% | 0.90%(+25.6)#4 | 4.2%(+22.3)#3,631 |
| 5. | 49864 | 26.1% | 0.90%(+25.2)#5 | 4.2%(+21.9)#3,671 |
| 6. | 49917 | 22.0% | 0.90%(+21.1)#6 | 4.2%(+17.8)#4,074 |
| 7. | 49929 | 21.4% | 0.90%(+20.5)#7 | 4.2%(+17.2)#4,137 |
| 8. | 49102 | 20.0% | 0.90%(+19.1)#8 | 4.2%(+15.8)#4,282 |
| 9. | 48861 | 19.3% | 0.90%(+18.4)#9 | 4.2%(+15.1)#4,365 |
| 10. | 49955 | 19.1% | 0.90%(+18.2)#10 | 4.2%(+14.9)#4,390 |
| 11. | 49879 | 19.0% | 0.90%(+18.1)#11 | 4.2%(+14.8)#4,397 |
| 12. | 49970 | 18.4% | 0.90%(+17.5)#12 | 4.2%(+14.2)#4,475 |
| 13. | 49403 | 17.8% | 0.90%(+16.9)#13 | 4.2%(+13.6)#4,551 |
| 14. | 49774 | 17.6% | 0.90%(+16.7)#14 | 4.2%(+13.4)#4,572 |
| 15. | 49814 | 17.6% | 0.90%(+16.7)#15 | 4.2%(+13.4)#4,574 |
| 16. | 49654 | 17.6% | 0.90%(+16.7)#16 | 4.2%(+13.4)#4,575 |
| 17. | 49919 | 16.9% | 0.90%(+16.0)#17 | 4.2%(+12.7)#4,697 |
| 18. | 49725 | 16.8% | 0.90%(+15.9)#18 | 4.2%(+12.6)#4,709 |
| 19. | 49611 | 15.3% | 0.90%(+14.4)#19 | 4.2%(+11.1)#4,948 |
| 20. | 49948 | 14.9% | 0.90%(+14.0)#20 | 4.2%(+10.7)#5,017 |
| 21. | 49872 | 14.6% | 0.90%(+13.7)#21 | 4.2%(+10.4)#5,080 |
| 22. | 48432 | 14.2% | 0.90%(+13.3)#22 | 4.2%(+10.00)#5,147 |
| 23. | 49285 | 13.3% | 0.90%(+12.4)#23 | 4.2%(+9.10)#5,281 |
| 24. | 49126 | 13.1% | 0.90%(+12.2)#24 | 4.2%(+8.90)#5,333 |
| 25. | 49435 | 13.0% | 0.90%(+12.1)#25 | 4.2%(+8.80)#5,346 |
| 26. | 48841 | 13.0% | 0.90%(+12.1)#26 | 4.2%(+8.80)#5,351 |
| 27. | 48465 | 12.9% | 0.90%(+12.0)#27 | 4.2%(+8.70)#5,381 |
| 28. | 49279 | 12.7% | 0.90%(+11.8)#28 | 4.2%(+8.50)#5,420 |
| 29. | 48470 | 12.6% | 0.90%(+11.7)#29 | 4.2%(+8.40)#5,446 |
| 30. | 49861 | 12.5% | 0.90%(+11.6)#30 | 4.2%(+8.30)#5,473 |
| 31. | 49724 | 11.9% | 0.90%(+11.0)#31 | 4.2%(+7.70)#5,600 |
| 32. | 49046 | 11.8% | 0.90%(+10.9)#32 | 4.2%(+7.60)#5,617 |
| 33. | 49340 | 11.6% | 0.90%(+10.7)#33 | 4.2%(+7.40)#5,670 |
| 34. | 49089 | 11.6% | 0.90%(+10.7)#34 | 4.2%(+7.40)#5,671 |
| 35. | 49318 | 11.6% | 0.90%(+10.7)#35 | 4.2%(+7.40)#5,678 |
| 36. | 48851 | 11.5% | 0.90%(+10.6)#36 | 4.2%(+7.30)#5,705 |
| 37. | 48721 | 11.0% | 0.90%(+10.1)#37 | 4.2%(+6.80)#5,834 |
| 38. | 48434 | 10.9% | 0.90%(+10.00)#38 | 4.2%(+6.70)#5,860 |
| 39. | 48426 | 10.8% | 0.90%(+9.90)#39 | 4.2%(+6.60)#5,872 |
| 40. | 49719 | 10.5% | 0.90%(+9.60)#40 | 4.2%(+6.30)#5,946 |
| 41. | 49816 | 10.5% | 0.90%(+9.60)#41 | 4.2%(+6.30)#5,950 |
| 42. | 48735 | 10.4% | 0.90%(+9.50)#42 | 4.2%(+6.20)#5,975 |
| 43. | 48421 | 10.3% | 0.90%(+9.40)#43 | 4.2%(+6.10)#5,990 |
| 44. | 49070 | 10.3% | 0.90%(+9.40)#44 | 4.2%(+6.10)#5,994 |
| 45. | 49116 | 10.2% | 0.90%(+9.30)#45 | 4.2%(+6.00)#6,034 |
| 46. | 48835 | 9.9% | 0.90%(+9.00)#46 | 4.2%(+5.70)#6,092 |
| 47. | 49736 | 9.9% | 0.90%(+9.00)#47 | 4.2%(+5.70)#6,103 |
| 48. | 49076 | 9.8% | 0.90%(+8.90)#48 | 4.2%(+5.60)#6,121 |
| 49. | 48002 | 9.8% | 0.90%(+8.90)#49 | 4.2%(+5.60)#6,123 |
| 50. | 48472 | 9.7% | 0.90%(+8.80)#50 | 4.2%(+5.50)#6,157 |
| 51. | 49959 | 9.6% | 0.90%(+8.70)#51 | 4.2%(+5.40)#6,193 |
| 52. | 49901 | 9.6% | 0.90%(+8.70)#52 | 4.2%(+5.40)#6,195 |
| 53. | 48894 | 9.4% | 0.90%(+8.50)#53 | 4.2%(+5.20)#6,242 |
| 54. | 48456 | 9.4% | 0.90%(+8.50)#54 | 4.2%(+5.20)#6,250 |
| 55. | 49782 | 9.4% | 0.90%(+8.50)#55 | 4.2%(+5.20)#6,251 |
| 56. | 49288 | 9.3% | 0.90%(+8.40)#56 | 4.2%(+5.10)#6,273 |
| 57. | 48453 | 9.2% | 0.90%(+8.30)#57 | 4.2%(+5.00)#6,292 |
| 58. | 49130 | 9.0% | 0.90%(+8.10)#58 | 4.2%(+4.80)#6,362 |
| 59. | 49805 | 8.9% | 0.90%(+8.00)#59 | 4.2%(+4.70)#6,395 |
| 60. | 48626 | 8.8% | 0.90%(+7.90)#60 | 4.2%(+4.60)#6,412 |
| 61. | 49880 | 8.8% | 0.90%(+7.90)#61 | 4.2%(+4.60)#6,432 |
| 62. | 49251 | 8.7% | 0.90%(+7.80)#62 | 4.2%(+4.50)#6,456 |
| 63. | 48831 | 8.7% | 0.90%(+7.80)#63 | 4.2%(+4.50)#6,463 |
| 64. | 49096 | 8.7% | 0.90%(+7.80)#64 | 4.2%(+4.50)#6,464 |
| 65. | 49111 | 8.6% | 0.90%(+7.70)#65 | 4.2%(+4.40)#6,487 |
| 66. | 49958 | 8.6% | 0.90%(+7.70)#66 | 4.2%(+4.40)#6,502 |
| 67. | 49330 | 8.5% | 0.90%(+7.60)#67 | 4.2%(+4.30)#6,516 |
| 68. | 48747 | 8.5% | 0.90%(+7.60)#68 | 4.2%(+4.30)#6,524 |
| 69. | 48892 | 8.3% | 0.90%(+7.40)#69 | 4.2%(+4.10)#6,582 |
| 70. | 49623 | 8.3% | 0.90%(+7.40)#70 | 4.2%(+4.10)#6,596 |
| 71. | 49885 | 8.2% | 0.90%(+7.30)#71 | 4.2%(+4.00)#6,642 |
| 72. | 49793 | 8.2% | 0.90%(+7.30)#72 | 4.2%(+4.00)#6,656 |
| 73. | 49436 | 8.1% | 0.90%(+7.20)#73 | 4.2%(+3.90)#6,679 |
| 74. | 49618 | 8.1% | 0.90%(+7.20)#74 | 4.2%(+3.90)#6,685 |
| 75. | 49921 | 8.1% | 0.90%(+7.20)#75 | 4.2%(+3.90)#6,692 |
| 76. | 49284 | 8.0% | 0.90%(+7.10)#76 | 4.2%(+3.80)#6,707 |
| 77. | 49128 | 7.9% | 0.90%(+7.00)#77 | 4.2%(+3.70)#6,748 |
| 78. | 49639 | 7.8% | 0.90%(+6.90)#78 | 4.2%(+3.60)#6,792 |
| 79. | 49248 | 7.8% | 0.90%(+6.90)#79 | 4.2%(+3.60)#6,806 |
| 80. | 49674 | 7.7% | 0.90%(+6.80)#80 | 4.2%(+3.50)#6,852 |
| 81. | 49404 | 7.6% | 0.90%(+6.70)#81 | 4.2%(+3.40)#6,869 |
| 82. | 49277 | 7.6% | 0.90%(+6.70)#82 | 4.2%(+3.40)#6,879 |
| 83. | 48475 | 7.6% | 0.90%(+6.70)#83 | 4.2%(+3.40)#6,881 |
| 84. | 49287 | 7.6% | 0.90%(+6.70)#84 | 4.2%(+3.40)#6,885 |
| 85. | 49835 | 7.6% | 0.90%(+6.70)#85 | 4.2%(+3.40)#6,896 |
| 86. | 49327 | 7.5% | 0.90%(+6.60)#86 | 4.2%(+3.30)#6,914 |
| 87. | 48158 | 7.5% | 0.90%(+6.60)#87 | 4.2%(+3.30)#6,915 |
| 88. | 49013 | 7.5% | 0.90%(+6.60)#88 | 4.2%(+3.30)#6,919 |
| 89. | 48744 | 7.3% | 0.90%(+6.40)#89 | 4.2%(+3.10)#6,997 |
| 90. | 48845 | 7.3% | 0.90%(+6.40)#90 | 4.2%(+3.10)#7,009 |
| 91. | 48429 | 6.9% | 0.90%(+6.00)#91 | 4.2%(+2.70)#7,153 |
| 92. | 48731 | 6.9% | 0.90%(+6.00)#92 | 4.2%(+2.70)#7,162 |
| 93. | 49815 | 6.9% | 0.90%(+6.00)#93 | 4.2%(+2.70)#7,180 |
| 94. | 49420 | 6.8% | 0.90%(+5.90)#94 | 4.2%(+2.60)#7,196 |
| 95. | 49282 | 6.8% | 0.90%(+5.90)#95 | 4.2%(+2.60)#7,224 |
| 96. | 49073 | 6.7% | 0.90%(+5.80)#96 | 4.2%(+2.50)#7,243 |
| 97. | 48866 | 6.7% | 0.90%(+5.80)#97 | 4.2%(+2.50)#7,247 |
| 98. | 49262 | 6.7% | 0.90%(+5.80)#98 | 4.2%(+2.50)#7,260 |
| 99. | 49710 | 6.7% | 0.90%(+5.80)#99 | 4.2%(+2.50)#7,271 |
| 100. | 49101 | 6.6% | 0.90%(+5.70)#100 | 4.2%(+2.40)#7,299 |
Common Questions
What are the Top 10 Zip Codes with the Highest Percentage of Households Heated by Fuel Oil / Kerosene in Michigan?
Top 10 Zip Codes with the Highest Percentage of Households Heated by Fuel Oil / Kerosene in Michigan are:
What zip code has the Highest Percentage of Households Heated by Fuel Oil / Kerosene in Michigan?
49942 has the Highest Percentage of Households Heated by Fuel Oil / Kerosene in Michigan with 52.6%.
What is the Percentage of Households Heated by Fuel Oil / Kerosene in the State of Michigan?
Percentage of Households Heated by Fuel Oil / Kerosene in Michigan is 0.90%.
What is the Percentage of Households Heated by Fuel Oil / Kerosene in the United States?
Percentage of Households Heated by Fuel Oil / Kerosene in the United States is 4.2%.