Zip Codes with the Highest Percentage of Population Employed in Food Preparation & Serving in Grand Rapids, MI
RELATED REPORTS & OPTIONS
Food Preparation & Serving
Grand Rapids
Compare Zip Codes
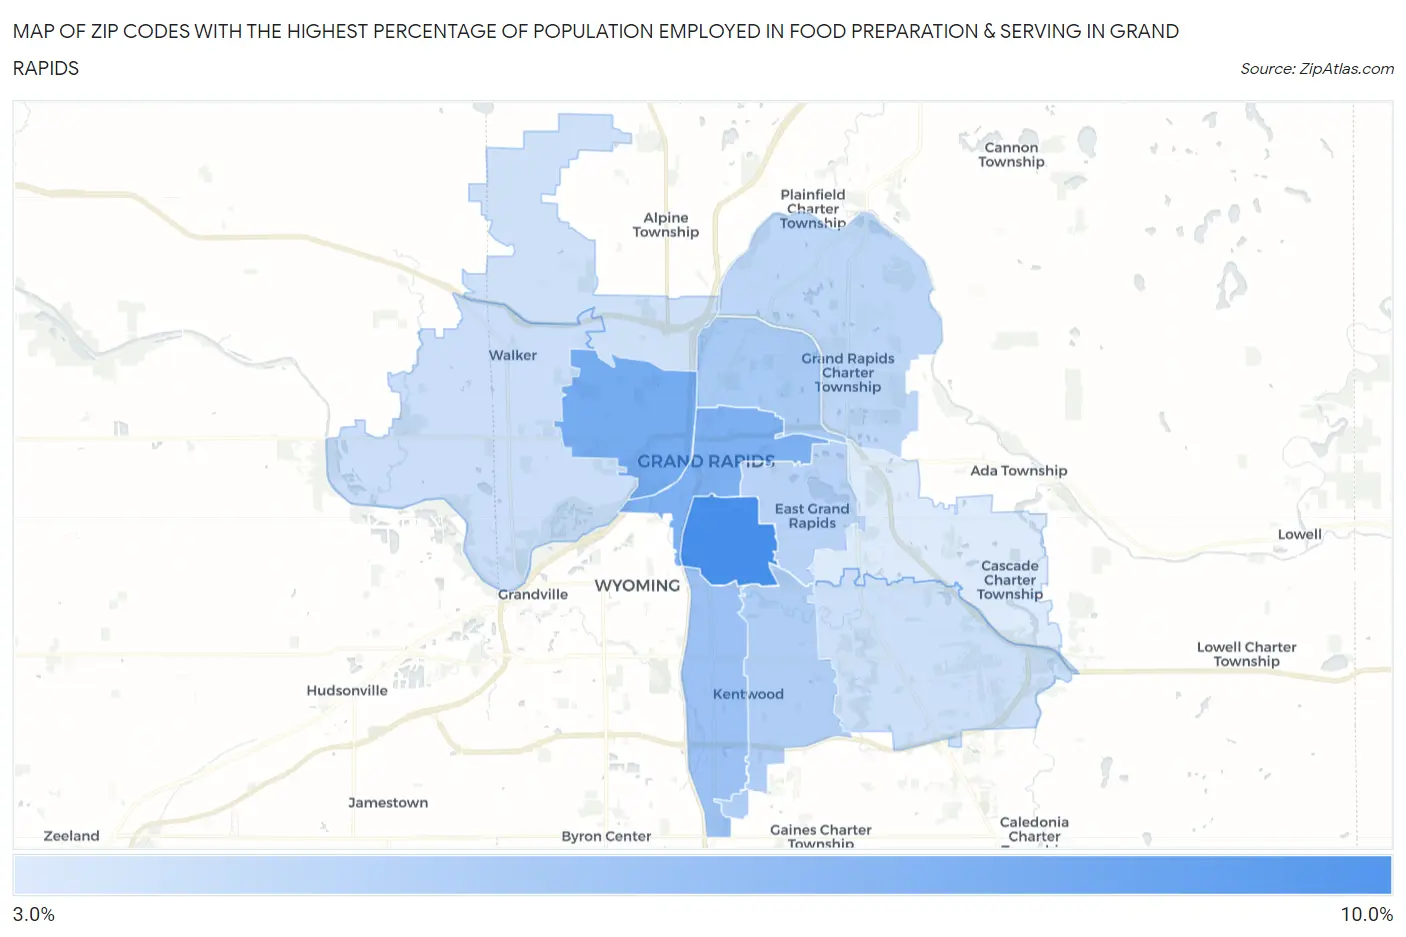
Map of Zip Codes with the Highest Percentage of Population Employed in Food Preparation & Serving in Grand Rapids
3.9%
9.4%
Zip Codes with the Highest Percentage of Population Employed in Food Preparation & Serving in Grand Rapids, MI
| Zip Code | % Employed | vs State | vs National | |
| 1. | 49507 | 9.4% | 5.7%(+3.70)#90 | 5.3%(+4.08)#3,166 |
| 2. | 49504 | 7.6% | 5.7%(+1.96)#175 | 5.3%(+2.35)#5,318 |
| 3. | 49503 | 7.4% | 5.7%(+1.72)#192 | 5.3%(+2.11)#5,759 |
| 4. | 49548 | 6.2% | 5.7%(+0.516)#319 | 5.3%(+0.903)#8,770 |
| 5. | 49505 | 5.8% | 5.7%(+0.135)#373 | 5.3%(+0.522)#10,010 |
| 6. | 49508 | 5.5% | 5.7%(-0.179)#419 | 5.3%(+0.208)#11,085 |
| 7. | 49506 | 5.2% | 5.7%(-0.510)#464 | 5.3%(-0.124)#12,307 |
| 8. | 49525 | 5.0% | 5.7%(-0.652)#489 | 5.3%(-0.265)#12,863 |
| 9. | 49534 | 4.5% | 5.7%(-1.17)#555 | 5.3%(-0.782)#15,015 |
| 10. | 49512 | 4.5% | 5.7%(-1.20)#563 | 5.3%(-0.812)#15,130 |
| 11. | 49544 | 4.3% | 5.7%(-1.33)#586 | 5.3%(-0.941)#15,676 |
| 12. | 49546 | 3.9% | 5.7%(-1.80)#677 | 5.3%(-1.42)#17,663 |
1
Common Questions
What are the Top 10 Zip Codes with the Highest Percentage of Population Employed in Food Preparation & Serving in Grand Rapids, MI?
Top 10 Zip Codes with the Highest Percentage of Population Employed in Food Preparation & Serving in Grand Rapids, MI are:
What zip code has the Highest Percentage of Population Employed in Food Preparation & Serving in Grand Rapids, MI?
49507 has the Highest Percentage of Population Employed in Food Preparation & Serving in Grand Rapids, MI with 9.4%.
What is the Percentage of Population Employed in Food Preparation & Serving in Grand Rapids, MI?
Percentage of Population Employed in Food Preparation & Serving in Grand Rapids is 7.3%.
What is the Percentage of Population Employed in Food Preparation & Serving in Michigan?
Percentage of Population Employed in Food Preparation & Serving in Michigan is 5.7%.
What is the Percentage of Population Employed in Food Preparation & Serving in the United States?
Percentage of Population Employed in Food Preparation & Serving in the United States is 5.3%.