Zip Codes with the Highest Percentage of Population Employed in Food Preparation & Serving in Dearborn Heights, MI
RELATED REPORTS & OPTIONS
Food Preparation & Serving
Dearborn Heights
Compare Zip Codes
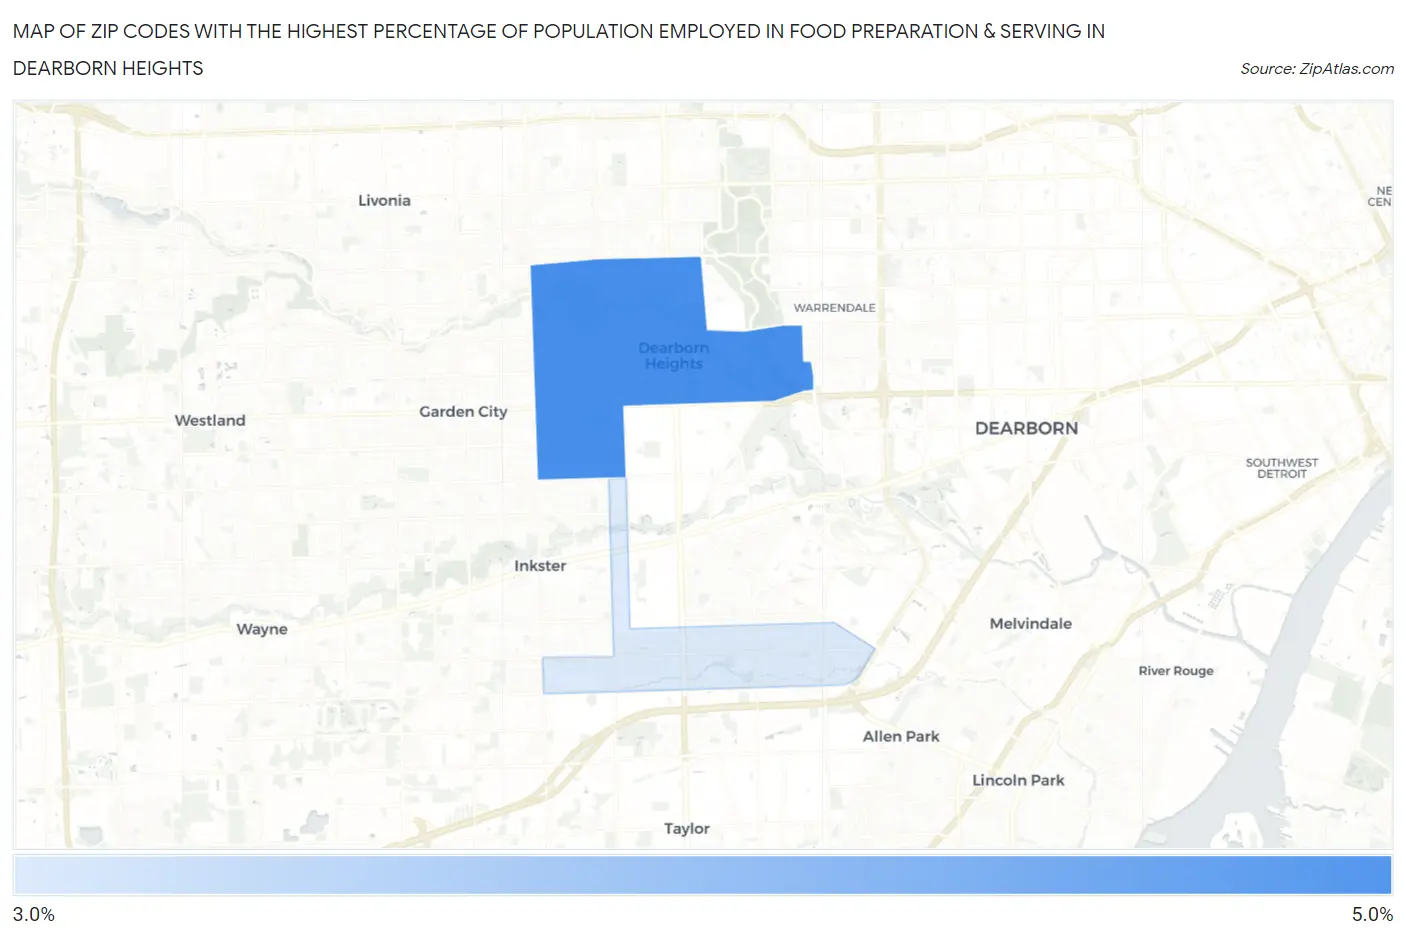
Map of Zip Codes with the Highest Percentage of Population Employed in Food Preparation & Serving in Dearborn Heights
3.9%
4.8%
Zip Codes with the Highest Percentage of Population Employed in Food Preparation & Serving in Dearborn Heights, MI
| Zip Code | % Employed | vs State | vs National | |
| 1. | 48127 | 4.8% | 5.7%(-0.879)#525 | 5.3%(-0.493)#13,793 |
| 2. | 48125 | 3.9% | 5.7%(-1.74)#669 | 5.3%(-1.36)#17,412 |
1
Common Questions
What are the Top Zip Codes with the Highest Percentage of Population Employed in Food Preparation & Serving in Dearborn Heights, MI?
Top Zip Codes with the Highest Percentage of Population Employed in Food Preparation & Serving in Dearborn Heights, MI are:
What zip code has the Highest Percentage of Population Employed in Food Preparation & Serving in Dearborn Heights, MI?
48127 has the Highest Percentage of Population Employed in Food Preparation & Serving in Dearborn Heights, MI with 4.8%.
What is the Percentage of Population Employed in Food Preparation & Serving in Dearborn Heights, MI?
Percentage of Population Employed in Food Preparation & Serving in Dearborn Heights is 4.5%.
What is the Percentage of Population Employed in Food Preparation & Serving in Michigan?
Percentage of Population Employed in Food Preparation & Serving in Michigan is 5.7%.
What is the Percentage of Population Employed in Food Preparation & Serving in the United States?
Percentage of Population Employed in Food Preparation & Serving in the United States is 5.3%.