Zip Codes with the Highest Percentage of Population Employed in Food Preparation & Serving in Sterling Heights, MI
RELATED REPORTS & OPTIONS
Food Preparation & Serving
Sterling Heights
Compare Zip Codes
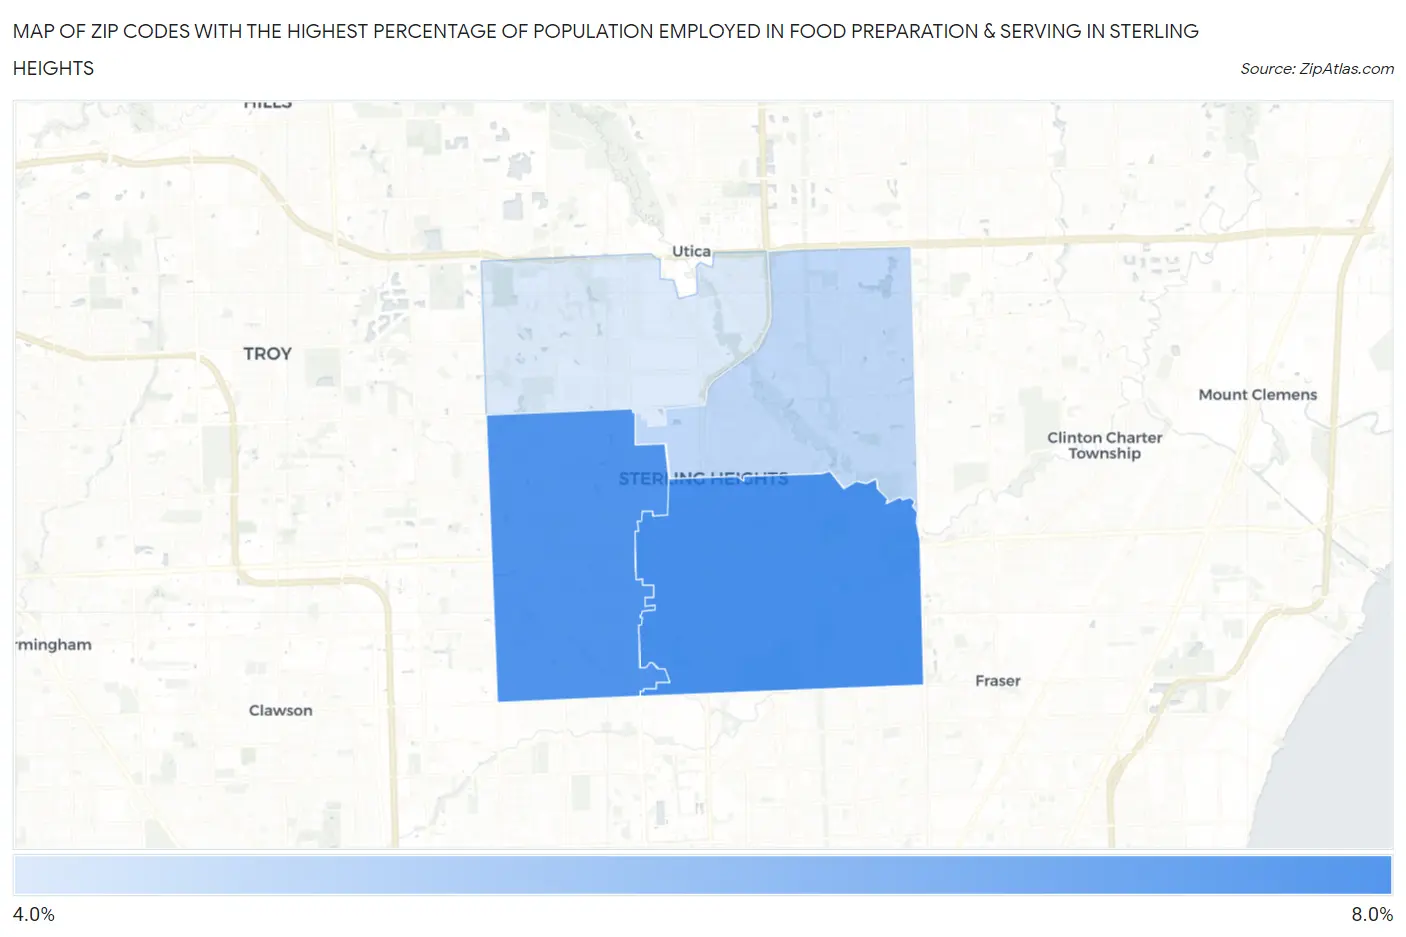
Map of Zip Codes with the Highest Percentage of Population Employed in Food Preparation & Serving in Sterling Heights
4.3%
6.1%
Zip Codes with the Highest Percentage of Population Employed in Food Preparation & Serving in Sterling Heights, MI
| Zip Code | % Employed | vs State | vs National | |
| 1. | 48312 | 6.1% | 5.7%(+0.460)#331 | 5.3%(+0.847)#8,924 |
| 2. | 48310 | 6.0% | 5.7%(+0.349)#344 | 5.3%(+0.736)#9,273 |
| 3. | 48313 | 4.7% | 5.7%(-0.979)#536 | 5.3%(-0.592)#14,182 |
| 4. | 48314 | 4.3% | 5.7%(-1.33)#587 | 5.3%(-0.941)#15,680 |
1
Common Questions
What are the Top 3 Zip Codes with the Highest Percentage of Population Employed in Food Preparation & Serving in Sterling Heights, MI?
Top 3 Zip Codes with the Highest Percentage of Population Employed in Food Preparation & Serving in Sterling Heights, MI are:
What zip code has the Highest Percentage of Population Employed in Food Preparation & Serving in Sterling Heights, MI?
48312 has the Highest Percentage of Population Employed in Food Preparation & Serving in Sterling Heights, MI with 6.1%.
What is the Percentage of Population Employed in Food Preparation & Serving in Sterling Heights, MI?
Percentage of Population Employed in Food Preparation & Serving in Sterling Heights is 5.4%.
What is the Percentage of Population Employed in Food Preparation & Serving in Michigan?
Percentage of Population Employed in Food Preparation & Serving in Michigan is 5.7%.
What is the Percentage of Population Employed in Food Preparation & Serving in the United States?
Percentage of Population Employed in Food Preparation & Serving in the United States is 5.3%.