Zip Codes with the Highest Percentage of Population Employed in Administrative & Support Services in Michigan
RELATED REPORTS & OPTIONS
Administrative & Support Services
Michigan
Compare Zip Codes
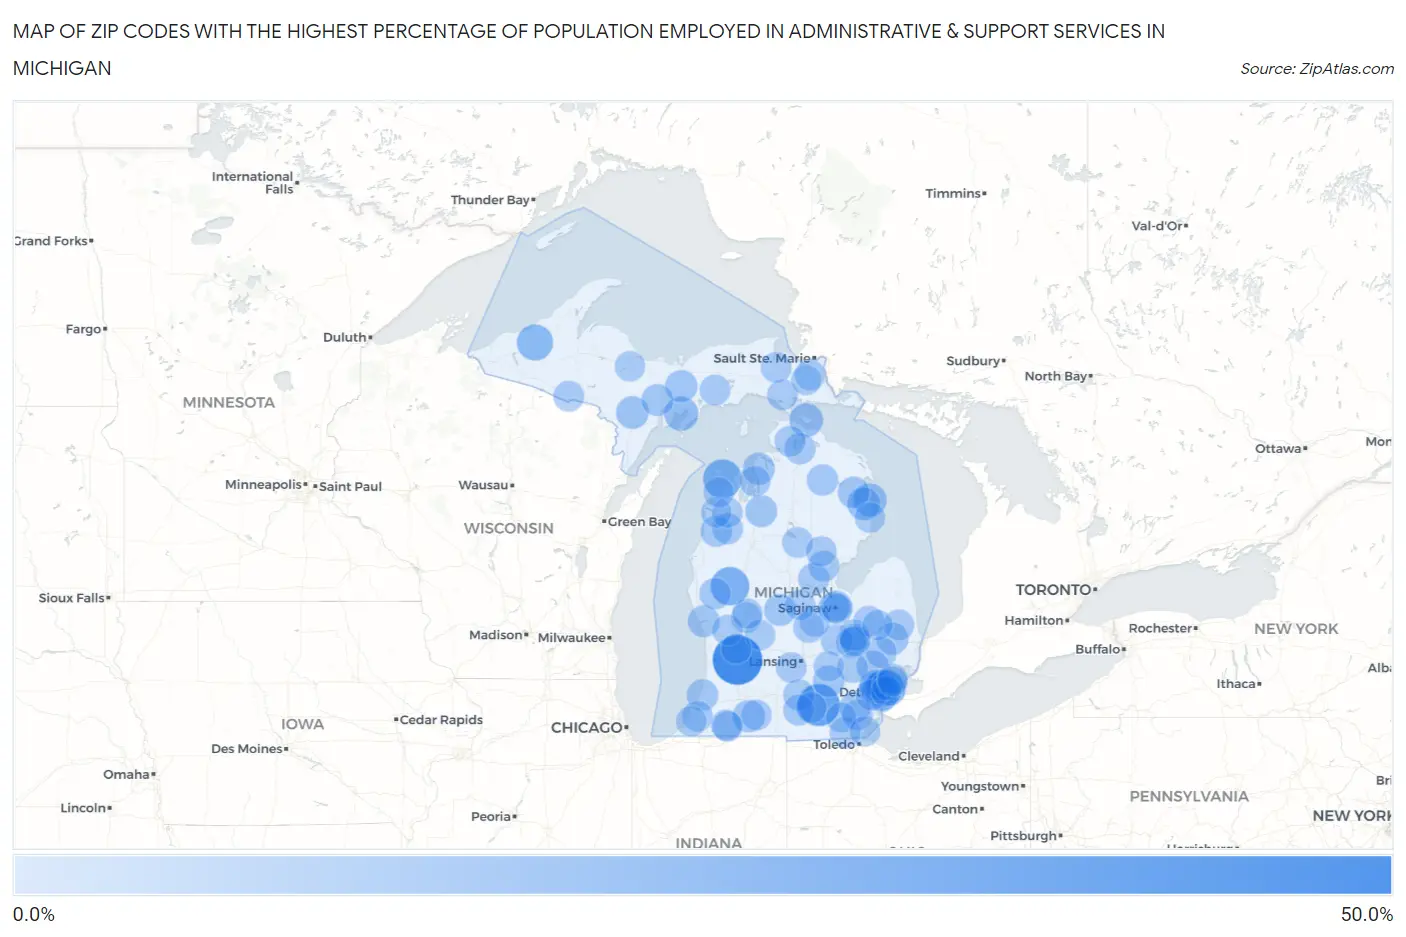
Map of Zip Codes with the Highest Percentage of Population Employed in Administrative & Support Services in Michigan
0.0%
50.0%
Zip Codes with the Highest Percentage of Population Employed in Administrative & Support Services in Michigan
| Zip Code | % Employed | vs State | vs National | |
| 1. | 49335 | 41.3% | 3.7%(+37.5)#1 | 4.1%(+37.1)#79 |
| 2. | 49261 | 27.7% | 3.7%(+24.0)#2 | 4.1%(+23.6)#158 |
| 3. | 49654 | 21.5% | 3.7%(+17.8)#3 | 4.1%(+17.4)#254 |
| 4. | 49312 | 21.2% | 3.7%(+17.4)#4 | 4.1%(+17.0)#260 |
| 5. | 49960 | 16.7% | 3.7%(+12.9)#5 | 4.1%(+12.5)#418 |
| 6. | 49864 | 13.3% | 3.7%(+9.61)#6 | 4.1%(+9.18)#688 |
| 7. | 49775 | 12.5% | 3.7%(+8.77)#7 | 4.1%(+8.35)#778 |
| 8. | 48204 | 11.7% | 3.7%(+7.98)#8 | 4.1%(+7.56)#889 |
| 9. | 48721 | 11.6% | 3.7%(+7.89)#9 | 4.1%(+7.46)#911 |
| 10. | 48742 | 11.0% | 3.7%(+7.25)#10 | 4.1%(+6.83)#1,024 |
| 11. | 48209 | 10.7% | 3.7%(+6.93)#11 | 4.1%(+6.51)#1,107 |
| 12. | 49873 | 10.6% | 3.7%(+6.91)#12 | 4.1%(+6.49)#1,112 |
| 13. | 49895 | 9.9% | 3.7%(+6.17)#13 | 4.1%(+5.75)#1,323 |
| 14. | 49072 | 9.9% | 3.7%(+6.16)#14 | 4.1%(+5.74)#1,330 |
| 15. | 48228 | 9.8% | 3.7%(+6.08)#15 | 4.1%(+5.65)#1,361 |
| 16. | 49729 | 9.5% | 3.7%(+5.77)#16 | 4.1%(+5.35)#1,467 |
| 17. | 48014 | 9.3% | 3.7%(+5.61)#17 | 4.1%(+5.19)#1,533 |
| 18. | 49440 | 9.2% | 3.7%(+5.45)#18 | 4.1%(+5.03)#1,595 |
| 19. | 49872 | 9.1% | 3.7%(+5.36)#19 | 4.1%(+4.94)#1,645 |
| 20. | 48891 | 9.0% | 3.7%(+5.32)#20 | 4.1%(+4.90)#1,665 |
| 21. | 49680 | 9.0% | 3.7%(+5.32)#21 | 4.1%(+4.89)#1,666 |
| 22. | 48340 | 9.0% | 3.7%(+5.25)#22 | 4.1%(+4.82)#1,700 |
| 23. | 48210 | 9.0% | 3.7%(+5.23)#23 | 4.1%(+4.80)#1,717 |
| 24. | 48137 | 8.9% | 3.7%(+5.21)#24 | 4.1%(+4.79)#1,722 |
| 25. | 49747 | 8.9% | 3.7%(+5.19)#25 | 4.1%(+4.77)#1,736 |
| 26. | 48217 | 8.6% | 3.7%(+4.87)#26 | 4.1%(+4.45)#1,915 |
| 27. | 48235 | 8.6% | 3.7%(+4.85)#27 | 4.1%(+4.43)#1,925 |
| 28. | 49043 | 8.5% | 3.7%(+4.80)#28 | 4.1%(+4.37)#1,955 |
| 29. | 49709 | 8.3% | 3.7%(+4.54)#29 | 4.1%(+4.12)#2,106 |
| 30. | 48223 | 8.2% | 3.7%(+4.51)#30 | 4.1%(+4.08)#2,121 |
| 31. | 48213 | 8.2% | 3.7%(+4.46)#31 | 4.1%(+4.03)#2,151 |
| 32. | 49421 | 8.1% | 3.7%(+4.38)#32 | 4.1%(+3.96)#2,202 |
| 33. | 48238 | 8.1% | 3.7%(+4.36)#33 | 4.1%(+3.94)#2,210 |
| 34. | 48628 | 8.1% | 3.7%(+4.33)#34 | 4.1%(+3.91)#2,228 |
| 35. | 49645 | 7.9% | 3.7%(+4.18)#35 | 4.1%(+3.76)#2,348 |
| 36. | 48203 | 7.9% | 3.7%(+4.18)#36 | 4.1%(+3.76)#2,350 |
| 37. | 49269 | 7.8% | 3.7%(+4.09)#37 | 4.1%(+3.67)#2,402 |
| 38. | 48449 | 7.7% | 3.7%(+4.00)#38 | 4.1%(+3.58)#2,487 |
| 39. | 49749 | 7.7% | 3.7%(+3.94)#39 | 4.1%(+3.51)#2,539 |
| 40. | 48613 | 7.7% | 3.7%(+3.93)#40 | 4.1%(+3.51)#2,544 |
| 41. | 48190 | 7.6% | 3.7%(+3.91)#41 | 4.1%(+3.48)#2,566 |
| 42. | 48214 | 7.6% | 3.7%(+3.89)#42 | 4.1%(+3.47)#2,579 |
| 43. | 49241 | 7.6% | 3.7%(+3.83)#43 | 4.1%(+3.41)#2,634 |
| 44. | 49625 | 7.6% | 3.7%(+3.82)#44 | 4.1%(+3.40)#2,641 |
| 45. | 48206 | 7.5% | 3.7%(+3.80)#45 | 4.1%(+3.37)#2,665 |
| 46. | 48602 | 7.5% | 3.7%(+3.78)#46 | 4.1%(+3.35)#2,683 |
| 47. | 48219 | 7.5% | 3.7%(+3.77)#47 | 4.1%(+3.35)#2,693 |
| 48. | 48607 | 7.4% | 3.7%(+3.65)#48 | 4.1%(+3.23)#2,808 |
| 49. | 48506 | 7.4% | 3.7%(+3.65)#49 | 4.1%(+3.23)#2,809 |
| 50. | 48227 | 7.4% | 3.7%(+3.65)#50 | 4.1%(+3.23)#2,810 |
| 51. | 48614 | 7.4% | 3.7%(+3.65)#51 | 4.1%(+3.22)#2,816 |
| 52. | 49234 | 7.4% | 3.7%(+3.63)#52 | 4.1%(+3.21)#2,833 |
| 53. | 48529 | 7.4% | 3.7%(+3.63)#53 | 4.1%(+3.21)#2,834 |
| 54. | 48454 | 7.3% | 3.7%(+3.57)#54 | 4.1%(+3.15)#2,892 |
| 55. | 49276 | 7.3% | 3.7%(+3.54)#55 | 4.1%(+3.12)#2,914 |
| 56. | 49915 | 7.3% | 3.7%(+3.54)#56 | 4.1%(+3.12)#2,916 |
| 57. | 49760 | 7.3% | 3.7%(+3.54)#57 | 4.1%(+3.11)#2,923 |
| 58. | 48435 | 7.3% | 3.7%(+3.53)#58 | 4.1%(+3.11)#2,926 |
| 59. | 48367 | 7.3% | 3.7%(+3.53)#59 | 4.1%(+3.11)#2,928 |
| 60. | 49095 | 7.2% | 3.7%(+3.51)#60 | 4.1%(+3.08)#2,949 |
| 61. | 49728 | 7.2% | 3.7%(+3.49)#61 | 4.1%(+3.07)#2,968 |
| 62. | 49840 | 7.2% | 3.7%(+3.45)#62 | 4.1%(+3.03)#3,003 |
| 63. | 49716 | 7.2% | 3.7%(+3.45)#63 | 4.1%(+3.02)#3,004 |
| 64. | 49066 | 7.1% | 3.7%(+3.39)#64 | 4.1%(+2.97)#3,062 |
| 65. | 48807 | 7.1% | 3.7%(+3.38)#65 | 4.1%(+2.95)#3,096 |
| 66. | 49126 | 7.1% | 3.7%(+3.37)#66 | 4.1%(+2.95)#3,099 |
| 67. | 48159 | 7.1% | 3.7%(+3.35)#67 | 4.1%(+2.93)#3,126 |
| 68. | 48651 | 7.1% | 3.7%(+3.34)#68 | 4.1%(+2.91)#3,151 |
| 69. | 48509 | 7.0% | 3.7%(+3.29)#69 | 4.1%(+2.87)#3,191 |
| 70. | 48357 | 7.0% | 3.7%(+3.27)#70 | 4.1%(+2.85)#3,213 |
| 71. | 48221 | 7.0% | 3.7%(+3.26)#71 | 4.1%(+2.84)#3,235 |
| 72. | 49648 | 6.9% | 3.7%(+3.17)#72 | 4.1%(+2.75)#3,344 |
| 73. | 48141 | 6.9% | 3.7%(+3.17)#73 | 4.1%(+2.74)#3,359 |
| 74. | 49343 | 6.9% | 3.7%(+3.14)#74 | 4.1%(+2.72)#3,393 |
| 75. | 48610 | 6.8% | 3.7%(+3.09)#75 | 4.1%(+2.67)#3,452 |
| 76. | 48876 | 6.8% | 3.7%(+3.08)#76 | 4.1%(+2.66)#3,468 |
| 77. | 49061 | 6.7% | 3.7%(+2.99)#77 | 4.1%(+2.57)#3,590 |
| 78. | 48234 | 6.7% | 3.7%(+2.98)#78 | 4.1%(+2.56)#3,610 |
| 79. | 49643 | 6.7% | 3.7%(+2.95)#79 | 4.1%(+2.52)#3,663 |
| 80. | 48519 | 6.7% | 3.7%(+2.92)#80 | 4.1%(+2.50)#3,698 |
| 81. | 49101 | 6.6% | 3.7%(+2.89)#81 | 4.1%(+2.46)#3,746 |
| 82. | 49724 | 6.6% | 3.7%(+2.88)#82 | 4.1%(+2.46)#3,754 |
| 83. | 48880 | 6.6% | 3.7%(+2.87)#83 | 4.1%(+2.44)#3,772 |
| 84. | 49403 | 6.6% | 3.7%(+2.86)#84 | 4.1%(+2.44)#3,779 |
| 85. | 49229 | 6.5% | 3.7%(+2.82)#85 | 4.1%(+2.40)#3,841 |
| 86. | 48809 | 6.5% | 3.7%(+2.79)#86 | 4.1%(+2.37)#3,879 |
| 87. | 48066 | 6.5% | 3.7%(+2.76)#87 | 4.1%(+2.34)#3,927 |
| 88. | 48738 | 6.5% | 3.7%(+2.76)#88 | 4.1%(+2.33)#3,929 |
| 89. | 48601 | 6.5% | 3.7%(+2.73)#89 | 4.1%(+2.31)#3,979 |
| 90. | 49617 | 6.4% | 3.7%(+2.71)#90 | 4.1%(+2.29)#4,008 |
| 91. | 49636 | 6.4% | 3.7%(+2.71)#91 | 4.1%(+2.29)#4,013 |
| 92. | 48836 | 6.4% | 3.7%(+2.70)#92 | 4.1%(+2.28)#4,017 |
| 93. | 48157 | 6.4% | 3.7%(+2.70)#93 | 4.1%(+2.28)#4,022 |
| 94. | 48461 | 6.4% | 3.7%(+2.69)#94 | 4.1%(+2.27)#4,051 |
| 95. | 48201 | 6.4% | 3.7%(+2.65)#95 | 4.1%(+2.23)#4,111 |
| 96. | 49509 | 6.4% | 3.7%(+2.65)#96 | 4.1%(+2.22)#4,119 |
| 97. | 49339 | 6.3% | 3.7%(+2.62)#97 | 4.1%(+2.20)#4,161 |
| 98. | 49788 | 6.3% | 3.7%(+2.61)#98 | 4.1%(+2.19)#4,173 |
| 99. | 49871 | 6.3% | 3.7%(+2.60)#99 | 4.1%(+2.18)#4,195 |
| 100. | 48021 | 6.3% | 3.7%(+2.60)#100 | 4.1%(+2.18)#4,199 |
Common Questions
What are the Top 10 Zip Codes with the Highest Percentage of Population Employed in Administrative & Support Services in Michigan?
Top 10 Zip Codes with the Highest Percentage of Population Employed in Administrative & Support Services in Michigan are:
What zip code has the Highest Percentage of Population Employed in Administrative & Support Services in Michigan?
49335 has the Highest Percentage of Population Employed in Administrative & Support Services in Michigan with 41.3%.
What is the Percentage of Population Employed in Administrative & Support Services in the State of Michigan?
Percentage of Population Employed in Administrative & Support Services in Michigan is 3.7%.
What is the Percentage of Population Employed in Administrative & Support Services in the United States?
Percentage of Population Employed in Administrative & Support Services in the United States is 4.1%.