Zip Codes with the Highest Percentage of Population Employed in Food Preparation & Serving in Novi, MI
RELATED REPORTS & OPTIONS
Food Preparation & Serving
Novi
Compare Zip Codes
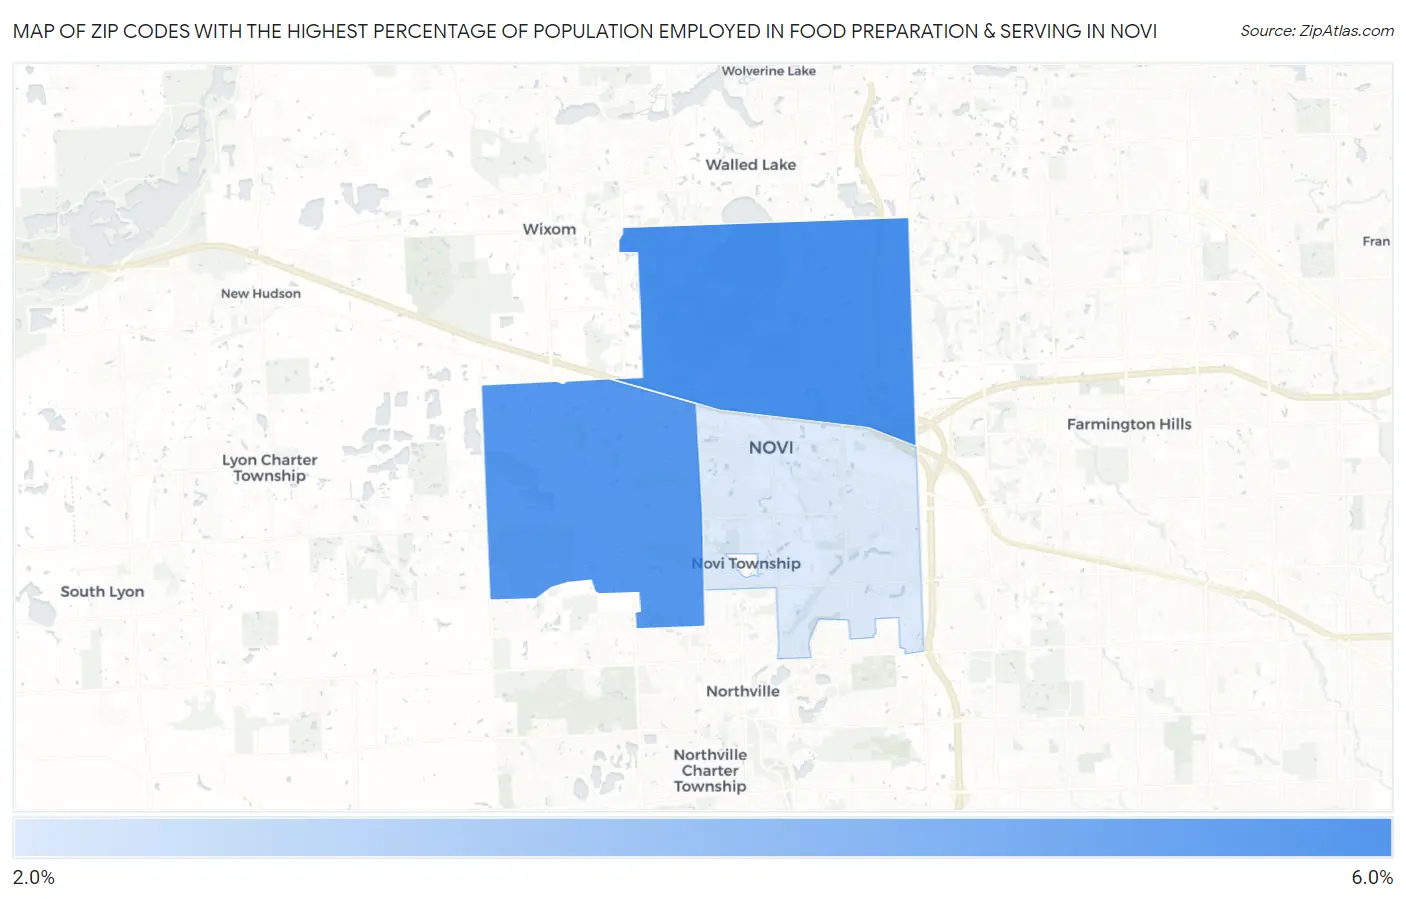
Map of Zip Codes with the Highest Percentage of Population Employed in Food Preparation & Serving in Novi
3.0%
5.3%
Zip Codes with the Highest Percentage of Population Employed in Food Preparation & Serving in Novi, MI
| Zip Code | % Employed | vs State | vs National | |
| 1. | 48377 | 5.3% | 5.7%(-0.411)#451 | 5.3%(-0.025)#11,915 |
| 2. | 48374 | 5.0% | 5.7%(-0.628)#483 | 5.3%(-0.241)#12,762 |
| 3. | 48375 | 3.0% | 5.7%(-2.70)#796 | 5.3%(-2.31)#21,358 |
1
Common Questions
What are the Top Zip Codes with the Highest Percentage of Population Employed in Food Preparation & Serving in Novi, MI?
Top Zip Codes with the Highest Percentage of Population Employed in Food Preparation & Serving in Novi, MI are:
What zip code has the Highest Percentage of Population Employed in Food Preparation & Serving in Novi, MI?
48377 has the Highest Percentage of Population Employed in Food Preparation & Serving in Novi, MI with 5.3%.
What is the Percentage of Population Employed in Food Preparation & Serving in Novi, MI?
Percentage of Population Employed in Food Preparation & Serving in Novi is 4.1%.
What is the Percentage of Population Employed in Food Preparation & Serving in Michigan?
Percentage of Population Employed in Food Preparation & Serving in Michigan is 5.7%.
What is the Percentage of Population Employed in Food Preparation & Serving in the United States?
Percentage of Population Employed in Food Preparation & Serving in the United States is 5.3%.