Zip Codes with the Highest Percentage of Population Employed in Food Preparation & Serving in Milford, MI
RELATED REPORTS & OPTIONS
Food Preparation & Serving
Milford
Compare Zip Codes
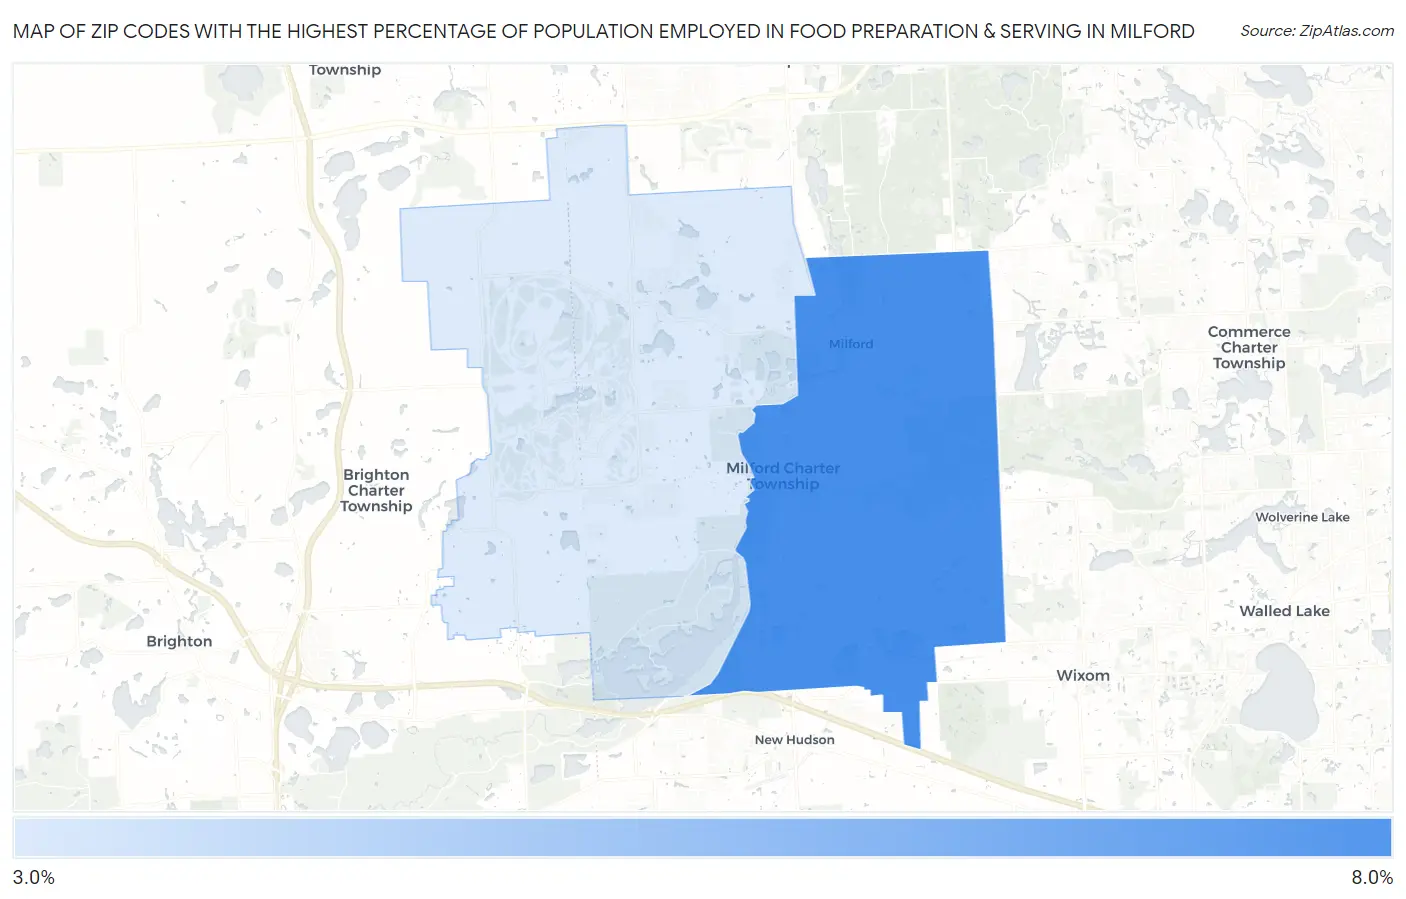
Map of Zip Codes with the Highest Percentage of Population Employed in Food Preparation & Serving in Milford
3.3%
6.3%
Zip Codes with the Highest Percentage of Population Employed in Food Preparation & Serving in Milford, MI
| Zip Code | % Employed | vs State | vs National | |
| 1. | 48381 | 6.3% | 5.7%(+0.594)#306 | 5.3%(+0.980)#8,523 |
| 2. | 48380 | 3.3% | 5.7%(-2.40)#760 | 5.3%(-2.01)#20,175 |
1
Common Questions
What are the Top Zip Codes with the Highest Percentage of Population Employed in Food Preparation & Serving in Milford, MI?
Top Zip Codes with the Highest Percentage of Population Employed in Food Preparation & Serving in Milford, MI are:
What zip code has the Highest Percentage of Population Employed in Food Preparation & Serving in Milford, MI?
48381 has the Highest Percentage of Population Employed in Food Preparation & Serving in Milford, MI with 6.3%.
What is the Percentage of Population Employed in Food Preparation & Serving in Milford, MI?
Percentage of Population Employed in Food Preparation & Serving in Milford is 2.9%.
What is the Percentage of Population Employed in Food Preparation & Serving in Michigan?
Percentage of Population Employed in Food Preparation & Serving in Michigan is 5.7%.
What is the Percentage of Population Employed in Food Preparation & Serving in the United States?
Percentage of Population Employed in Food Preparation & Serving in the United States is 5.3%.