Zip Codes with the Most Immigrants from Kuwait in Michigan
RELATED REPORTS & OPTIONS
Kuwait
Michigan
Compare Zip Codes
Map of Zip Codes with the Most Immigrants from Kuwait in Michigan
0
300
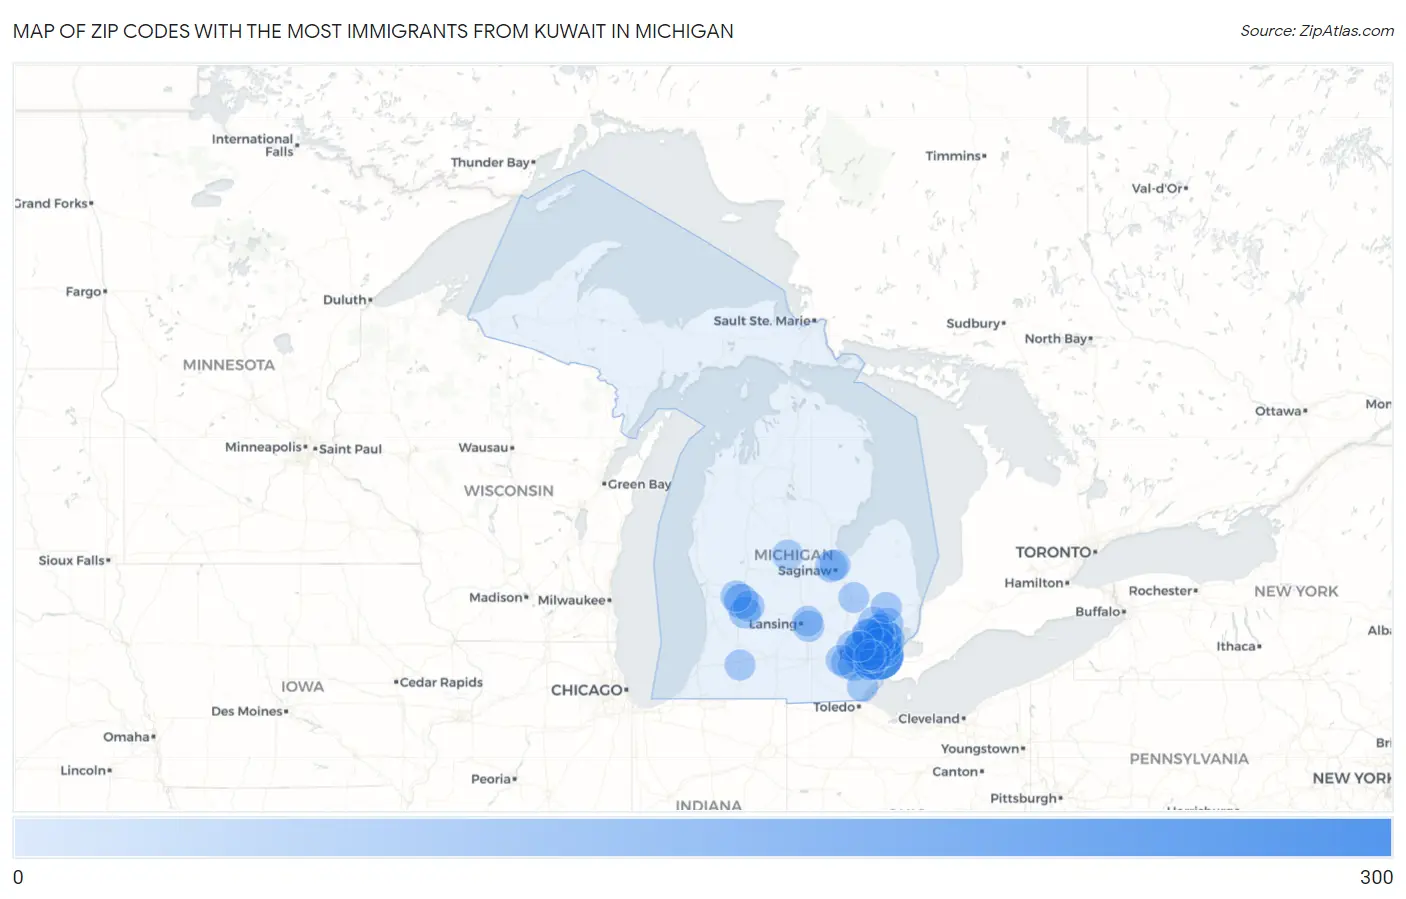
Zip Codes with the Most Immigrants from Kuwait in Michigan
| Zip Code | Kuwait | vs State | vs National | |
| 1. | 48126 | 286 | 1,324(21.60%)#1 | 35,679(0.80%)#4 |
| 2. | 48092 | 93 | 1,324(7.02%)#2 | 35,679(0.26%)#72 |
| 3. | 48127 | 71 | 1,324(5.36%)#3 | 35,679(0.20%)#110 |
| 4. | 48228 | 70 | 1,324(5.29%)#4 | 35,679(0.20%)#115 |
| 5. | 48128 | 70 | 1,324(5.29%)#5 | 35,679(0.20%)#117 |
| 6. | 49525 | 60 | 1,324(4.53%)#6 | 35,679(0.17%)#141 |
| 7. | 48188 | 49 | 1,324(3.70%)#7 | 35,679(0.14%)#192 |
| 8. | 48108 | 36 | 1,324(2.72%)#8 | 35,679(0.10%)#291 |
| 9. | 48187 | 34 | 1,324(2.57%)#9 | 35,679(0.10%)#307 |
| 10. | 48150 | 30 | 1,324(2.27%)#10 | 35,679(0.08%)#346 |
| 11. | 48168 | 30 | 1,324(2.27%)#11 | 35,679(0.08%)#348 |
| 12. | 48091 | 26 | 1,324(1.96%)#12 | 35,679(0.07%)#410 |
| 13. | 48336 | 26 | 1,324(1.96%)#13 | 35,679(0.07%)#411 |
| 14. | 48154 | 25 | 1,324(1.89%)#14 | 35,679(0.07%)#427 |
| 15. | 48603 | 25 | 1,324(1.89%)#15 | 35,679(0.07%)#431 |
| 16. | 48331 | 25 | 1,324(1.89%)#16 | 35,679(0.07%)#435 |
| 17. | 48094 | 23 | 1,324(1.74%)#17 | 35,679(0.06%)#467 |
| 18. | 49512 | 23 | 1,324(1.74%)#18 | 35,679(0.06%)#469 |
| 19. | 48197 | 21 | 1,324(1.59%)#19 | 35,679(0.06%)#497 |
| 20. | 48323 | 21 | 1,324(1.59%)#20 | 35,679(0.06%)#514 |
| 21. | 48307 | 18 | 1,324(1.36%)#21 | 35,679(0.05%)#574 |
| 22. | 48310 | 17 | 1,324(1.28%)#22 | 35,679(0.05%)#590 |
| 23. | 49301 | 17 | 1,324(1.28%)#23 | 35,679(0.05%)#604 |
| 24. | 48202 | 17 | 1,324(1.28%)#24 | 35,679(0.05%)#607 |
| 25. | 48178 | 16 | 1,324(1.21%)#25 | 35,679(0.04%)#623 |
| 26. | 48309 | 16 | 1,324(1.21%)#26 | 35,679(0.04%)#630 |
| 27. | 49321 | 15 | 1,324(1.13%)#27 | 35,679(0.04%)#684 |
| 28. | 48360 | 14 | 1,324(1.06%)#28 | 35,679(0.04%)#714 |
| 29. | 48864 | 13 | 1,324(0.98%)#29 | 35,679(0.04%)#747 |
| 30. | 48084 | 13 | 1,324(0.98%)#30 | 35,679(0.04%)#753 |
| 31. | 48161 | 11 | 1,324(0.83%)#31 | 35,679(0.03%)#809 |
| 32. | 48604 | 11 | 1,324(0.83%)#32 | 35,679(0.03%)#829 |
| 33. | 48103 | 10 | 1,324(0.76%)#33 | 35,679(0.03%)#841 |
| 34. | 48174 | 10 | 1,324(0.76%)#34 | 35,679(0.03%)#862 |
| 35. | 48098 | 9 | 1,324(0.68%)#35 | 35,679(0.03%)#920 |
| 36. | 48003 | 9 | 1,324(0.68%)#36 | 35,679(0.03%)#932 |
| 37. | 49024 | 8 | 1,324(0.60%)#37 | 35,679(0.02%)#965 |
| 38. | 48237 | 8 | 1,324(0.60%)#38 | 35,679(0.02%)#968 |
| 39. | 48858 | 7 | 1,324(0.53%)#39 | 35,679(0.02%)#991 |
| 40. | 48186 | 7 | 1,324(0.53%)#40 | 35,679(0.02%)#999 |
| 41. | 48124 | 7 | 1,324(0.53%)#41 | 35,679(0.02%)#1,004 |
| 42. | 48324 | 7 | 1,324(0.53%)#42 | 35,679(0.02%)#1,022 |
| 43. | 48823 | 6 | 1,324(0.45%)#43 | 35,679(0.02%)#1,040 |
| 44. | 48135 | 5 | 1,324(0.38%)#44 | 35,679(0.01%)#1,091 |
| 45. | 48167 | 5 | 1,324(0.38%)#45 | 35,679(0.01%)#1,097 |
| 46. | 48506 | 4 | 1,324(0.30%)#46 | 35,679(0.01%)#1,129 |
Common Questions
What are the Top 10 Zip Codes with the Most Immigrants from Kuwait in Michigan?
Top 10 Zip Codes with the Most Immigrants from Kuwait in Michigan are:
What zip code has the Most Immigrants from Kuwait in Michigan?
48126 has the Most Immigrants from Kuwait in Michigan with 286.
What is the Total Immigrants from Kuwait in the State of Michigan?
Total Immigrants from Kuwait in Michigan is 1,324.
What is the Total Immigrants from Kuwait in the United States?
Total Immigrants from Kuwait in the United States is 35,679.