Zip Codes with the Highest Percentage of Population Employed in Food Preparation & Serving in Monroe, MI
RELATED REPORTS & OPTIONS
Food Preparation & Serving
Monroe
Compare Zip Codes
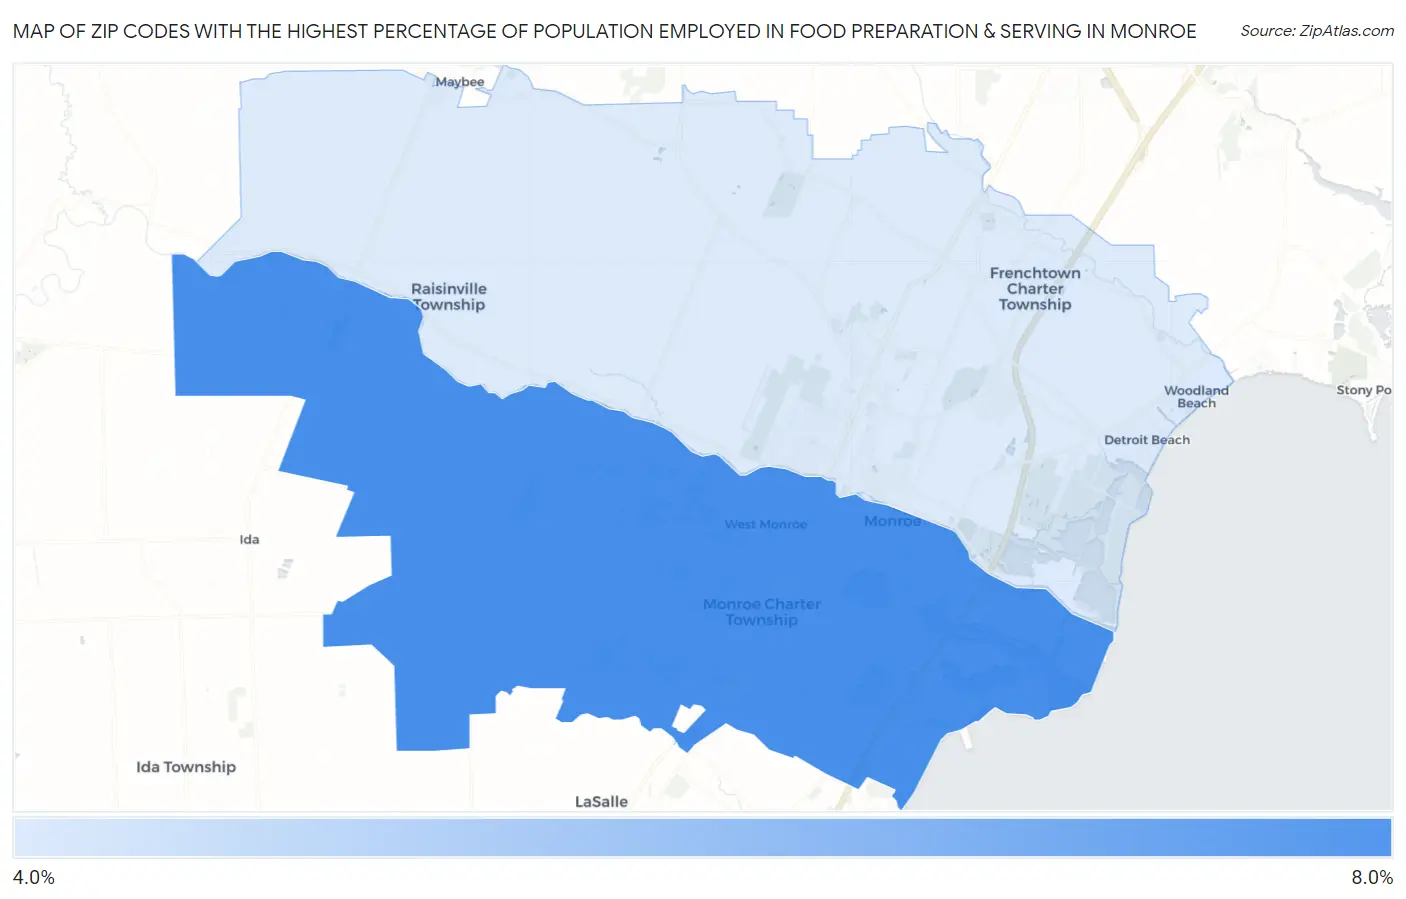
Map of Zip Codes with the Highest Percentage of Population Employed in Food Preparation & Serving in Monroe
4.4%
6.1%
Zip Codes with the Highest Percentage of Population Employed in Food Preparation & Serving in Monroe, MI
| Zip Code | % Employed | vs State | vs National | |
| 1. | 48161 | 6.1% | 5.7%(+0.408)#334 | 5.3%(+0.795)#9,082 |
| 2. | 48162 | 4.4% | 5.7%(-1.22)#568 | 5.3%(-0.837)#15,207 |
1
Common Questions
What are the Top Zip Codes with the Highest Percentage of Population Employed in Food Preparation & Serving in Monroe, MI?
Top Zip Codes with the Highest Percentage of Population Employed in Food Preparation & Serving in Monroe, MI are:
What zip code has the Highest Percentage of Population Employed in Food Preparation & Serving in Monroe, MI?
48161 has the Highest Percentage of Population Employed in Food Preparation & Serving in Monroe, MI with 6.1%.
What is the Percentage of Population Employed in Food Preparation & Serving in Monroe, MI?
Percentage of Population Employed in Food Preparation & Serving in Monroe is 5.4%.
What is the Percentage of Population Employed in Food Preparation & Serving in Michigan?
Percentage of Population Employed in Food Preparation & Serving in Michigan is 5.7%.
What is the Percentage of Population Employed in Food Preparation & Serving in the United States?
Percentage of Population Employed in Food Preparation & Serving in the United States is 5.3%.