Zip Codes with the Highest Percentage of Not-for-profit Organizations in Michigan
RELATED REPORTS & OPTIONS
Not-for-profit Organizations
Michigan
Compare Zip Codes
Map of Zip Codes with the Highest Percentage of Not-for-profit Organizations in Michigan
10.0%
50.0%
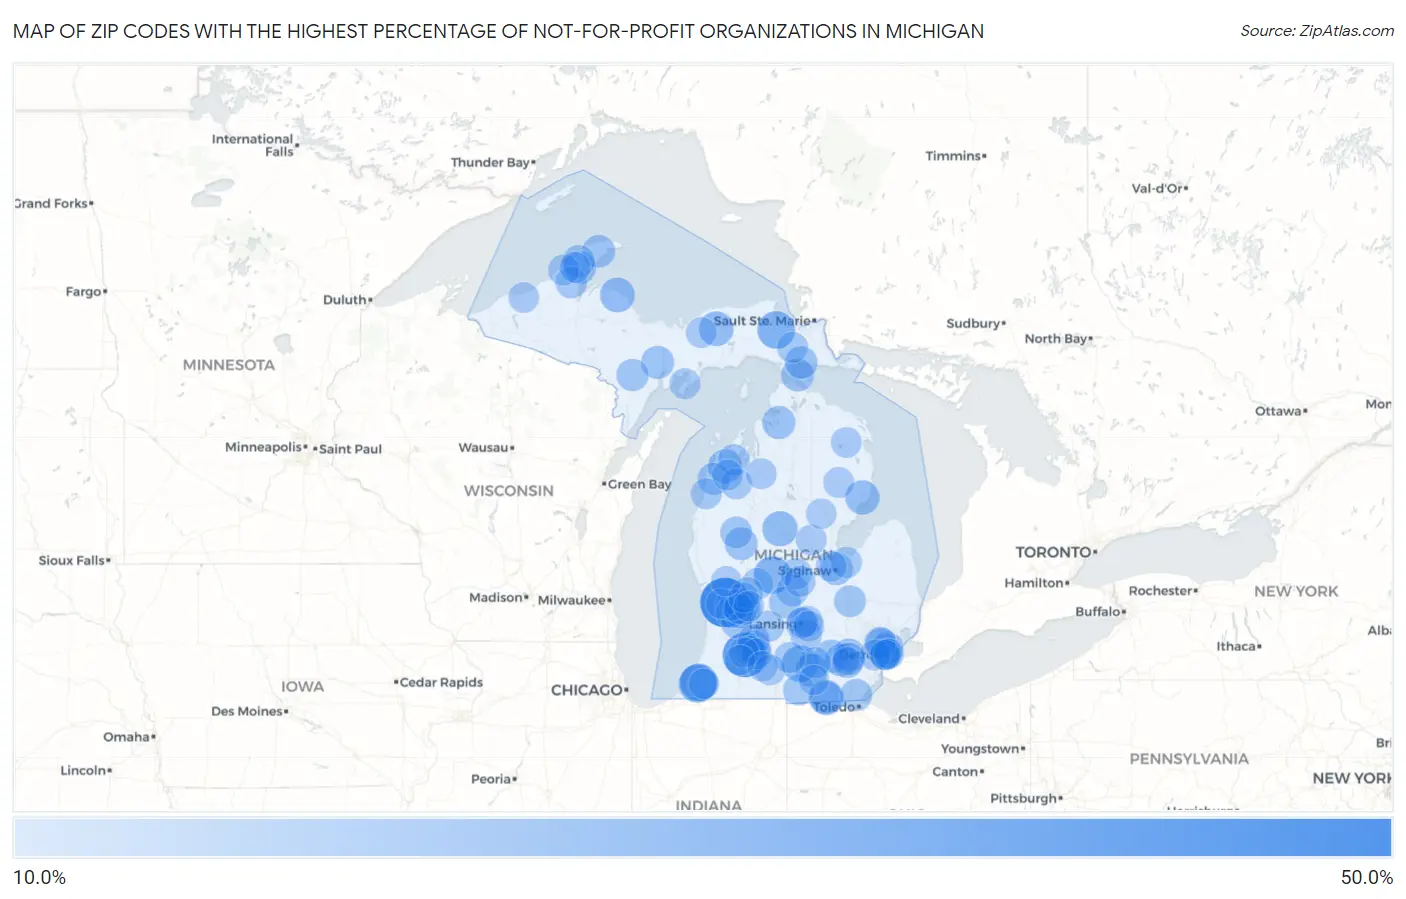
Zip Codes with the Highest Percentage of Not-for-profit Organizations in Michigan
| Zip Code | % Employed in Not-for-profit | vs State | vs National | |
| 1. | 49430 | 50.0% | 9.6% (+40.4)#1 | 8.4% (+41.6)#143 |
| 2. | 49074 | 40.4% | 9.6% (+30.7)#2 | 8.4% (+31.9)#230 |
| 3. | 49103 | 27.4% | 9.6% (+17.7)#3 | 8.4% (+18.9)#555 |
| 4. | 49104 | 27.1% | 9.6% (+17.4)#4 | 8.4% (+18.6)#570 |
| 5. | 49728 | 26.8% | 9.6% (+17.2)#5 | 8.4% (+18.4)#583 |
| 6. | 48852 | 26.3% | 9.6% (+16.7)#6 | 8.4% (+17.9)#609 |
| 7. | 49283 | 24.6% | 9.6% (+15.0)#7 | 8.4% (+16.2)#729 |
| 8. | 48633 | 22.2% | 9.6% (+12.6)#8 | 8.4% (+13.8)#986 |
| 9. | 49289 | 22.2% | 9.6% (+12.6)#9 | 8.4% (+13.8)#987 |
| 10. | 49808 | 21.6% | 9.6% (+12.0)#10 | 8.4% (+13.2)#1,061 |
| 11. | 49883 | 21.1% | 9.6% (+11.4)#11 | 8.4% (+12.6)#1,142 |
| 12. | 48730 | 20.6% | 9.6% (+10.9)#12 | 8.4% (+12.1)#1,206 |
| 13. | 49650 | 20.0% | 9.6% (+10.4)#13 | 8.4% (+11.6)#1,279 |
| 14. | 49060 | 20.0% | 9.6% (+10.4)#14 | 8.4% (+11.6)#1,285 |
| 15. | 49506 | 19.8% | 9.6% (+10.1)#15 | 8.4% (+11.3)#1,328 |
| 16. | 49503 | 19.2% | 9.6% (+9.56)#16 | 8.4% (+10.8)#1,438 |
| 17. | 48118 | 18.5% | 9.6% (+8.90)#17 | 8.4% (+10.1)#1,576 |
| 18. | 49796 | 18.5% | 9.6% (+8.87)#18 | 8.4% (+10.1)#1,580 |
| 19. | 49234 | 18.4% | 9.6% (+8.76)#19 | 8.4% (+9.96)#1,602 |
| 20. | 49872 | 18.2% | 9.6% (+8.54)#20 | 8.4% (+9.74)#1,664 |
| 21. | 48607 | 18.1% | 9.6% (+8.41)#21 | 8.4% (+9.61)#1,697 |
| 22. | 48103 | 17.9% | 9.6% (+8.29)#22 | 8.4% (+9.49)#1,728 |
| 23. | 49279 | 17.8% | 9.6% (+8.20)#23 | 8.4% (+9.40)#1,748 |
| 24. | 49757 | 17.8% | 9.6% (+8.11)#24 | 8.4% (+9.31)#1,778 |
| 25. | 49338 | 17.7% | 9.6% (+8.07)#25 | 8.4% (+9.27)#1,790 |
| 26. | 48105 | 17.7% | 9.6% (+8.05)#26 | 8.4% (+9.25)#1,797 |
| 27. | 49950 | 17.5% | 9.6% (+7.90)#27 | 8.4% (+9.11)#1,847 |
| 28. | 49335 | 17.5% | 9.6% (+7.81)#28 | 8.4% (+9.02)#1,876 |
| 29. | 49934 | 17.4% | 9.6% (+7.73)#29 | 8.4% (+8.93)#1,910 |
| 30. | 49745 | 17.3% | 9.6% (+7.66)#30 | 8.4% (+8.86)#1,929 |
| 31. | 48202 | 17.2% | 9.6% (+7.57)#31 | 8.4% (+8.77)#1,953 |
| 32. | 48104 | 17.1% | 9.6% (+7.50)#32 | 8.4% (+8.70)#1,979 |
| 33. | 49913 | 16.9% | 9.6% (+7.30)#33 | 8.4% (+8.50)#2,041 |
| 34. | 48871 | 16.8% | 9.6% (+7.16)#34 | 8.4% (+8.37)#2,095 |
| 35. | 49546 | 16.7% | 9.6% (+7.02)#35 | 8.4% (+8.22)#2,144 |
| 36. | 49873 | 16.7% | 9.6% (+7.02)#36 | 8.4% (+8.22)#2,162 |
| 37. | 49616 | 16.6% | 9.6% (+6.94)#37 | 8.4% (+8.14)#2,193 |
| 38. | 48177 | 16.5% | 9.6% (+6.90)#38 | 8.4% (+8.10)#2,209 |
| 39. | 49508 | 16.2% | 9.6% (+6.58)#39 | 8.4% (+7.78)#2,346 |
| 40. | 48873 | 16.2% | 9.6% (+6.55)#40 | 8.4% (+7.75)#2,361 |
| 41. | 48502 | 15.9% | 9.6% (+6.25)#41 | 8.4% (+7.46)#2,485 |
| 42. | 49623 | 15.8% | 9.6% (+6.12)#42 | 8.4% (+7.32)#2,554 |
| 43. | 49916 | 15.7% | 9.6% (+6.09)#43 | 8.4% (+7.29)#2,569 |
| 44. | 49046 | 15.7% | 9.6% (+6.03)#44 | 8.4% (+7.23)#2,587 |
| 45. | 48234 | 15.5% | 9.6% (+5.90)#45 | 8.4% (+7.10)#2,663 |
| 46. | 48208 | 15.5% | 9.6% (+5.81)#46 | 8.4% (+7.01)#2,698 |
| 47. | 48069 | 15.3% | 9.6% (+5.69)#47 | 8.4% (+6.89)#2,757 |
| 48. | 49534 | 15.3% | 9.6% (+5.69)#48 | 8.4% (+6.89)#2,758 |
| 49. | 48201 | 15.3% | 9.6% (+5.62)#49 | 8.4% (+6.82)#2,793 |
| 50. | 49684 | 15.3% | 9.6% (+5.61)#50 | 8.4% (+6.81)#2,797 |
| 51. | 49326 | 15.2% | 9.6% (+5.53)#51 | 8.4% (+6.73)#2,839 |
| 52. | 48854 | 15.1% | 9.6% (+5.49)#52 | 8.4% (+6.69)#2,861 |
| 53. | 49254 | 15.1% | 9.6% (+5.43)#53 | 8.4% (+6.63)#2,901 |
| 54. | 48747 | 14.9% | 9.6% (+5.26)#54 | 8.4% (+6.46)#2,990 |
| 55. | 48933 | 14.9% | 9.6% (+5.26)#55 | 8.4% (+6.46)#2,996 |
| 56. | 49620 | 14.8% | 9.6% (+5.18)#56 | 8.4% (+6.38)#3,043 |
| 57. | 48801 | 14.8% | 9.6% (+5.12)#57 | 8.4% (+6.32)#3,081 |
| 58. | 49242 | 14.7% | 9.6% (+5.06)#58 | 8.4% (+6.26)#3,111 |
| 59. | 48070 | 14.7% | 9.6% (+5.01)#59 | 8.4% (+6.21)#3,140 |
| 60. | 49905 | 14.6% | 9.6% (+5.00)#60 | 8.4% (+6.20)#3,150 |
| 61. | 49930 | 14.6% | 9.6% (+4.98)#61 | 8.4% (+6.18)#3,165 |
| 62. | 49780 | 14.6% | 9.6% (+4.95)#62 | 8.4% (+6.15)#3,178 |
| 63. | 49418 | 14.5% | 9.6% (+4.90)#63 | 8.4% (+6.10)#3,203 |
| 64. | 48847 | 14.5% | 9.6% (+4.88)#64 | 8.4% (+6.08)#3,214 |
| 65. | 48897 | 14.4% | 9.6% (+4.76)#65 | 8.4% (+5.96)#3,308 |
| 66. | 49224 | 14.4% | 9.6% (+4.73)#66 | 8.4% (+5.93)#3,330 |
| 67. | 49505 | 14.3% | 9.6% (+4.65)#67 | 8.4% (+5.85)#3,370 |
| 68. | 49675 | 14.3% | 9.6% (+4.64)#68 | 8.4% (+5.84)#3,376 |
| 69. | 49835 | 14.2% | 9.6% (+4.58)#69 | 8.4% (+5.78)#3,424 |
| 70. | 49643 | 14.2% | 9.6% (+4.58)#70 | 8.4% (+5.78)#3,429 |
| 71. | 48603 | 14.2% | 9.6% (+4.54)#71 | 8.4% (+5.74)#3,443 |
| 72. | 49083 | 14.2% | 9.6% (+4.53)#72 | 8.4% (+5.73)#3,449 |
| 73. | 48108 | 14.2% | 9.6% (+4.52)#73 | 8.4% (+5.72)#3,454 |
| 74. | 49504 | 14.1% | 9.6% (+4.50)#74 | 8.4% (+5.70)#3,465 |
| 75. | 48823 | 14.1% | 9.6% (+4.47)#75 | 8.4% (+5.68)#3,485 |
| 76. | 48761 | 14.1% | 9.6% (+4.42)#76 | 8.4% (+5.62)#3,538 |
| 77. | 49884 | 14.0% | 9.6% (+4.39)#77 | 8.4% (+5.59)#3,561 |
| 78. | 48128 | 14.0% | 9.6% (+4.37)#78 | 8.4% (+5.57)#3,580 |
| 79. | 48912 | 14.0% | 9.6% (+4.34)#79 | 8.4% (+5.54)#3,609 |
| 80. | 48864 | 13.9% | 9.6% (+4.29)#80 | 8.4% (+5.49)#3,647 |
| 81. | 48620 | 13.8% | 9.6% (+4.20)#81 | 8.4% (+5.40)#3,716 |
| 82. | 49753 | 13.8% | 9.6% (+4.17)#82 | 8.4% (+5.37)#3,746 |
| 83. | 49012 | 13.8% | 9.6% (+4.15)#83 | 8.4% (+5.35)#3,764 |
| 84. | 49680 | 13.8% | 9.6% (+4.13)#84 | 8.4% (+5.33)#3,781 |
| 85. | 49341 | 13.8% | 9.6% (+4.13)#85 | 8.4% (+5.33)#3,783 |
| 86. | 49953 | 13.7% | 9.6% (+4.02)#86 | 8.4% (+5.22)#3,874 |
| 87. | 49029 | 13.6% | 9.6% (+4.00)#87 | 8.4% (+5.20)#3,896 |
| 88. | 49401 | 13.6% | 9.6% (+3.97)#88 | 8.4% (+5.17)#3,919 |
| 89. | 49507 | 13.6% | 9.6% (+3.96)#89 | 8.4% (+5.16)#3,930 |
| 90. | 48207 | 13.5% | 9.6% (+3.90)#90 | 8.4% (+5.10)#3,967 |
| 91. | 49306 | 13.5% | 9.6% (+3.82)#91 | 8.4% (+5.03)#4,035 |
| 92. | 49004 | 13.4% | 9.6% (+3.77)#92 | 8.4% (+4.97)#4,099 |
| 93. | 48216 | 13.3% | 9.6% (+3.70)#93 | 8.4% (+4.90)#4,164 |
| 94. | 49301 | 13.3% | 9.6% (+3.69)#94 | 8.4% (+4.89)#4,190 |
| 95. | 49008 | 13.3% | 9.6% (+3.67)#95 | 8.4% (+4.87)#4,212 |
| 96. | 48610 | 13.3% | 9.6% (+3.64)#96 | 8.4% (+4.84)#4,231 |
| 97. | 49102 | 13.3% | 9.6% (+3.62)#97 | 8.4% (+4.82)#4,248 |
| 98. | 49220 | 13.2% | 9.6% (+3.59)#98 | 8.4% (+4.79)#4,281 |
| 99. | 49051 | 13.2% | 9.6% (+3.58)#99 | 8.4% (+4.78)#4,291 |
| 100. | 49303 | 13.2% | 9.6% (+3.52)#100 | 8.4% (+4.73)#4,347 |
Common Questions
What are the Top 10 Zip Codes with the Highest Percentage of Not-for-profit Organizations in Michigan?
Top 10 Zip Codes with the Highest Percentage of Not-for-profit Organizations in Michigan are:
What zip code has the Highest Percentage of Not-for-profit Organizations in Michigan?
49430 has the Highest Percentage of Not-for-profit Organizations in Michigan with 50.0%.
What is the Percentage of Not-for-profit Organizations in the State of Michigan?
Percentage of Not-for-profit Organizations in Michigan is 9.6%.
What is the Percentage of Not-for-profit Organizations in the United States?
Percentage of Not-for-profit Organizations in the United States is 8.4%.