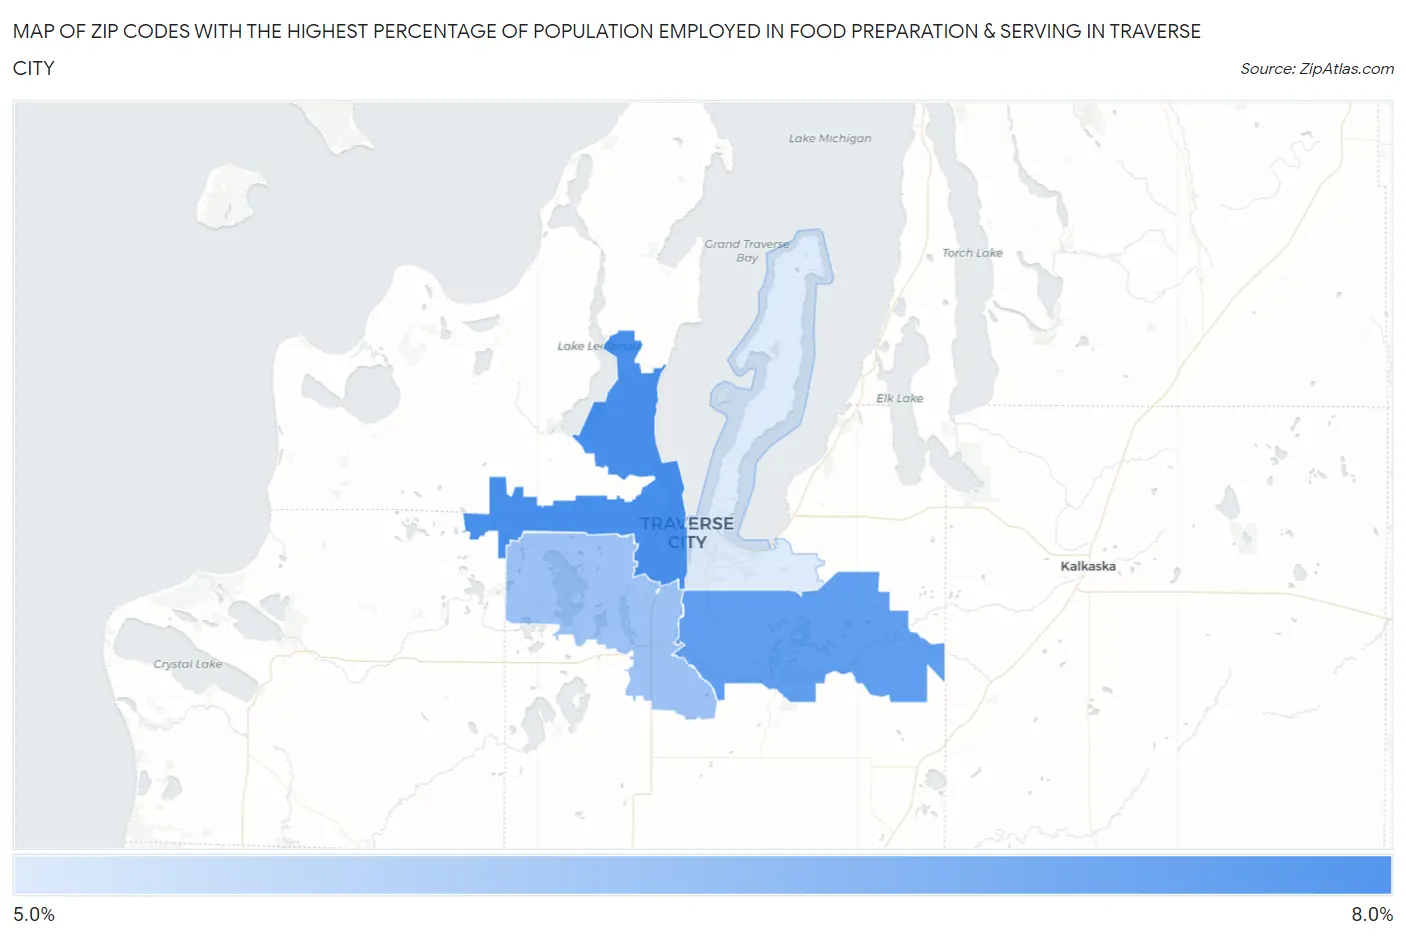
Zip Codes with the Highest Percentage of Population Employed in Food Preparation & Serving in Traverse City, MI
RELATED REPORTS & OPTIONS
Food Preparation & Serving
Traverse City
Compare Zip Codes
Map of Zip Codes with the Highest Percentage of Population Employed in Food Preparation & Serving in Traverse City
6.0%
7.4%
Zip Codes with the Highest Percentage of Population Employed in Food Preparation & Serving in Traverse City, MI
| Zip Code | % Employed | vs State | vs National | |
| 1. | 49684 | 7.4% | 5.7%(+1.72)#191 | 5.3%(+2.11)#5,755 |
| 2. | 49696 | 7.2% | 5.7%(+1.49)#213 | 5.3%(+1.88)#6,205 |
| 3. | 49685 | 6.6% | 5.7%(+0.941)#269 | 5.3%(+1.33)#7,567 |
| 4. | 49686 | 6.0% | 5.7%(+0.325)#349 | 5.3%(+0.711)#9,354 |
1
Common Questions
What are the Top 3 Zip Codes with the Highest Percentage of Population Employed in Food Preparation & Serving in Traverse City, MI?
Top 3 Zip Codes with the Highest Percentage of Population Employed in Food Preparation & Serving in Traverse City, MI are:
What zip code has the Highest Percentage of Population Employed in Food Preparation & Serving in Traverse City, MI?
49684 has the Highest Percentage of Population Employed in Food Preparation & Serving in Traverse City, MI with 7.4%.
What is the Percentage of Population Employed in Food Preparation & Serving in Traverse City, MI?
Percentage of Population Employed in Food Preparation & Serving in Traverse City is 7.1%.
What is the Percentage of Population Employed in Food Preparation & Serving in Michigan?
Percentage of Population Employed in Food Preparation & Serving in Michigan is 5.7%.
What is the Percentage of Population Employed in Food Preparation & Serving in the United States?
Percentage of Population Employed in Food Preparation & Serving in the United States is 5.3%.