Zip Codes with the Highest Percentage of Population Employed in Food Preparation & Serving in Battle Creek, MI
RELATED REPORTS & OPTIONS
Food Preparation & Serving
Battle Creek
Compare Zip Codes
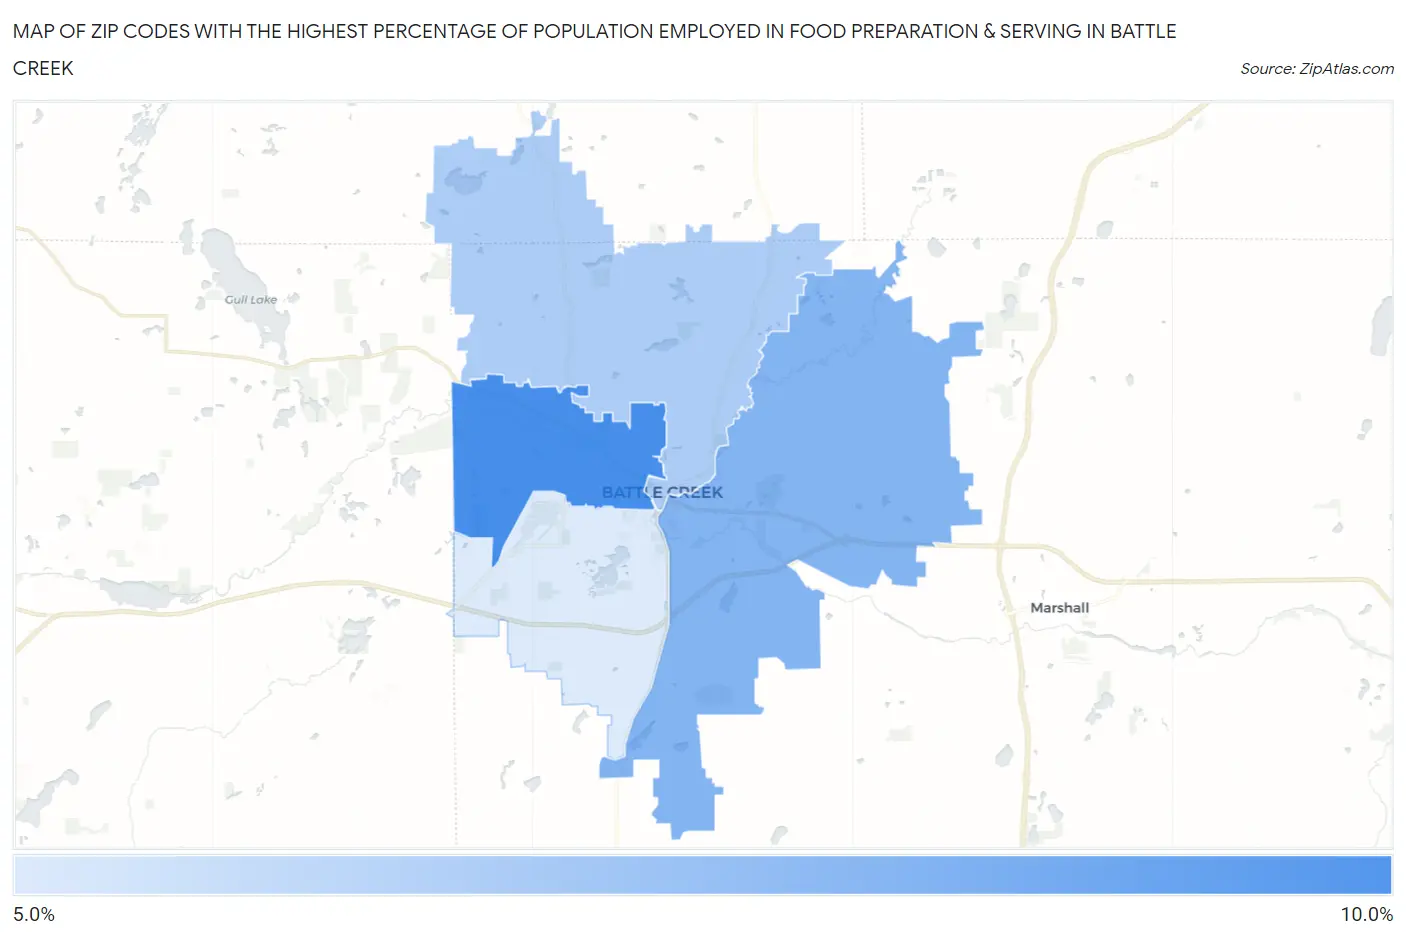
Map of Zip Codes with the Highest Percentage of Population Employed in Food Preparation & Serving in Battle Creek
5.5%
9.7%
Zip Codes with the Highest Percentage of Population Employed in Food Preparation & Serving in Battle Creek, MI
| Zip Code | % Employed | vs State | vs National | |
| 1. | 49037 | 9.7% | 5.7%(+3.99)#80 | 5.3%(+4.37)#2,919 |
| 2. | 49014 | 7.9% | 5.7%(+2.26)#154 | 5.3%(+2.65)#4,841 |
| 3. | 49017 | 6.8% | 5.7%(+1.15)#242 | 5.3%(+1.54)#6,997 |
| 4. | 49015 | 5.5% | 5.7%(-0.218)#426 | 5.3%(+0.168)#11,205 |
1
Common Questions
What are the Top 3 Zip Codes with the Highest Percentage of Population Employed in Food Preparation & Serving in Battle Creek, MI?
Top 3 Zip Codes with the Highest Percentage of Population Employed in Food Preparation & Serving in Battle Creek, MI are:
What zip code has the Highest Percentage of Population Employed in Food Preparation & Serving in Battle Creek, MI?
49037 has the Highest Percentage of Population Employed in Food Preparation & Serving in Battle Creek, MI with 9.7%.
What is the Percentage of Population Employed in Food Preparation & Serving in Battle Creek, MI?
Percentage of Population Employed in Food Preparation & Serving in Battle Creek is 7.6%.
What is the Percentage of Population Employed in Food Preparation & Serving in Michigan?
Percentage of Population Employed in Food Preparation & Serving in Michigan is 5.7%.
What is the Percentage of Population Employed in Food Preparation & Serving in the United States?
Percentage of Population Employed in Food Preparation & Serving in the United States is 5.3%.