Zip Codes with the Highest Percentage of Population Employed in Food Preparation & Serving in Troy, MI
RELATED REPORTS & OPTIONS
Food Preparation & Serving
Troy
Compare Zip Codes
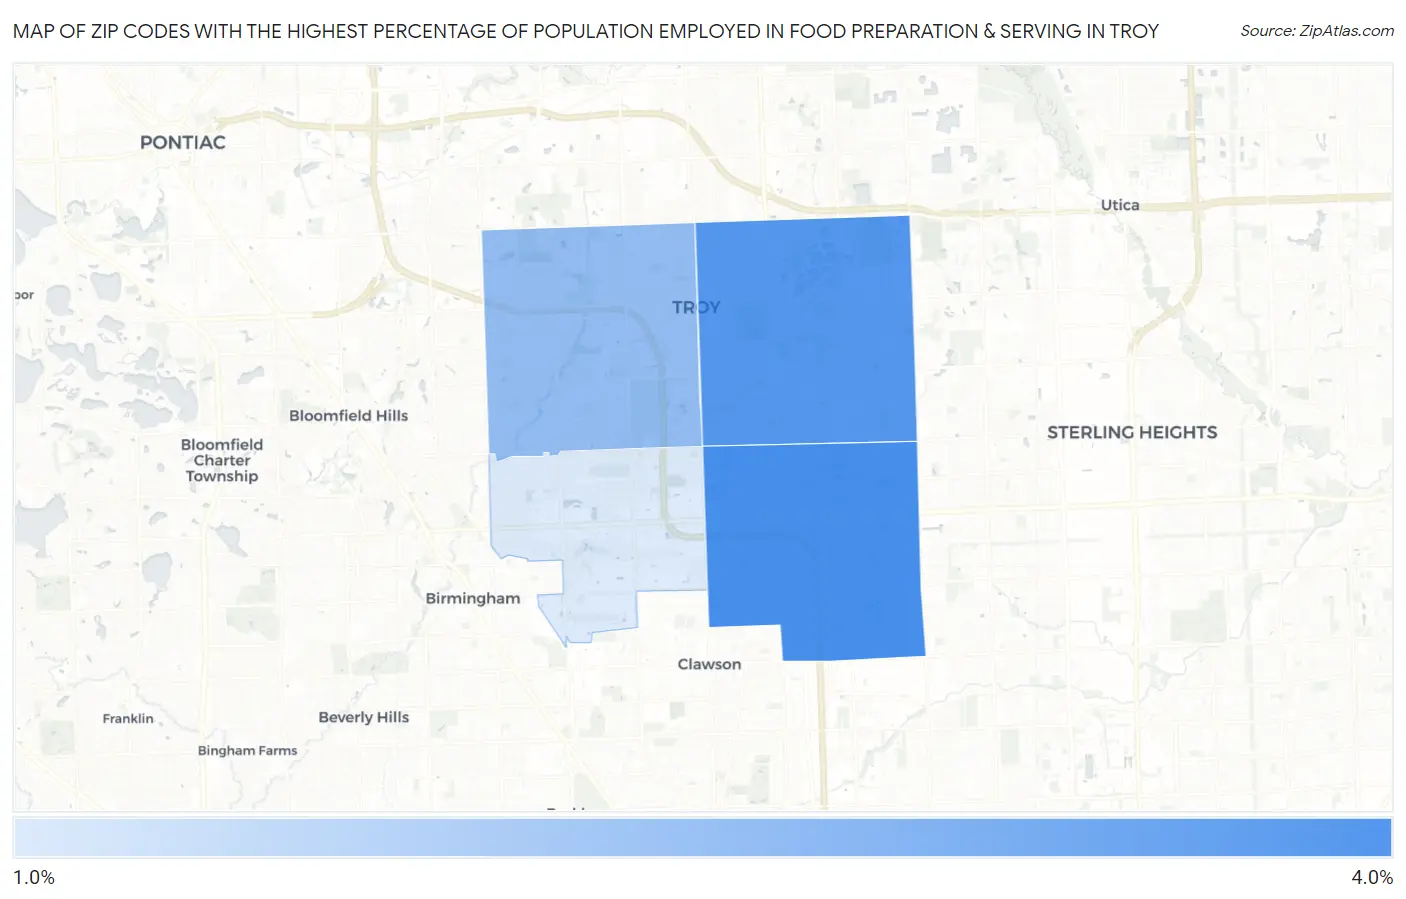
Map of Zip Codes with the Highest Percentage of Population Employed in Food Preparation & Serving in Troy
1.6%
3.3%
Zip Codes with the Highest Percentage of Population Employed in Food Preparation & Serving in Troy, MI
| Zip Code | % Employed | vs State | vs National | |
| 1. | 48083 | 3.3% | 5.7%(-2.35)#749 | 5.3%(-1.96)#19,967 |
| 2. | 48085 | 3.2% | 5.7%(-2.52)#782 | 5.3%(-2.13)#20,634 |
| 3. | 48098 | 2.4% | 5.7%(-3.24)#842 | 5.3%(-2.85)#23,354 |
| 4. | 48084 | 1.6% | 5.7%(-4.09)#889 | 5.3%(-3.71)#25,817 |
1
Common Questions
What are the Top 3 Zip Codes with the Highest Percentage of Population Employed in Food Preparation & Serving in Troy, MI?
Top 3 Zip Codes with the Highest Percentage of Population Employed in Food Preparation & Serving in Troy, MI are:
What zip code has the Highest Percentage of Population Employed in Food Preparation & Serving in Troy, MI?
48083 has the Highest Percentage of Population Employed in Food Preparation & Serving in Troy, MI with 3.3%.
What is the Percentage of Population Employed in Food Preparation & Serving in Troy, MI?
Percentage of Population Employed in Food Preparation & Serving in Troy is 2.7%.
What is the Percentage of Population Employed in Food Preparation & Serving in Michigan?
Percentage of Population Employed in Food Preparation & Serving in Michigan is 5.7%.
What is the Percentage of Population Employed in Food Preparation & Serving in the United States?
Percentage of Population Employed in Food Preparation & Serving in the United States is 5.3%.