Zip Codes with the Highest Percentage of Population with a Degree in Literature and Languages in Michigan
RELATED REPORTS & OPTIONS
Literature and Languages
Michigan
Compare Zip Codes
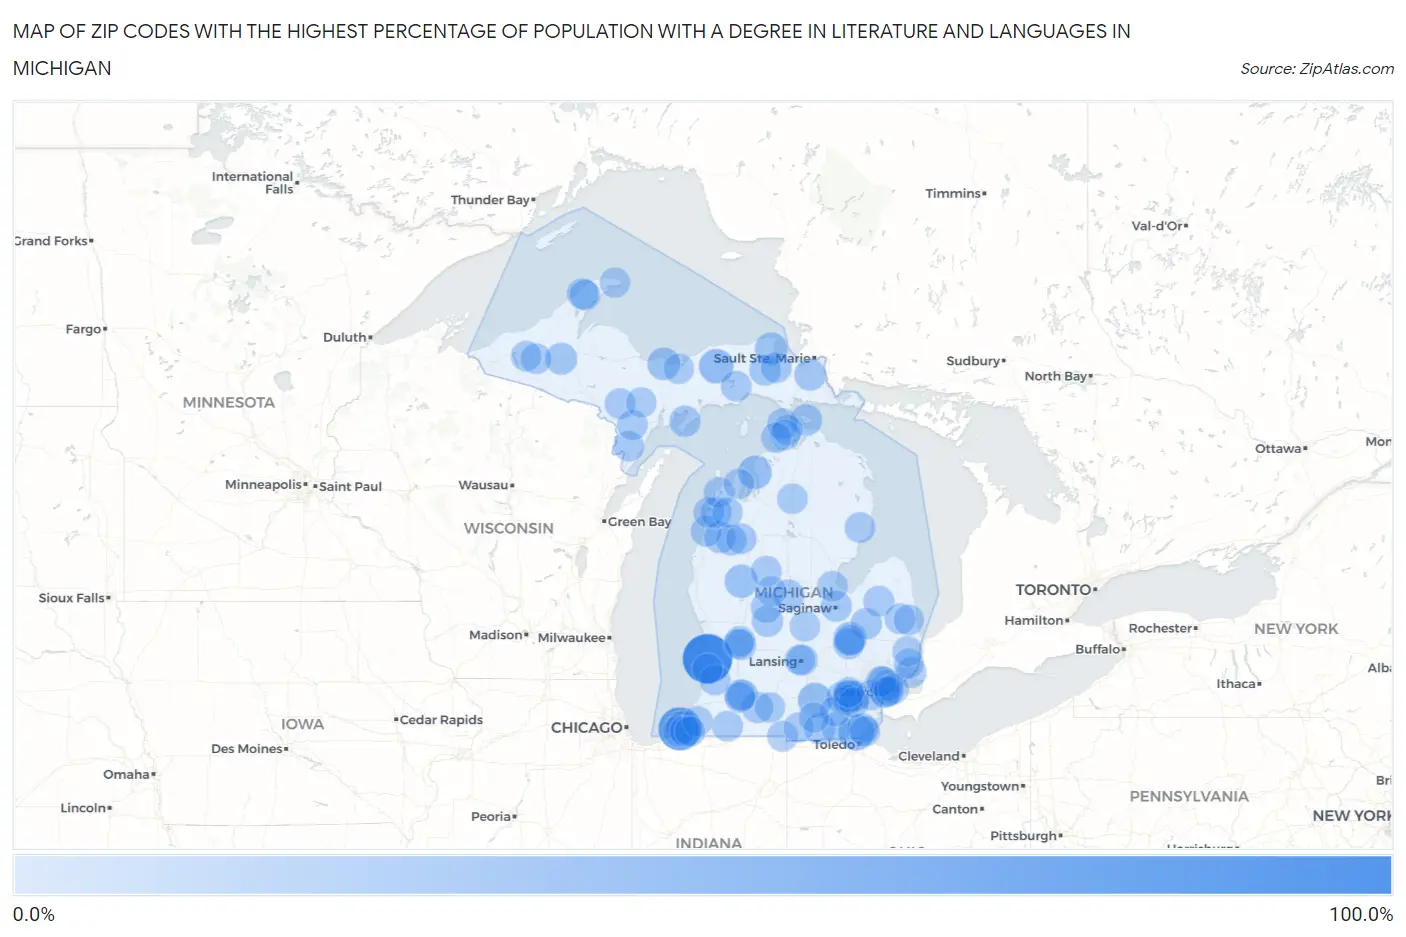
Map of Zip Codes with the Highest Percentage of Population with a Degree in Literature and Languages in Michigan
0.0%
100.0%
Zip Codes with the Highest Percentage of Population with a Degree in Literature and Languages in Michigan
| Zip Code | % Graduates | vs State | vs National | |
| 1. | 49434 | 100.0% | 3.7%(+96.3)#1 | 4.4%(+95.6)#23 |
| 2. | 49116 | 68.4% | 3.7%(+64.7)#2 | 4.4%(+64.0)#35 |
| 3. | 48177 | 33.3% | 3.7%(+29.6)#3 | 4.4%(+28.9)#161 |
| 4. | 49883 | 26.3% | 3.7%(+22.6)#4 | 4.4%(+21.9)#274 |
| 5. | 49254 | 25.1% | 3.7%(+21.4)#5 | 4.4%(+20.7)#301 |
| 6. | 49627 | 22.2% | 3.7%(+18.5)#6 | 4.4%(+17.8)#390 |
| 7. | 48502 | 21.9% | 3.7%(+18.2)#7 | 4.4%(+17.5)#399 |
| 8. | 49338 | 20.2% | 3.7%(+16.5)#8 | 4.4%(+15.8)#464 |
| 9. | 49115 | 19.6% | 3.7%(+15.9)#9 | 4.4%(+15.2)#500 |
| 10. | 49806 | 17.5% | 3.7%(+13.8)#10 | 4.4%(+13.1)#603 |
| 11. | 49768 | 17.3% | 3.7%(+13.6)#11 | 4.4%(+12.9)#615 |
| 12. | 48109 | 16.1% | 3.7%(+12.4)#12 | 4.4%(+11.7)#712 |
| 13. | 49961 | 13.6% | 3.7%(+9.94)#13 | 4.4%(+9.23)#963 |
| 14. | 49775 | 13.3% | 3.7%(+9.63)#14 | 4.4%(+8.92)#1,008 |
| 15. | 48030 | 12.8% | 3.7%(+9.12)#15 | 4.4%(+8.41)#1,076 |
| 16. | 49235 | 12.5% | 3.7%(+8.80)#16 | 4.4%(+8.09)#1,140 |
| 17. | 49724 | 11.5% | 3.7%(+7.82)#17 | 4.4%(+7.11)#1,329 |
| 18. | 49835 | 11.4% | 3.7%(+7.71)#18 | 4.4%(+7.00)#1,360 |
| 19. | 49129 | 11.3% | 3.7%(+7.62)#19 | 4.4%(+6.91)#1,383 |
| 20. | 49052 | 11.3% | 3.7%(+7.55)#20 | 4.4%(+6.84)#1,397 |
| 21. | 48464 | 11.1% | 3.7%(+7.41)#21 | 4.4%(+6.70)#1,424 |
| 22. | 48885 | 11.1% | 3.7%(+7.41)#22 | 4.4%(+6.70)#1,427 |
| 23. | 49619 | 11.1% | 3.7%(+7.41)#23 | 4.4%(+6.70)#1,428 |
| 24. | 49748 | 11.1% | 3.7%(+7.41)#24 | 4.4%(+6.70)#1,449 |
| 25. | 49901 | 11.0% | 3.7%(+7.26)#25 | 4.4%(+6.55)#1,489 |
| 26. | 48859 | 10.6% | 3.7%(+6.91)#26 | 4.4%(+6.20)#1,591 |
| 27. | 48607 | 10.4% | 3.7%(+6.68)#27 | 4.4%(+5.97)#1,684 |
| 28. | 49638 | 9.6% | 3.7%(+5.90)#28 | 4.4%(+5.19)#2,000 |
| 29. | 49728 | 9.5% | 3.7%(+5.82)#29 | 4.4%(+5.11)#2,029 |
| 30. | 48208 | 9.5% | 3.7%(+5.78)#30 | 4.4%(+5.07)#2,054 |
| 31. | 48507 | 9.4% | 3.7%(+5.74)#31 | 4.4%(+5.03)#2,068 |
| 32. | 48145 | 9.3% | 3.7%(+5.64)#32 | 4.4%(+4.93)#2,126 |
| 33. | 49675 | 9.3% | 3.7%(+5.60)#33 | 4.4%(+4.89)#2,144 |
| 34. | 48886 | 9.2% | 3.7%(+5.48)#34 | 4.4%(+4.76)#2,224 |
| 35. | 49834 | 9.1% | 3.7%(+5.39)#35 | 4.4%(+4.68)#2,271 |
| 36. | 48103 | 9.1% | 3.7%(+5.39)#36 | 4.4%(+4.68)#2,285 |
| 37. | 49061 | 9.0% | 3.7%(+5.34)#37 | 4.4%(+4.63)#2,297 |
| 38. | 48028 | 9.0% | 3.7%(+5.29)#38 | 4.4%(+4.58)#2,322 |
| 39. | 48912 | 8.7% | 3.7%(+4.98)#39 | 4.4%(+4.27)#2,497 |
| 40. | 49617 | 8.7% | 3.7%(+4.98)#40 | 4.4%(+4.27)#2,502 |
| 41. | 49255 | 8.7% | 3.7%(+4.96)#41 | 4.4%(+4.25)#2,509 |
| 42. | 49006 | 8.7% | 3.7%(+4.96)#42 | 4.4%(+4.24)#2,511 |
| 43. | 48104 | 8.7% | 3.7%(+4.95)#43 | 4.4%(+4.24)#2,515 |
| 44. | 48750 | 8.6% | 3.7%(+4.93)#44 | 4.4%(+4.22)#2,525 |
| 45. | 48729 | 8.6% | 3.7%(+4.89)#45 | 4.4%(+4.18)#2,550 |
| 46. | 48631 | 8.6% | 3.7%(+4.88)#46 | 4.4%(+4.17)#2,556 |
| 47. | 48234 | 8.6% | 3.7%(+4.88)#47 | 4.4%(+4.17)#2,559 |
| 48. | 49450 | 8.6% | 3.7%(+4.87)#48 | 4.4%(+4.16)#2,563 |
| 49. | 49718 | 8.6% | 3.7%(+4.87)#49 | 4.4%(+4.16)#2,565 |
| 50. | 49007 | 8.5% | 3.7%(+4.82)#50 | 4.4%(+4.11)#2,600 |
| 51. | 49820 | 8.3% | 3.7%(+4.63)#51 | 4.4%(+3.92)#2,737 |
| 52. | 49635 | 8.3% | 3.7%(+4.61)#52 | 4.4%(+3.90)#2,746 |
| 53. | 49406 | 8.2% | 3.7%(+4.45)#53 | 4.4%(+3.74)#2,860 |
| 54. | 49679 | 8.1% | 3.7%(+4.39)#54 | 4.4%(+3.68)#2,909 |
| 55. | 48466 | 8.0% | 3.7%(+4.30)#55 | 4.4%(+3.59)#2,978 |
| 56. | 49128 | 8.0% | 3.7%(+4.27)#56 | 4.4%(+3.56)#3,011 |
| 57. | 48422 | 7.9% | 3.7%(+4.22)#57 | 4.4%(+3.51)#3,050 |
| 58. | 49912 | 7.7% | 3.7%(+3.99)#58 | 4.4%(+3.28)#3,259 |
| 59. | 49618 | 7.7% | 3.7%(+3.99)#59 | 4.4%(+3.28)#3,260 |
| 60. | 49887 | 7.6% | 3.7%(+3.93)#60 | 4.4%(+3.22)#3,322 |
| 61. | 49636 | 7.6% | 3.7%(+3.93)#61 | 4.4%(+3.22)#3,323 |
| 62. | 48198 | 7.6% | 3.7%(+3.91)#62 | 4.4%(+3.20)#3,346 |
| 63. | 49733 | 7.6% | 3.7%(+3.88)#63 | 4.4%(+3.17)#3,373 |
| 64. | 48141 | 7.5% | 3.7%(+3.78)#64 | 4.4%(+3.07)#3,460 |
| 65. | 49925 | 7.4% | 3.7%(+3.75)#65 | 4.4%(+3.04)#3,501 |
| 66. | 49643 | 7.4% | 3.7%(+3.71)#66 | 4.4%(+3.00)#3,537 |
| 67. | 48216 | 7.4% | 3.7%(+3.69)#67 | 4.4%(+2.98)#3,564 |
| 68. | 48503 | 7.4% | 3.7%(+3.67)#68 | 4.4%(+2.96)#3,583 |
| 69. | 48108 | 7.3% | 3.7%(+3.56)#69 | 4.4%(+2.85)#3,698 |
| 70. | 49769 | 7.2% | 3.7%(+3.50)#70 | 4.4%(+2.78)#3,760 |
| 71. | 48069 | 7.2% | 3.7%(+3.49)#71 | 4.4%(+2.78)#3,763 |
| 72. | 49340 | 7.1% | 3.7%(+3.44)#72 | 4.4%(+2.73)#3,807 |
| 73. | 49755 | 7.1% | 3.7%(+3.44)#73 | 4.4%(+2.73)#3,810 |
| 74. | 49917 | 7.1% | 3.7%(+3.44)#74 | 4.4%(+2.73)#3,822 |
| 75. | 48806 | 7.1% | 3.7%(+3.40)#75 | 4.4%(+2.69)#3,873 |
| 76. | 49268 | 7.0% | 3.7%(+3.29)#76 | 4.4%(+2.58)#4,003 |
| 77. | 49918 | 7.0% | 3.7%(+3.28)#77 | 4.4%(+2.57)#4,024 |
| 78. | 49236 | 7.0% | 3.7%(+3.26)#78 | 4.4%(+2.55)#4,049 |
| 79. | 49862 | 6.9% | 3.7%(+3.25)#79 | 4.4%(+2.54)#4,055 |
| 80. | 49029 | 6.9% | 3.7%(+3.20)#80 | 4.4%(+2.49)#4,111 |
| 81. | 48230 | 6.9% | 3.7%(+3.19)#81 | 4.4%(+2.48)#4,115 |
| 82. | 49874 | 6.9% | 3.7%(+3.16)#82 | 4.4%(+2.45)#4,160 |
| 83. | 48915 | 6.8% | 3.7%(+3.13)#83 | 4.4%(+2.42)#4,203 |
| 84. | 49682 | 6.8% | 3.7%(+3.07)#84 | 4.4%(+2.36)#4,273 |
| 85. | 49103 | 6.8% | 3.7%(+3.07)#85 | 4.4%(+2.36)#4,277 |
| 86. | 49506 | 6.7% | 3.7%(+3.02)#86 | 4.4%(+2.31)#4,343 |
| 87. | 48197 | 6.7% | 3.7%(+3.01)#87 | 4.4%(+2.30)#4,350 |
| 88. | 49740 | 6.7% | 3.7%(+2.97)#88 | 4.4%(+2.26)#4,392 |
| 89. | 49113 | 6.7% | 3.7%(+2.97)#89 | 4.4%(+2.26)#4,398 |
| 90. | 49008 | 6.6% | 3.7%(+2.90)#90 | 4.4%(+2.19)#4,504 |
| 91. | 49242 | 6.6% | 3.7%(+2.90)#91 | 4.4%(+2.18)#4,506 |
| 92. | 49505 | 6.6% | 3.7%(+2.89)#92 | 4.4%(+2.18)#4,510 |
| 93. | 48105 | 6.6% | 3.7%(+2.86)#93 | 4.4%(+2.15)#4,557 |
| 94. | 48157 | 6.6% | 3.7%(+2.86)#94 | 4.4%(+2.15)#4,565 |
| 95. | 48023 | 6.5% | 3.7%(+2.84)#95 | 4.4%(+2.13)#4,585 |
| 96. | 49818 | 6.5% | 3.7%(+2.75)#96 | 4.4%(+2.04)#4,716 |
| 97. | 48063 | 6.4% | 3.7%(+2.74)#97 | 4.4%(+2.03)#4,731 |
| 98. | 48207 | 6.4% | 3.7%(+2.73)#98 | 4.4%(+2.02)#4,740 |
| 99. | 49220 | 6.4% | 3.7%(+2.72)#99 | 4.4%(+2.01)#4,759 |
| 100. | 49503 | 6.4% | 3.7%(+2.70)#100 | 4.4%(+1.99)#4,805 |
Common Questions
What are the Top 10 Zip Codes with the Highest Percentage of Population with a Degree in Literature and Languages in Michigan?
Top 10 Zip Codes with the Highest Percentage of Population with a Degree in Literature and Languages in Michigan are:
What zip code has the Highest Percentage of Population with a Degree in Literature and Languages in Michigan?
49434 has the Highest Percentage of Population with a Degree in Literature and Languages in Michigan with 100.0%.
What is the Percentage of Population with a Degree in Literature and Languages in the State of Michigan?
Percentage of Population with a Degree in Literature and Languages in Michigan is 3.7%.
What is the Percentage of Population with a Degree in Literature and Languages in the United States?
Percentage of Population with a Degree in Literature and Languages in the United States is 4.4%.