Zip Codes with the Highest Percentage of Population Employed in Food Preparation & Serving in Lansing, MI
RELATED REPORTS & OPTIONS
Food Preparation & Serving
Lansing
Compare Zip Codes
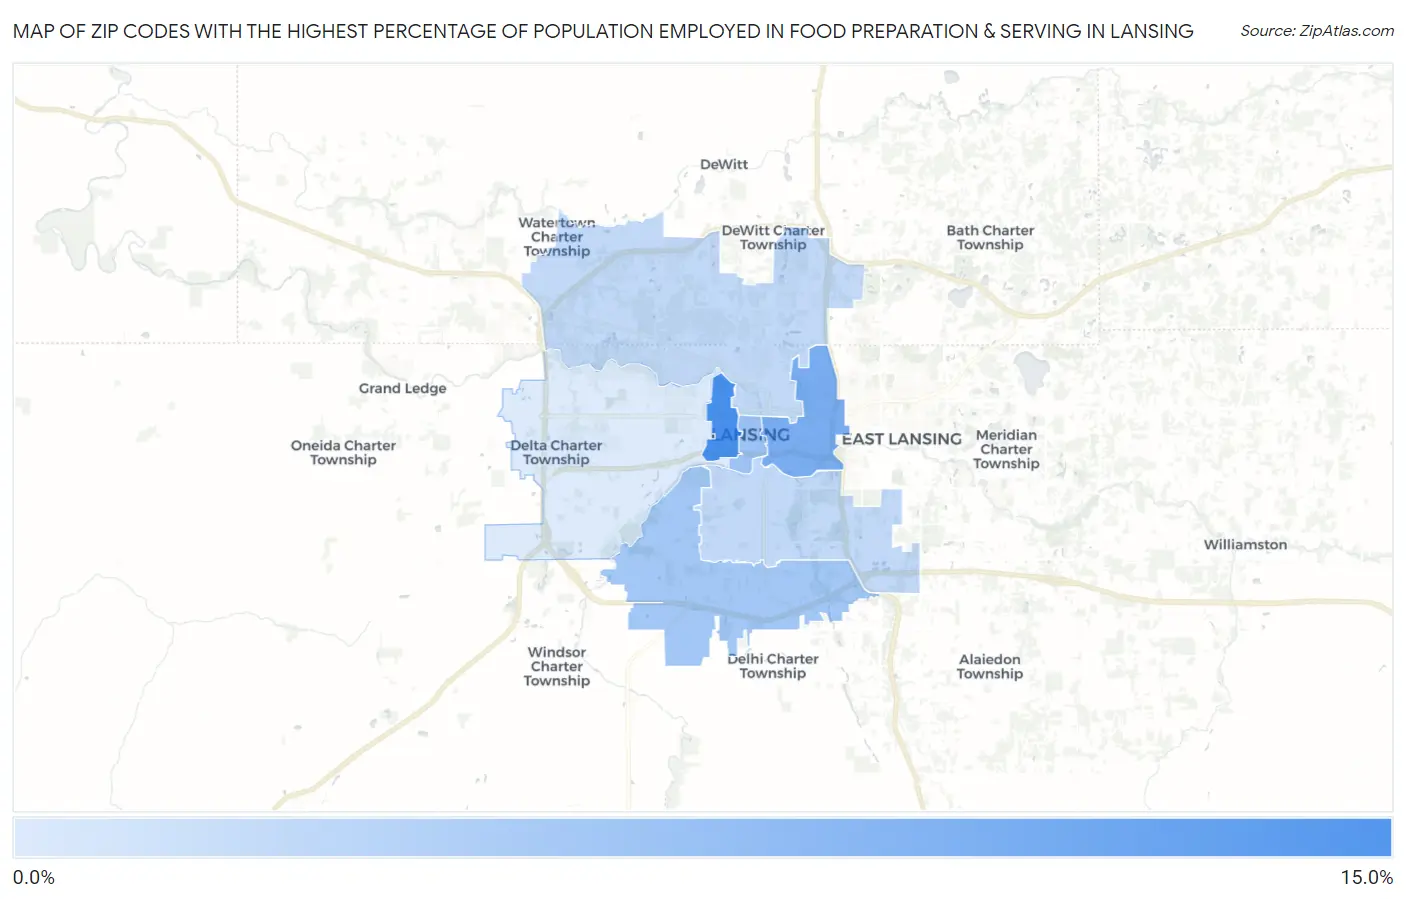
Map of Zip Codes with the Highest Percentage of Population Employed in Food Preparation & Serving in Lansing
4.4%
11.4%
Zip Codes with the Highest Percentage of Population Employed in Food Preparation & Serving in Lansing, MI
| Zip Code | % Employed | vs State | vs National | |
| 1. | 48915 | 11.4% | 5.7%(+5.73)#44 | 5.3%(+6.12)#1,875 |
| 2. | 48912 | 8.9% | 5.7%(+3.27)#104 | 5.3%(+3.66)#3,580 |
| 3. | 48933 | 7.3% | 5.7%(+1.67)#195 | 5.3%(+2.06)#5,852 |
| 4. | 48911 | 7.0% | 5.7%(+1.37)#229 | 5.3%(+1.75)#6,459 |
| 5. | 48906 | 5.7% | 5.7%(+0.052)#386 | 5.3%(+0.439)#10,258 |
| 6. | 48910 | 5.7% | 5.7%(+0.051)#387 | 5.3%(+0.437)#10,263 |
| 7. | 48917 | 4.4% | 5.7%(-1.24)#576 | 5.3%(-0.857)#15,293 |
1
Common Questions
What are the Top 5 Zip Codes with the Highest Percentage of Population Employed in Food Preparation & Serving in Lansing, MI?
Top 5 Zip Codes with the Highest Percentage of Population Employed in Food Preparation & Serving in Lansing, MI are:
What zip code has the Highest Percentage of Population Employed in Food Preparation & Serving in Lansing, MI?
48915 has the Highest Percentage of Population Employed in Food Preparation & Serving in Lansing, MI with 11.4%.
What is the Percentage of Population Employed in Food Preparation & Serving in Lansing, MI?
Percentage of Population Employed in Food Preparation & Serving in Lansing is 7.5%.
What is the Percentage of Population Employed in Food Preparation & Serving in Michigan?
Percentage of Population Employed in Food Preparation & Serving in Michigan is 5.7%.
What is the Percentage of Population Employed in Food Preparation & Serving in the United States?
Percentage of Population Employed in Food Preparation & Serving in the United States is 5.3%.