Zip Codes with the Largest Greek Community in Michigan
RELATED REPORTS & OPTIONS
Greek
Michigan
Compare Zip Codes
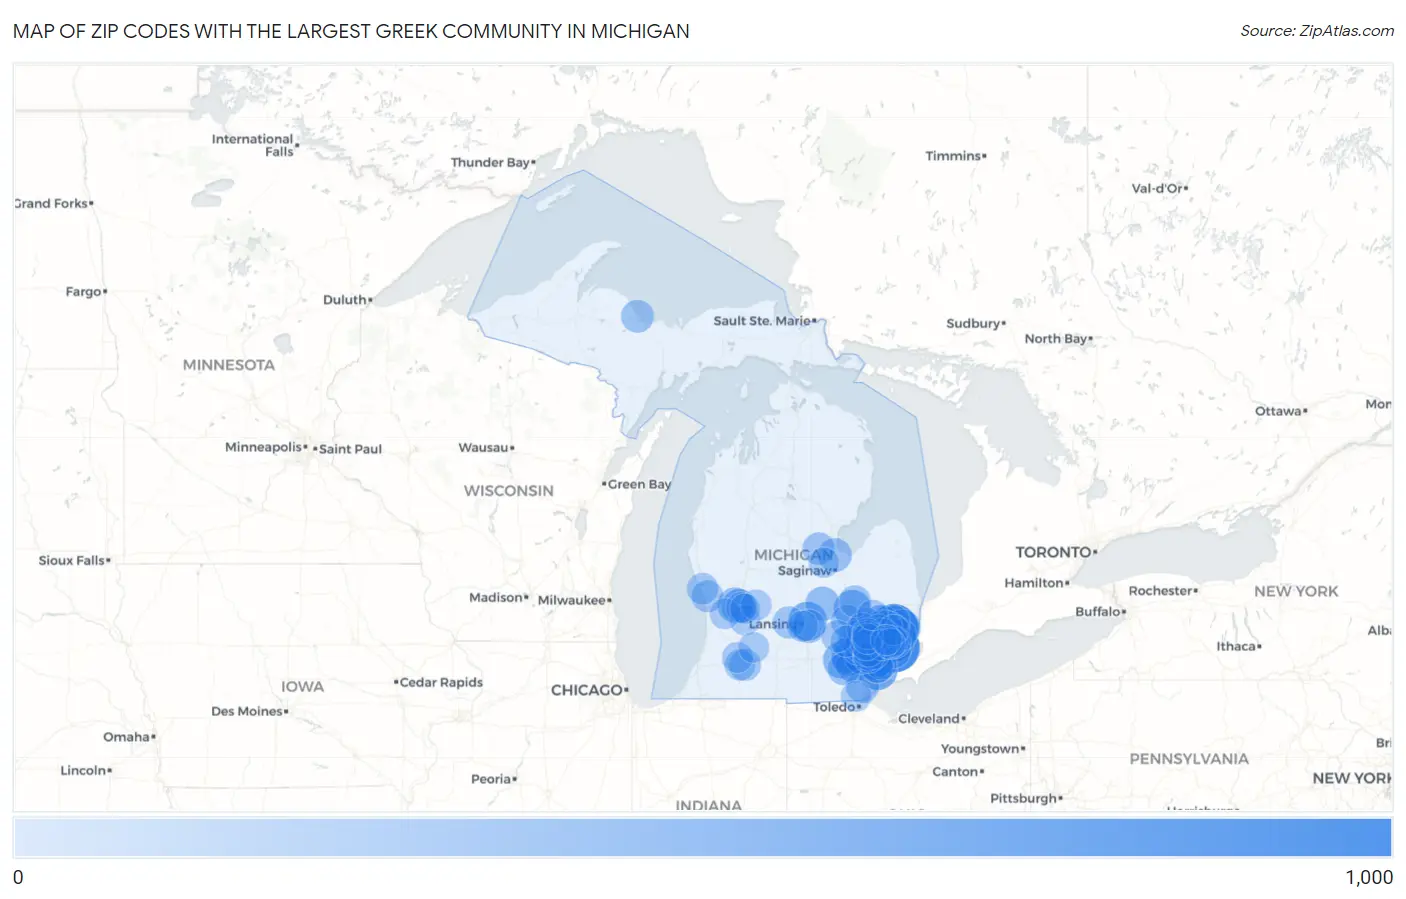
Map of Zip Codes with the Largest Greek Community in Michigan
0
1,000
Zip Codes with the Largest Greek Community in Michigan
| Zip Code | Greek | vs State | vs National | |
| 1. | 48042 | 969 | 42,706(2.27%)#1 | 1,230,319(0.08%)#39 |
| 2. | 48236 | 968 | 42,706(2.27%)#2 | 1,230,319(0.08%)#40 |
| 3. | 48183 | 548 | 42,706(1.28%)#3 | 1,230,319(0.04%)#204 |
| 4. | 48170 | 519 | 42,706(1.22%)#4 | 1,230,319(0.04%)#239 |
| 5. | 48823 | 499 | 42,706(1.17%)#5 | 1,230,319(0.04%)#265 |
| 6. | 48154 | 452 | 42,706(1.06%)#6 | 1,230,319(0.04%)#330 |
| 7. | 48306 | 449 | 42,706(1.05%)#7 | 1,230,319(0.04%)#338 |
| 8. | 48439 | 447 | 42,706(1.05%)#8 | 1,230,319(0.04%)#342 |
| 9. | 48307 | 442 | 42,706(1.03%)#9 | 1,230,319(0.04%)#349 |
| 10. | 48195 | 429 | 42,706(1.00%)#10 | 1,230,319(0.03%)#379 |
| 11. | 48080 | 418 | 42,706(0.98%)#11 | 1,230,319(0.03%)#408 |
| 12. | 48067 | 407 | 42,706(0.95%)#12 | 1,230,319(0.03%)#436 |
| 13. | 48103 | 406 | 42,706(0.95%)#13 | 1,230,319(0.03%)#438 |
| 14. | 48035 | 400 | 42,706(0.94%)#14 | 1,230,319(0.03%)#460 |
| 15. | 48038 | 391 | 42,706(0.92%)#15 | 1,230,319(0.03%)#486 |
| 16. | 48105 | 390 | 42,706(0.91%)#16 | 1,230,319(0.03%)#487 |
| 17. | 48047 | 383 | 42,706(0.90%)#17 | 1,230,319(0.03%)#500 |
| 18. | 48187 | 373 | 42,706(0.87%)#18 | 1,230,319(0.03%)#539 |
| 19. | 48009 | 355 | 42,706(0.83%)#19 | 1,230,319(0.03%)#592 |
| 20. | 48197 | 352 | 42,706(0.82%)#20 | 1,230,319(0.03%)#601 |
| 21. | 48314 | 349 | 42,706(0.82%)#21 | 1,230,319(0.03%)#617 |
| 22. | 48124 | 345 | 42,706(0.81%)#22 | 1,230,319(0.03%)#636 |
| 23. | 48180 | 344 | 42,706(0.81%)#23 | 1,230,319(0.03%)#639 |
| 24. | 49504 | 339 | 42,706(0.79%)#24 | 1,230,319(0.03%)#664 |
| 25. | 48304 | 332 | 42,706(0.78%)#25 | 1,230,319(0.03%)#683 |
| 26. | 49503 | 323 | 42,706(0.76%)#26 | 1,230,319(0.03%)#721 |
| 27. | 48375 | 308 | 42,706(0.72%)#27 | 1,230,319(0.03%)#794 |
| 28. | 48867 | 306 | 42,706(0.72%)#28 | 1,230,319(0.02%)#802 |
| 29. | 48104 | 303 | 42,706(0.71%)#29 | 1,230,319(0.02%)#815 |
| 30. | 48374 | 301 | 42,706(0.70%)#30 | 1,230,319(0.02%)#829 |
| 31. | 48312 | 300 | 42,706(0.70%)#31 | 1,230,319(0.02%)#833 |
| 32. | 48152 | 299 | 42,706(0.70%)#32 | 1,230,319(0.02%)#838 |
| 33. | 48706 | 284 | 42,706(0.67%)#33 | 1,230,319(0.02%)#924 |
| 34. | 48315 | 284 | 42,706(0.67%)#34 | 1,230,319(0.02%)#929 |
| 35. | 48381 | 284 | 42,706(0.67%)#35 | 1,230,319(0.02%)#932 |
| 36. | 48230 | 282 | 42,706(0.66%)#36 | 1,230,319(0.02%)#947 |
| 37. | 48101 | 275 | 42,706(0.64%)#37 | 1,230,319(0.02%)#996 |
| 38. | 48317 | 272 | 42,706(0.64%)#38 | 1,230,319(0.02%)#1,013 |
| 39. | 48313 | 269 | 42,706(0.63%)#39 | 1,230,319(0.02%)#1,034 |
| 40. | 48864 | 268 | 42,706(0.63%)#40 | 1,230,319(0.02%)#1,047 |
| 41. | 48161 | 259 | 42,706(0.61%)#41 | 1,230,319(0.02%)#1,117 |
| 42. | 48430 | 255 | 42,706(0.60%)#42 | 1,230,319(0.02%)#1,148 |
| 43. | 48188 | 252 | 42,706(0.59%)#43 | 1,230,319(0.02%)#1,169 |
| 44. | 48045 | 249 | 42,706(0.58%)#44 | 1,230,319(0.02%)#1,206 |
| 45. | 48310 | 247 | 42,706(0.58%)#45 | 1,230,319(0.02%)#1,215 |
| 46. | 49855 | 241 | 42,706(0.56%)#46 | 1,230,319(0.02%)#1,269 |
| 47. | 48098 | 241 | 42,706(0.56%)#47 | 1,230,319(0.02%)#1,270 |
| 48. | 48176 | 239 | 42,706(0.56%)#48 | 1,230,319(0.02%)#1,285 |
| 49. | 48642 | 235 | 42,706(0.55%)#49 | 1,230,319(0.02%)#1,323 |
| 50. | 48168 | 227 | 42,706(0.53%)#50 | 1,230,319(0.02%)#1,407 |
| 51. | 48346 | 221 | 42,706(0.52%)#51 | 1,230,319(0.02%)#1,473 |
| 52. | 48837 | 220 | 42,706(0.52%)#52 | 1,230,319(0.02%)#1,491 |
| 53. | 48167 | 217 | 42,706(0.51%)#53 | 1,230,319(0.02%)#1,531 |
| 54. | 48377 | 216 | 42,706(0.51%)#54 | 1,230,319(0.02%)#1,542 |
| 55. | 49456 | 211 | 42,706(0.49%)#55 | 1,230,319(0.02%)#1,584 |
| 56. | 48843 | 209 | 42,706(0.49%)#56 | 1,230,319(0.02%)#1,601 |
| 57. | 48072 | 206 | 42,706(0.48%)#57 | 1,230,319(0.02%)#1,641 |
| 58. | 48096 | 203 | 42,706(0.48%)#58 | 1,230,319(0.02%)#1,673 |
| 59. | 48336 | 202 | 42,706(0.47%)#59 | 1,230,319(0.02%)#1,685 |
| 60. | 49002 | 202 | 42,706(0.47%)#60 | 1,230,319(0.02%)#1,686 |
| 61. | 48509 | 201 | 42,706(0.47%)#61 | 1,230,319(0.02%)#1,703 |
| 62. | 48083 | 196 | 42,706(0.46%)#62 | 1,230,319(0.02%)#1,761 |
| 63. | 48025 | 195 | 42,706(0.46%)#63 | 1,230,319(0.02%)#1,774 |
| 64. | 49441 | 191 | 42,706(0.45%)#64 | 1,230,319(0.02%)#1,819 |
| 65. | 48386 | 190 | 42,706(0.44%)#65 | 1,230,319(0.02%)#1,843 |
| 66. | 48316 | 189 | 42,706(0.44%)#66 | 1,230,319(0.02%)#1,858 |
| 67. | 48116 | 186 | 42,706(0.44%)#67 | 1,230,319(0.02%)#1,903 |
| 68. | 48192 | 181 | 42,706(0.42%)#68 | 1,230,319(0.01%)#1,963 |
| 69. | 48193 | 180 | 42,706(0.42%)#69 | 1,230,319(0.01%)#1,977 |
| 70. | 48309 | 175 | 42,706(0.41%)#70 | 1,230,319(0.01%)#2,051 |
| 71. | 48910 | 174 | 42,706(0.41%)#71 | 1,230,319(0.01%)#2,071 |
| 72. | 48081 | 174 | 42,706(0.41%)#72 | 1,230,319(0.01%)#2,076 |
| 73. | 48073 | 173 | 42,706(0.41%)#73 | 1,230,319(0.01%)#2,086 |
| 74. | 48015 | 173 | 42,706(0.41%)#74 | 1,230,319(0.01%)#2,096 |
| 75. | 48066 | 170 | 42,706(0.40%)#75 | 1,230,319(0.01%)#2,136 |
| 76. | 48185 | 169 | 42,706(0.40%)#76 | 1,230,319(0.01%)#2,154 |
| 77. | 48085 | 169 | 42,706(0.40%)#77 | 1,230,319(0.01%)#2,161 |
| 78. | 49024 | 168 | 42,706(0.39%)#78 | 1,230,319(0.01%)#2,179 |
| 79. | 48323 | 168 | 42,706(0.39%)#79 | 1,230,319(0.01%)#2,187 |
| 80. | 49009 | 164 | 42,706(0.38%)#80 | 1,230,319(0.01%)#2,249 |
| 81. | 48301 | 164 | 42,706(0.38%)#81 | 1,230,319(0.01%)#2,260 |
| 82. | 49316 | 159 | 42,706(0.37%)#82 | 1,230,319(0.01%)#2,338 |
| 83. | 48127 | 156 | 42,706(0.37%)#83 | 1,230,319(0.01%)#2,386 |
| 84. | 49426 | 155 | 42,706(0.36%)#84 | 1,230,319(0.01%)#2,406 |
| 85. | 49506 | 155 | 42,706(0.36%)#85 | 1,230,319(0.01%)#2,409 |
| 86. | 48186 | 154 | 42,706(0.36%)#86 | 1,230,319(0.01%)#2,434 |
| 87. | 48220 | 154 | 42,706(0.36%)#87 | 1,230,319(0.01%)#2,443 |
| 88. | 49331 | 154 | 42,706(0.36%)#88 | 1,230,319(0.01%)#2,447 |
| 89. | 48150 | 153 | 42,706(0.36%)#89 | 1,230,319(0.01%)#2,461 |
| 90. | 48335 | 153 | 42,706(0.36%)#90 | 1,230,319(0.01%)#2,462 |
| 91. | 48324 | 153 | 42,706(0.36%)#91 | 1,230,319(0.01%)#2,468 |
| 92. | 48322 | 152 | 42,706(0.36%)#92 | 1,230,319(0.01%)#2,474 |
| 93. | 48371 | 150 | 42,706(0.35%)#93 | 1,230,319(0.01%)#2,521 |
| 94. | 49060 | 149 | 42,706(0.35%)#94 | 1,230,319(0.01%)#2,542 |
| 95. | 48044 | 148 | 42,706(0.35%)#95 | 1,230,319(0.01%)#2,543 |
| 96. | 48089 | 148 | 42,706(0.35%)#96 | 1,230,319(0.01%)#2,550 |
| 97. | 48182 | 148 | 42,706(0.35%)#97 | 1,230,319(0.01%)#2,557 |
| 98. | 48092 | 145 | 42,706(0.34%)#98 | 1,230,319(0.01%)#2,612 |
| 99. | 48623 | 140 | 42,706(0.33%)#99 | 1,230,319(0.01%)#2,705 |
| 100. | 49546 | 139 | 42,706(0.33%)#100 | 1,230,319(0.01%)#2,723 |
Common Questions
What are the Top 10 Zip Codes with the Largest Greek Community in Michigan?
Top 10 Zip Codes with the Largest Greek Community in Michigan are:
What zip code has the Largest Greek Community in Michigan?
48042 has the Largest Greek Community in Michigan with 969.
What is the Total Greek Population in the State of Michigan?
Total Greek Population in Michigan is 42,706.
What is the Total Greek Population in the United States?
Total Greek Population in the United States is 1,230,319.