Zip Codes with the Highest Percentage of Population with a Degree in Science and Engineering in Michigan
RELATED REPORTS & OPTIONS
Science and Engineering
Michigan
Compare Zip Codes
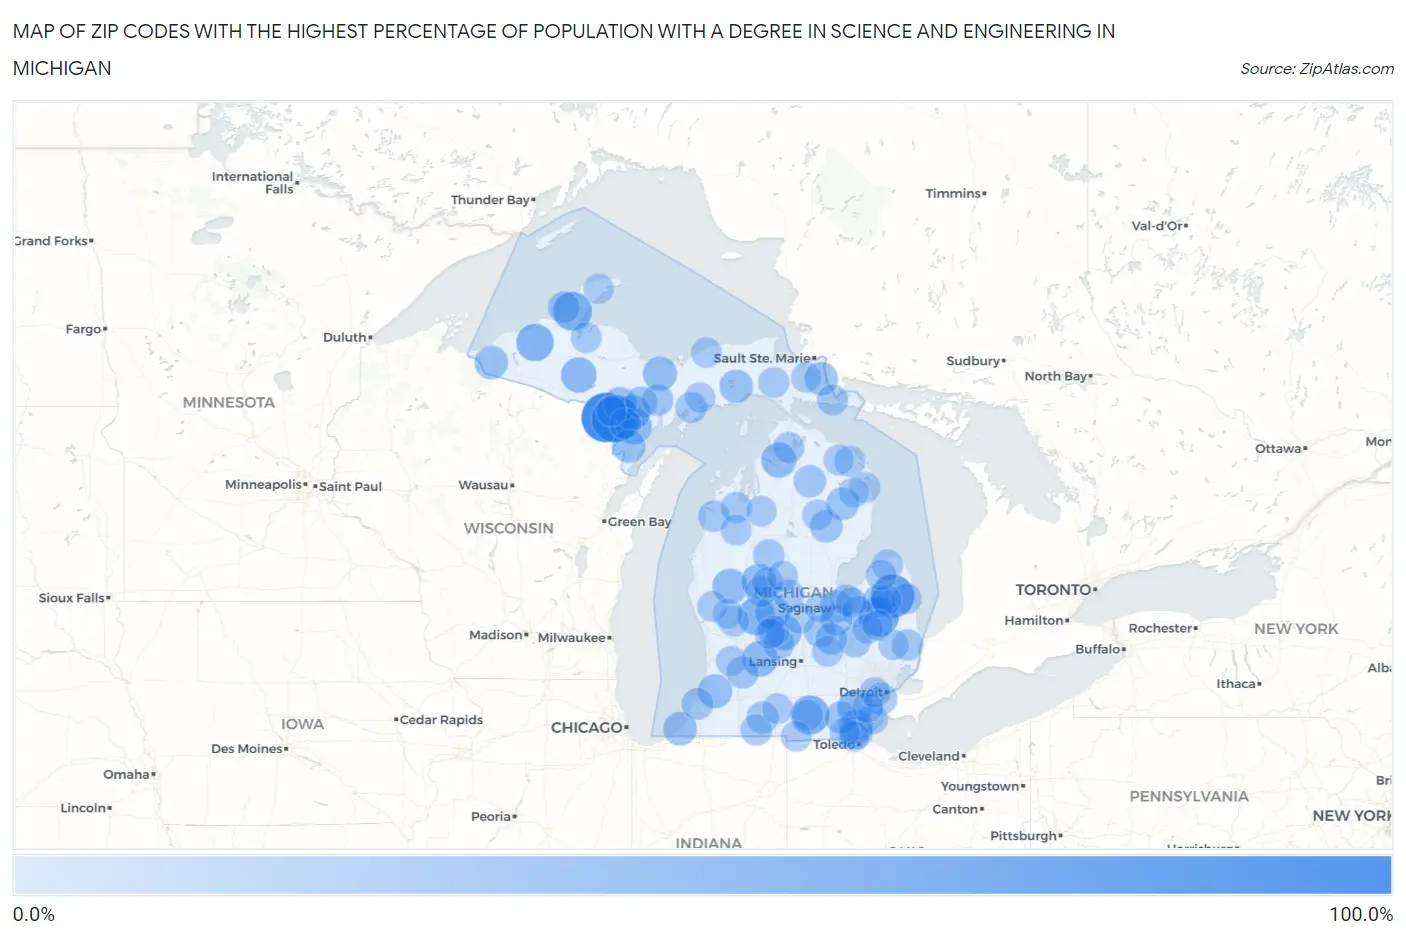
Map of Zip Codes with the Highest Percentage of Population with a Degree in Science and Engineering in Michigan
0.0%
100.0%
Zip Codes with the Highest Percentage of Population with a Degree in Science and Engineering in Michigan
| Zip Code | % Graduates | vs State | vs National | |
| 1. | 49876 | 89.2% | 11.2%(+78.0)#1 | 9.8%(+79.4)#114 |
| 2. | 49852 | 80.0% | 11.2%(+68.8)#2 | 9.8%(+70.2)#136 |
| 3. | 48410 | 66.7% | 11.2%(+55.5)#3 | 9.8%(+56.9)#210 |
| 4. | 48727 | 55.2% | 11.2%(+44.0)#4 | 9.8%(+45.4)#320 |
| 5. | 49921 | 50.0% | 11.2%(+38.8)#5 | 9.8%(+40.2)#387 |
| 6. | 49282 | 50.0% | 11.2%(+38.8)#6 | 9.8%(+40.2)#417 |
| 7. | 49347 | 45.2% | 11.2%(+34.0)#7 | 9.8%(+35.4)#517 |
| 8. | 49960 | 44.4% | 11.2%(+33.3)#8 | 9.8%(+34.7)#536 |
| 9. | 49886 | 40.0% | 11.2%(+28.8)#9 | 9.8%(+30.2)#673 |
| 10. | 49325 | 38.7% | 11.2%(+27.5)#10 | 9.8%(+28.9)#725 |
| 11. | 48845 | 38.0% | 11.2%(+26.9)#11 | 9.8%(+28.2)#749 |
| 12. | 48190 | 37.6% | 11.2%(+26.5)#12 | 9.8%(+27.9)#770 |
| 13. | 49903 | 37.5% | 11.2%(+26.3)#13 | 9.8%(+27.7)#782 |
| 14. | 49873 | 37.5% | 11.2%(+26.3)#14 | 9.8%(+27.7)#787 |
| 15. | 49796 | 36.9% | 11.2%(+25.7)#15 | 9.8%(+27.1)#816 |
| 16. | 48852 | 36.4% | 11.2%(+25.2)#16 | 9.8%(+26.6)#853 |
| 17. | 49312 | 36.4% | 11.2%(+25.2)#17 | 9.8%(+26.6)#854 |
| 18. | 49320 | 35.1% | 11.2%(+24.0)#18 | 9.8%(+25.4)#926 |
| 19. | 49027 | 33.3% | 11.2%(+22.2)#19 | 9.8%(+23.6)#1,046 |
| 20. | 49826 | 33.3% | 11.2%(+22.2)#20 | 9.8%(+23.6)#1,049 |
| 21. | 48140 | 32.4% | 11.2%(+21.3)#21 | 9.8%(+22.7)#1,105 |
| 22. | 49116 | 31.6% | 11.2%(+20.4)#22 | 9.8%(+21.8)#1,168 |
| 23. | 49959 | 31.0% | 11.2%(+19.8)#23 | 9.8%(+21.2)#1,229 |
| 24. | 49834 | 30.9% | 11.2%(+19.7)#24 | 9.8%(+21.1)#1,232 |
| 25. | 49710 | 30.8% | 11.2%(+19.6)#25 | 9.8%(+21.0)#1,244 |
| 26. | 49820 | 30.6% | 11.2%(+19.4)#26 | 9.8%(+20.8)#1,264 |
| 27. | 49887 | 30.0% | 11.2%(+18.8)#27 | 9.8%(+20.2)#1,326 |
| 28. | 48177 | 29.2% | 11.2%(+18.0)#28 | 9.8%(+19.4)#1,397 |
| 29. | 48728 | 28.8% | 11.2%(+17.7)#29 | 9.8%(+19.1)#1,430 |
| 30. | 48607 | 28.6% | 11.2%(+17.5)#30 | 9.8%(+18.8)#1,450 |
| 31. | 48654 | 28.3% | 11.2%(+17.1)#31 | 9.8%(+18.5)#1,507 |
| 32. | 49229 | 27.5% | 11.2%(+16.3)#32 | 9.8%(+17.7)#1,596 |
| 33. | 48729 | 27.3% | 11.2%(+16.2)#33 | 9.8%(+17.6)#1,615 |
| 34. | 49751 | 26.4% | 11.2%(+15.2)#34 | 9.8%(+16.6)#1,729 |
| 35. | 49344 | 26.2% | 11.2%(+15.0)#35 | 9.8%(+16.4)#1,760 |
| 36. | 48519 | 26.1% | 11.2%(+15.0)#36 | 9.8%(+16.3)#1,770 |
| 37. | 49089 | 25.9% | 11.2%(+14.7)#37 | 9.8%(+16.1)#1,804 |
| 38. | 49818 | 25.8% | 11.2%(+14.6)#38 | 9.8%(+16.0)#1,814 |
| 39. | 48841 | 25.5% | 11.2%(+14.3)#39 | 9.8%(+15.7)#1,868 |
| 40. | 48229 | 25.4% | 11.2%(+14.3)#40 | 9.8%(+15.6)#1,873 |
| 41. | 49905 | 25.4% | 11.2%(+14.2)#41 | 9.8%(+15.6)#1,887 |
| 42. | 49872 | 25.0% | 11.2%(+13.8)#42 | 9.8%(+15.2)#1,983 |
| 43. | 49084 | 25.0% | 11.2%(+13.8)#43 | 9.8%(+15.2)#1,997 |
| 44. | 48417 | 24.6% | 11.2%(+13.5)#44 | 9.8%(+14.8)#2,041 |
| 45. | 48817 | 24.5% | 11.2%(+13.3)#45 | 9.8%(+14.7)#2,071 |
| 46. | 49665 | 24.3% | 11.2%(+13.2)#46 | 9.8%(+14.5)#2,094 |
| 47. | 48851 | 24.3% | 11.2%(+13.1)#47 | 9.8%(+14.5)#2,095 |
| 48. | 49030 | 24.1% | 11.2%(+12.9)#48 | 9.8%(+14.3)#2,133 |
| 49. | 48027 | 23.8% | 11.2%(+12.7)#49 | 9.8%(+14.0)#2,186 |
| 50. | 49616 | 23.8% | 11.2%(+12.6)#50 | 9.8%(+14.0)#2,200 |
| 51. | 49332 | 23.8% | 11.2%(+12.6)#51 | 9.8%(+14.0)#2,209 |
| 52. | 49817 | 23.5% | 11.2%(+12.4)#52 | 9.8%(+13.7)#2,253 |
| 53. | 48834 | 23.2% | 11.2%(+12.0)#53 | 9.8%(+13.4)#2,335 |
| 54. | 49685 | 23.0% | 11.2%(+11.9)#54 | 9.8%(+13.3)#2,380 |
| 55. | 49847 | 23.0% | 11.2%(+11.8)#55 | 9.8%(+13.2)#2,391 |
| 56. | 48747 | 23.0% | 11.2%(+11.8)#56 | 9.8%(+13.2)#2,393 |
| 57. | 49706 | 22.9% | 11.2%(+11.8)#57 | 9.8%(+13.2)#2,400 |
| 58. | 48859 | 22.7% | 11.2%(+11.6)#58 | 9.8%(+12.9)#2,445 |
| 59. | 48166 | 22.6% | 11.2%(+11.4)#59 | 9.8%(+12.8)#2,497 |
| 60. | 48445 | 22.5% | 11.2%(+11.3)#60 | 9.8%(+12.7)#2,513 |
| 61. | 49725 | 22.2% | 11.2%(+11.1)#61 | 9.8%(+12.4)#2,586 |
| 62. | 49305 | 22.2% | 11.2%(+11.0)#62 | 9.8%(+12.4)#2,608 |
| 63. | 49249 | 21.8% | 11.2%(+10.7)#63 | 9.8%(+12.1)#2,685 |
| 64. | 49776 | 21.7% | 11.2%(+10.6)#64 | 9.8%(+12.0)#2,710 |
| 65. | 49793 | 21.7% | 11.2%(+10.6)#65 | 9.8%(+12.0)#2,719 |
| 66. | 48768 | 21.7% | 11.2%(+10.6)#66 | 9.8%(+11.9)#2,720 |
| 67. | 48414 | 21.7% | 11.2%(+10.5)#67 | 9.8%(+11.9)#2,737 |
| 68. | 48757 | 21.6% | 11.2%(+10.4)#68 | 9.8%(+11.8)#2,768 |
| 69. | 49330 | 21.5% | 11.2%(+10.4)#69 | 9.8%(+11.7)#2,778 |
| 70. | 49668 | 21.5% | 11.2%(+10.3)#70 | 9.8%(+11.7)#2,785 |
| 71. | 48427 | 21.4% | 11.2%(+10.2)#71 | 9.8%(+11.6)#2,820 |
| 72. | 48622 | 21.4% | 11.2%(+10.2)#72 | 9.8%(+11.6)#2,822 |
| 73. | 49232 | 21.4% | 11.2%(+10.2)#73 | 9.8%(+11.6)#2,831 |
| 74. | 49946 | 21.3% | 11.2%(+10.1)#74 | 9.8%(+11.5)#2,859 |
| 75. | 49766 | 21.3% | 11.2%(+10.1)#75 | 9.8%(+11.5)#2,862 |
| 76. | 49425 | 21.2% | 11.2%(+10.0)#76 | 9.8%(+11.4)#2,892 |
| 77. | 48865 | 21.2% | 11.2%(+10.0)#77 | 9.8%(+11.4)#2,898 |
| 78. | 48636 | 21.2% | 11.2%(+10.0)#78 | 9.8%(+11.4)#2,899 |
| 79. | 49680 | 20.9% | 11.2%(+9.78)#79 | 9.8%(+11.2)#2,976 |
| 80. | 49743 | 20.9% | 11.2%(+9.73)#80 | 9.8%(+11.1)#2,994 |
| 81. | 48426 | 20.8% | 11.2%(+9.67)#81 | 9.8%(+11.1)#3,021 |
| 82. | 48164 | 20.8% | 11.2%(+9.62)#82 | 9.8%(+11.0)#3,044 |
| 83. | 49092 | 20.7% | 11.2%(+9.57)#83 | 9.8%(+11.0)#3,058 |
| 84. | 48128 | 20.6% | 11.2%(+9.48)#84 | 9.8%(+10.9)#3,089 |
| 85. | 49839 | 20.6% | 11.2%(+9.47)#85 | 9.8%(+10.9)#3,099 |
| 86. | 49323 | 20.6% | 11.2%(+9.45)#86 | 9.8%(+10.8)#3,104 |
| 87. | 48731 | 20.6% | 11.2%(+9.44)#87 | 9.8%(+10.8)#3,110 |
| 88. | 48421 | 20.5% | 11.2%(+9.29)#88 | 9.8%(+10.7)#3,155 |
| 89. | 49854 | 20.4% | 11.2%(+9.21)#89 | 9.8%(+10.6)#3,191 |
| 90. | 48002 | 20.2% | 11.2%(+9.08)#90 | 9.8%(+10.5)#3,249 |
| 91. | 48461 | 20.2% | 11.2%(+9.06)#91 | 9.8%(+10.4)#3,255 |
| 92. | 48144 | 20.2% | 11.2%(+9.00)#92 | 9.8%(+10.4)#3,283 |
| 93. | 49747 | 20.1% | 11.2%(+8.90)#93 | 9.8%(+10.3)#3,305 |
| 94. | 49950 | 20.0% | 11.2%(+8.84)#94 | 9.8%(+10.2)#3,337 |
| 95. | 49276 | 20.0% | 11.2%(+8.84)#95 | 9.8%(+10.2)#3,338 |
| 96. | 48847 | 19.9% | 11.2%(+8.71)#96 | 9.8%(+10.1)#3,423 |
| 97. | 49327 | 19.8% | 11.2%(+8.59)#97 | 9.8%(+9.97)#3,461 |
| 98. | 49870 | 19.6% | 11.2%(+8.46)#98 | 9.8%(+9.85)#3,503 |
| 99. | 49752 | 19.5% | 11.2%(+8.38)#99 | 9.8%(+9.76)#3,548 |
| 100. | 48626 | 19.5% | 11.2%(+8.35)#100 | 9.8%(+9.74)#3,560 |
Common Questions
What are the Top 10 Zip Codes with the Highest Percentage of Population with a Degree in Science and Engineering in Michigan?
Top 10 Zip Codes with the Highest Percentage of Population with a Degree in Science and Engineering in Michigan are:
What zip code has the Highest Percentage of Population with a Degree in Science and Engineering in Michigan?
49876 has the Highest Percentage of Population with a Degree in Science and Engineering in Michigan with 89.2%.
What is the Percentage of Population with a Degree in Science and Engineering in the State of Michigan?
Percentage of Population with a Degree in Science and Engineering in Michigan is 11.2%.
What is the Percentage of Population with a Degree in Science and Engineering in the United States?
Percentage of Population with a Degree in Science and Engineering in the United States is 9.8%.