Zip Codes with the Highest Percentage of Population Employed in Food Preparation & Serving in Holland, MI
RELATED REPORTS & OPTIONS
Food Preparation & Serving
Holland
Compare Zip Codes
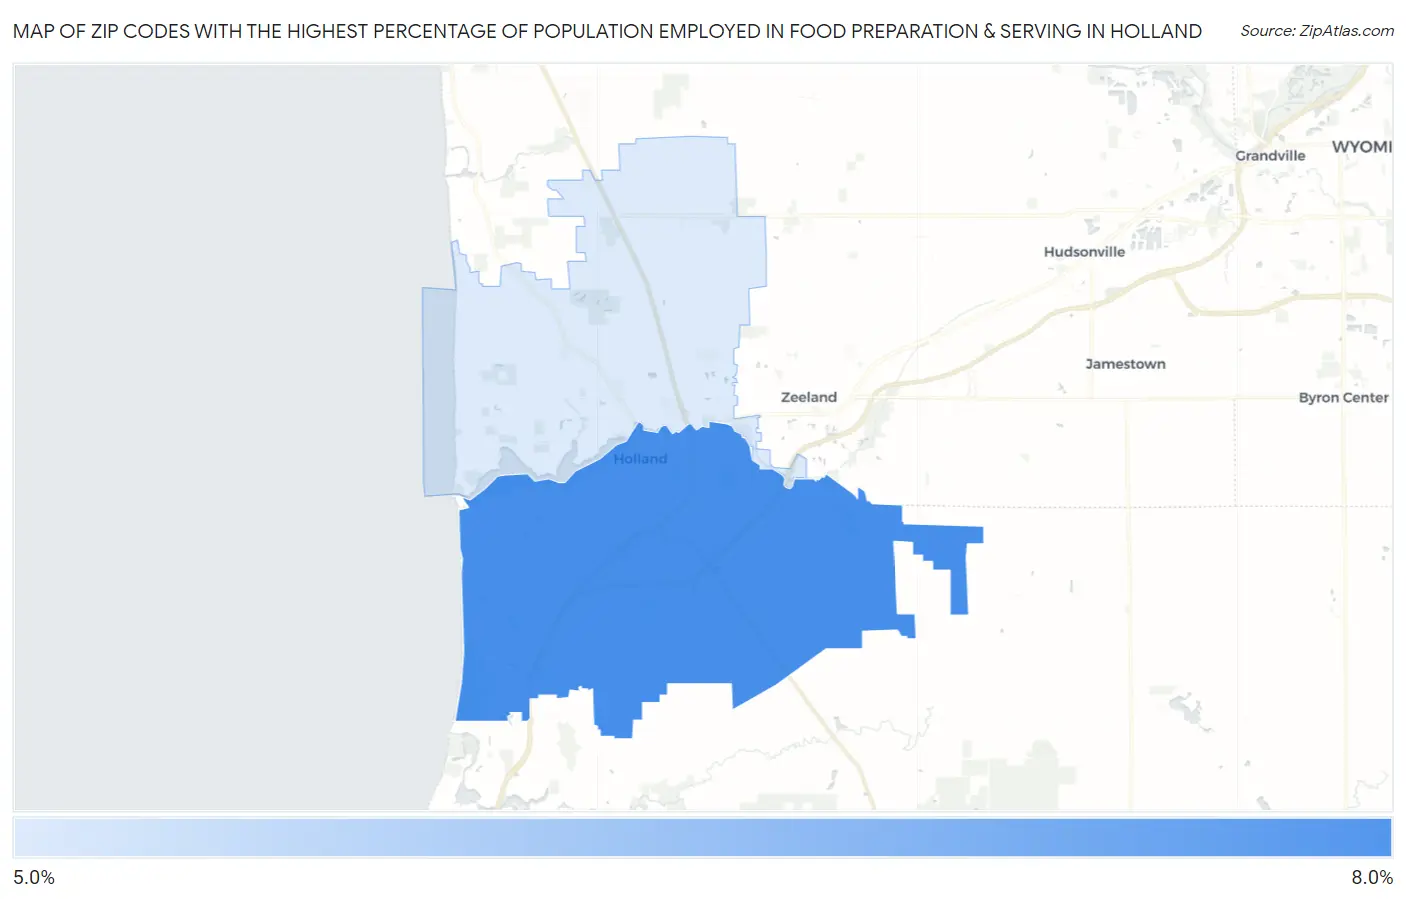
Map of Zip Codes with the Highest Percentage of Population Employed in Food Preparation & Serving in Holland
5.4%
7.3%
Zip Codes with the Highest Percentage of Population Employed in Food Preparation & Serving in Holland, MI
| Zip Code | % Employed | vs State | vs National | |
| 1. | 49423 | 7.3% | 5.7%(+1.63)#199 | 5.3%(+2.01)#5,927 |
| 2. | 49424 | 5.4% | 5.7%(-0.245)#434 | 5.3%(+0.142)#11,308 |
1
Common Questions
What are the Top Zip Codes with the Highest Percentage of Population Employed in Food Preparation & Serving in Holland, MI?
Top Zip Codes with the Highest Percentage of Population Employed in Food Preparation & Serving in Holland, MI are:
What zip code has the Highest Percentage of Population Employed in Food Preparation & Serving in Holland, MI?
49423 has the Highest Percentage of Population Employed in Food Preparation & Serving in Holland, MI with 7.3%.
What is the Percentage of Population Employed in Food Preparation & Serving in Holland, MI?
Percentage of Population Employed in Food Preparation & Serving in Holland is 7.7%.
What is the Percentage of Population Employed in Food Preparation & Serving in Michigan?
Percentage of Population Employed in Food Preparation & Serving in Michigan is 5.7%.
What is the Percentage of Population Employed in Food Preparation & Serving in the United States?
Percentage of Population Employed in Food Preparation & Serving in the United States is 5.3%.