Zip Codes with the Highest Percentage of Population Employed in Food Preparation & Serving in Grosse Pointe, MI
RELATED REPORTS & OPTIONS
Food Preparation & Serving
Grosse Pointe
Compare Zip Codes
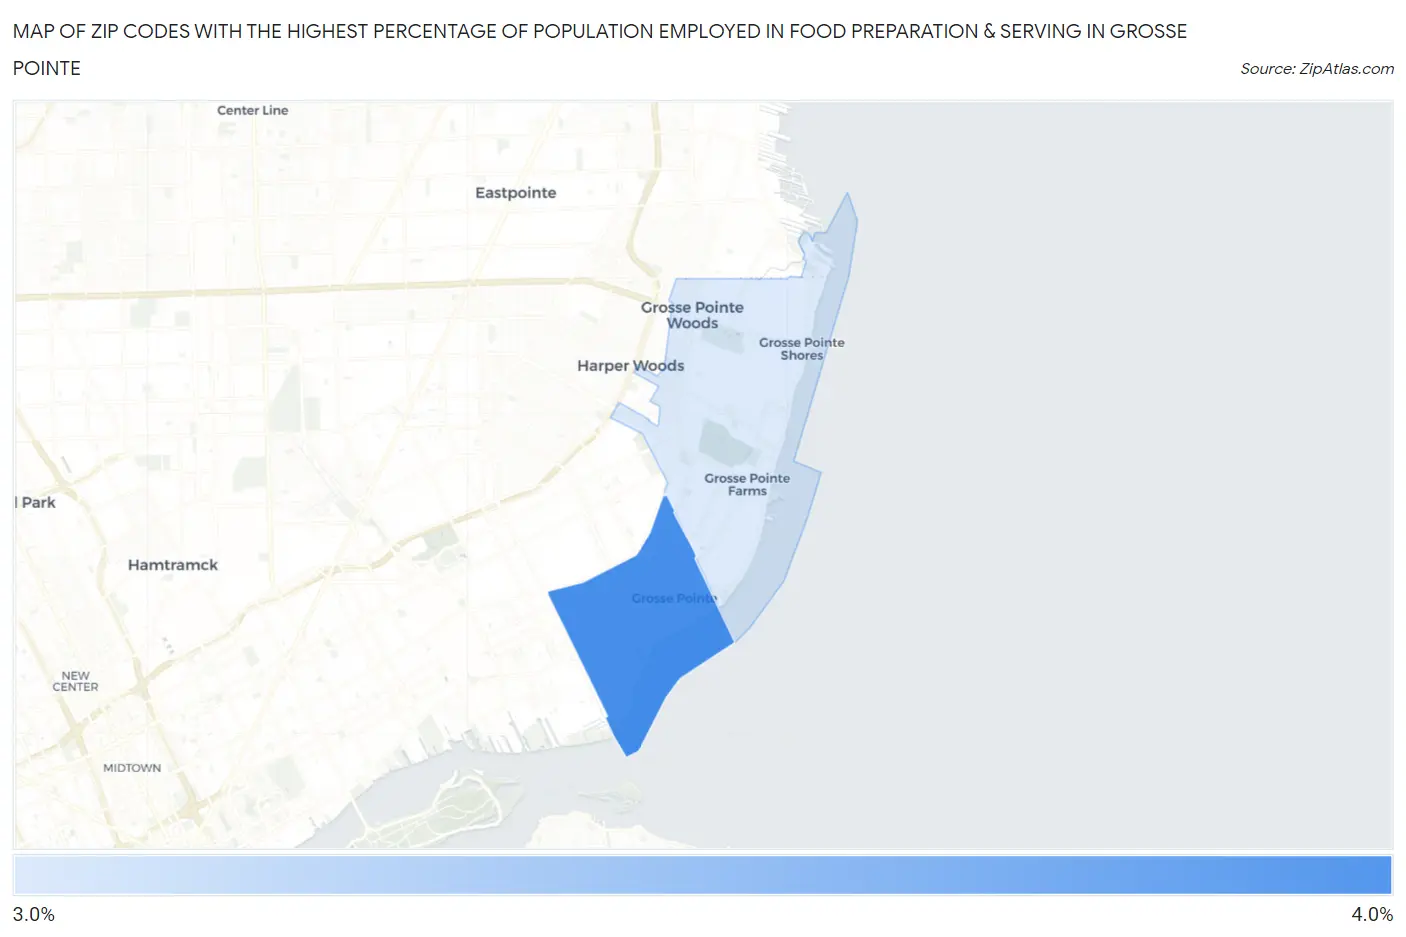
Map of Zip Codes with the Highest Percentage of Population Employed in Food Preparation & Serving in Grosse Pointe
3.1%
3.2%
Zip Codes with the Highest Percentage of Population Employed in Food Preparation & Serving in Grosse Pointe, MI
| Zip Code | % Employed | vs State | vs National | |
| 1. | 48230 | 3.2% | 5.7%(-2.49)#775 | 5.3%(-2.10)#20,547 |
| 2. | 48236 | 3.1% | 5.7%(-2.54)#784 | 5.3%(-2.16)#20,758 |
1
Common Questions
What are the Top Zip Codes with the Highest Percentage of Population Employed in Food Preparation & Serving in Grosse Pointe, MI?
Top Zip Codes with the Highest Percentage of Population Employed in Food Preparation & Serving in Grosse Pointe, MI are:
What zip code has the Highest Percentage of Population Employed in Food Preparation & Serving in Grosse Pointe, MI?
48230 has the Highest Percentage of Population Employed in Food Preparation & Serving in Grosse Pointe, MI with 3.2%.
What is the Percentage of Population Employed in Food Preparation & Serving in Grosse Pointe, MI?
Percentage of Population Employed in Food Preparation & Serving in Grosse Pointe is 2.0%.
What is the Percentage of Population Employed in Food Preparation & Serving in Michigan?
Percentage of Population Employed in Food Preparation & Serving in Michigan is 5.7%.
What is the Percentage of Population Employed in Food Preparation & Serving in the United States?
Percentage of Population Employed in Food Preparation & Serving in the United States is 5.3%.