Zip Codes with the Highest Percentage of Population Employed in Food Preparation & Serving in Kalamazoo, MI
RELATED REPORTS & OPTIONS
Food Preparation & Serving
Kalamazoo
Compare Zip Codes
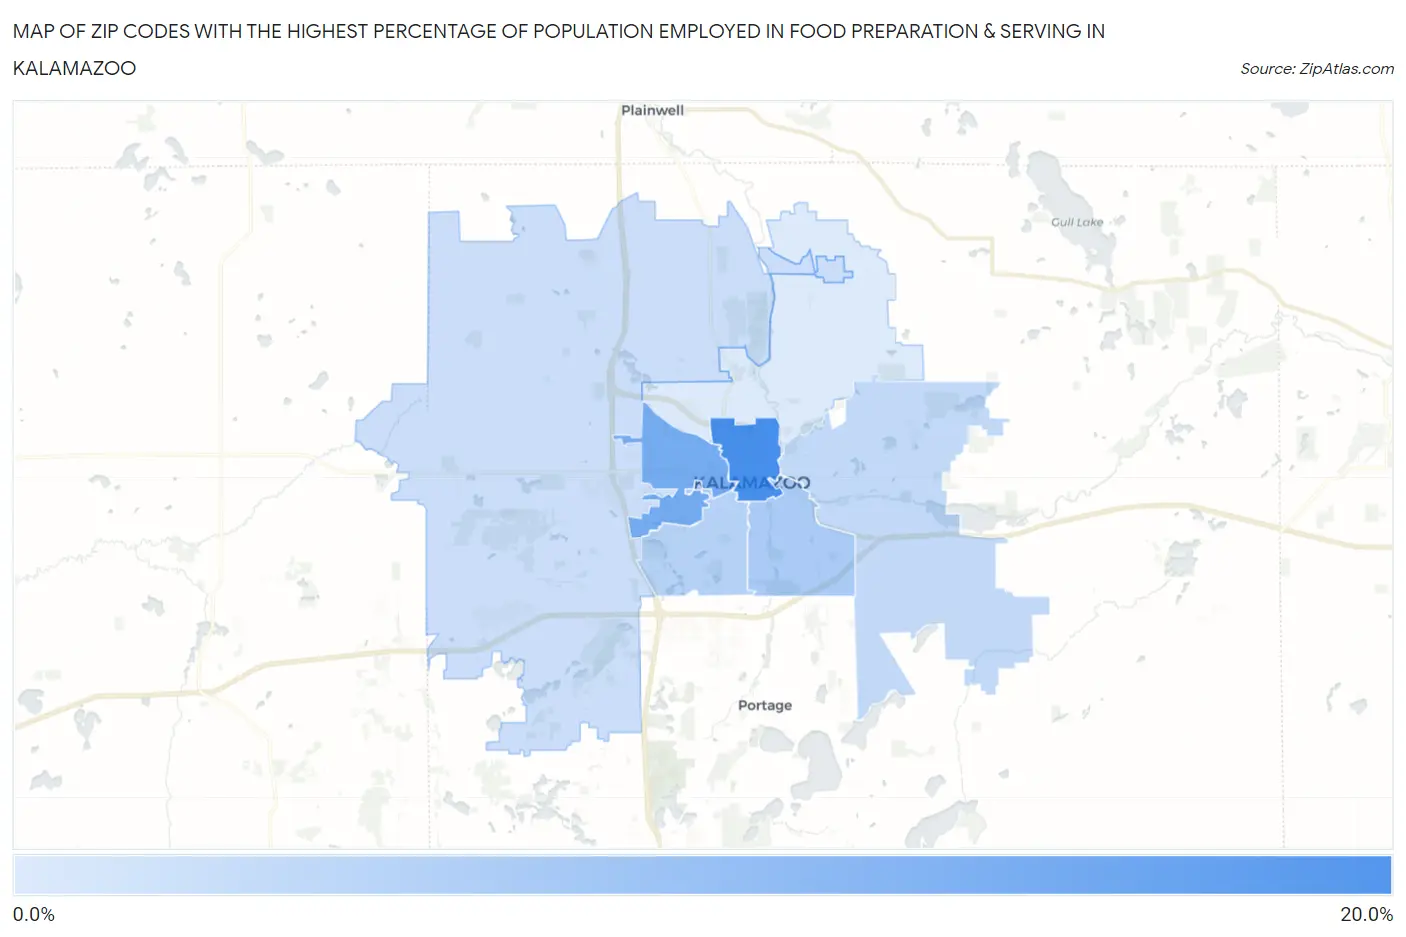
Map of Zip Codes with the Highest Percentage of Population Employed in Food Preparation & Serving in Kalamazoo
3.3%
19.8%
Zip Codes with the Highest Percentage of Population Employed in Food Preparation & Serving in Kalamazoo, MI
| Zip Code | % Employed | vs State | vs National | |
| 1. | 49007 | 19.8% | 5.7%(+14.2)#11 | 5.3%(+14.5)#517 |
| 2. | 49006 | 14.4% | 5.7%(+8.73)#26 | 5.3%(+9.11)#1,078 |
| 3. | 49001 | 8.7% | 5.7%(+3.00)#115 | 5.3%(+3.39)#3,881 |
| 4. | 49008 | 7.4% | 5.7%(+1.69)#194 | 5.3%(+2.08)#5,818 |
| 5. | 49048 | 6.1% | 5.7%(+0.473)#328 | 5.3%(+0.860)#8,891 |
| 6. | 49009 | 5.3% | 5.7%(-0.407)#448 | 5.3%(-0.021)#11,878 |
| 7. | 49004 | 3.3% | 5.7%(-2.35)#750 | 5.3%(-1.97)#19,984 |
1
Common Questions
What are the Top 5 Zip Codes with the Highest Percentage of Population Employed in Food Preparation & Serving in Kalamazoo, MI?
Top 5 Zip Codes with the Highest Percentage of Population Employed in Food Preparation & Serving in Kalamazoo, MI are:
What zip code has the Highest Percentage of Population Employed in Food Preparation & Serving in Kalamazoo, MI?
49007 has the Highest Percentage of Population Employed in Food Preparation & Serving in Kalamazoo, MI with 19.8%.
What is the Percentage of Population Employed in Food Preparation & Serving in Kalamazoo, MI?
Percentage of Population Employed in Food Preparation & Serving in Kalamazoo is 12.4%.
What is the Percentage of Population Employed in Food Preparation & Serving in Michigan?
Percentage of Population Employed in Food Preparation & Serving in Michigan is 5.7%.
What is the Percentage of Population Employed in Food Preparation & Serving in the United States?
Percentage of Population Employed in Food Preparation & Serving in the United States is 5.3%.