Zip Codes with the Highest Poverty Level Among Children Under the Age of 5 in Michigan
RELATED REPORTS & OPTIONS
Highest Poverty | Child 0-5
Michigan
Compare Zip Codes
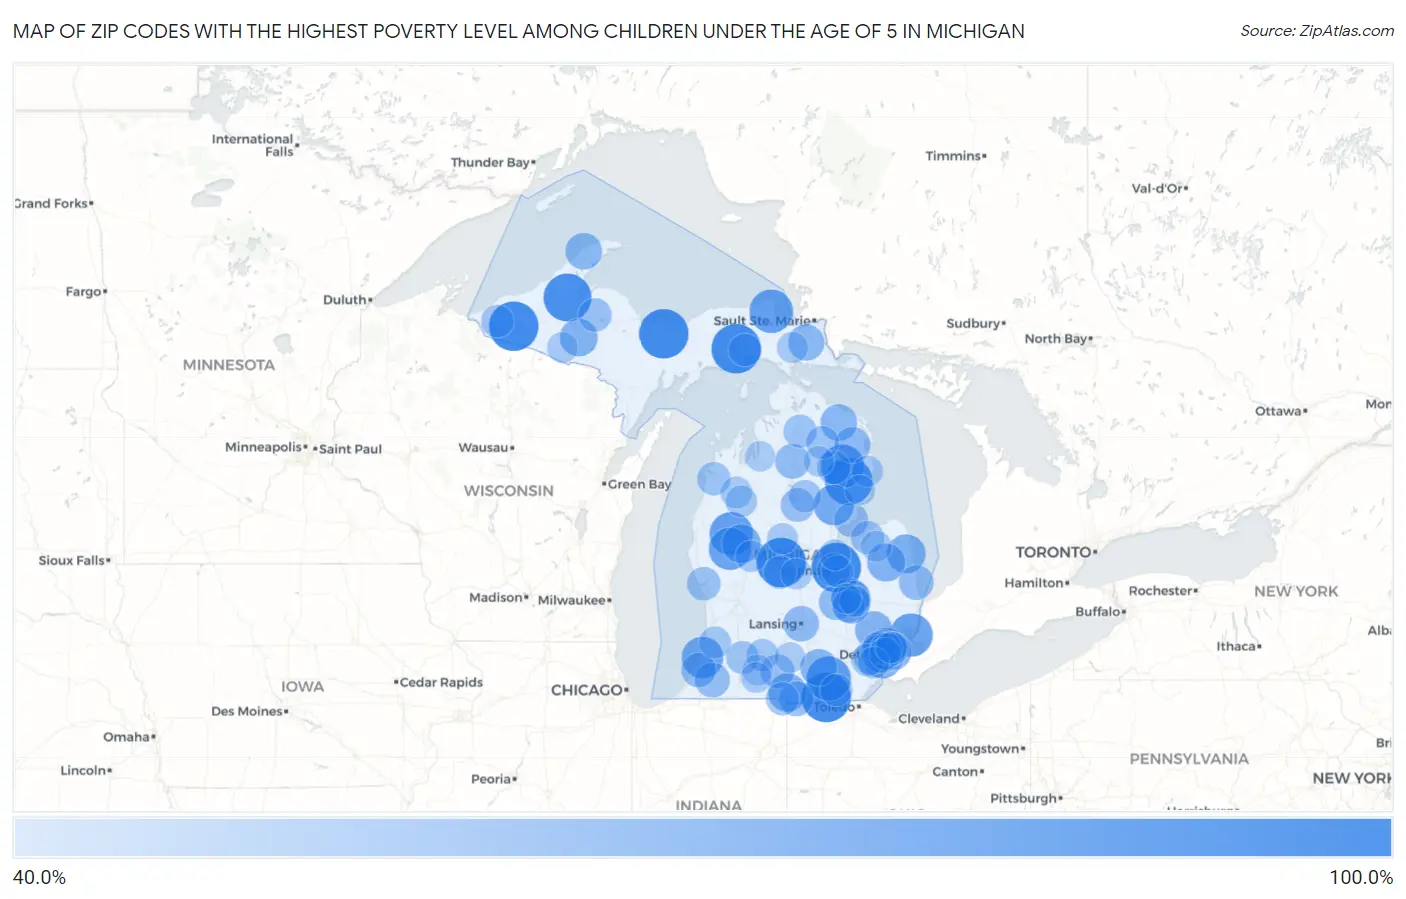
Map of Zip Codes with the Highest Poverty Level Among Children Under the Age of 5 in Michigan
40.0%
100.0%
Zip Codes with the Highest Poverty Level Among Children Under the Age of 5 in Michigan
| Zip Code | Child Poverty | vs State | vs National | |
| 1. | 49947 | 100.0% | 20.1%(+79.9)#1 | 18.1%(+81.9)#124 |
| 2. | 48724 | 100.0% | 20.1%(+79.9)#2 | 18.1%(+81.9)#134 |
| 3. | 49825 | 100.0% | 20.1%(+79.9)#3 | 18.1%(+81.9)#351 |
| 4. | 48896 | 100.0% | 20.1%(+79.9)#4 | 18.1%(+81.9)#360 |
| 5. | 49820 | 100.0% | 20.1%(+79.9)#5 | 18.1%(+81.9)#413 |
| 6. | 49289 | 100.0% | 20.1%(+79.9)#6 | 18.1%(+81.9)#521 |
| 7. | 49958 | 95.0% | 20.1%(+74.9)#7 | 18.1%(+76.9)#582 |
| 8. | 48737 | 93.5% | 20.1%(+73.4)#8 | 18.1%(+75.4)#595 |
| 9. | 49287 | 84.2% | 20.1%(+64.1)#9 | 18.1%(+66.1)#728 |
| 10. | 49768 | 81.2% | 20.1%(+61.1)#10 | 18.1%(+63.2)#787 |
| 11. | 48728 | 81.2% | 20.1%(+61.1)#11 | 18.1%(+63.2)#788 |
| 12. | 49642 | 80.6% | 20.1%(+60.5)#12 | 18.1%(+62.6)#797 |
| 13. | 48028 | 80.0% | 20.1%(+59.9)#13 | 18.1%(+61.9)#807 |
| 14. | 49312 | 77.8% | 20.1%(+57.7)#14 | 18.1%(+59.7)#880 |
| 15. | 49043 | 75.5% | 20.1%(+55.4)#15 | 18.1%(+57.4)#945 |
| 16. | 48756 | 72.0% | 20.1%(+51.9)#16 | 18.1%(+53.9)#1,089 |
| 17. | 48218 | 67.8% | 20.1%(+47.6)#17 | 18.1%(+49.7)#1,238 |
| 18. | 49338 | 67.0% | 20.1%(+46.9)#18 | 18.1%(+49.0)#1,268 |
| 19. | 48465 | 66.7% | 20.1%(+46.5)#19 | 18.1%(+48.6)#1,291 |
| 20. | 48234 | 66.3% | 20.1%(+46.1)#20 | 18.1%(+48.2)#1,332 |
| 21. | 48505 | 65.9% | 20.1%(+45.8)#21 | 18.1%(+47.9)#1,346 |
| 22. | 49274 | 65.2% | 20.1%(+45.1)#22 | 18.1%(+47.2)#1,370 |
| 23. | 48215 | 64.4% | 20.1%(+44.2)#23 | 18.1%(+46.3)#1,419 |
| 24. | 48426 | 64.3% | 20.1%(+44.2)#24 | 18.1%(+46.3)#1,420 |
| 25. | 49903 | 63.6% | 20.1%(+43.5)#25 | 18.1%(+45.6)#1,474 |
| 26. | 48342 | 62.4% | 20.1%(+42.2)#26 | 18.1%(+44.3)#1,542 |
| 27. | 48529 | 61.9% | 20.1%(+41.8)#27 | 18.1%(+43.8)#1,567 |
| 28. | 49261 | 60.7% | 20.1%(+40.6)#28 | 18.1%(+42.7)#1,641 |
| 29. | 49743 | 60.0% | 20.1%(+39.9)#29 | 18.1%(+41.9)#1,684 |
| 30. | 49805 | 60.0% | 20.1%(+39.9)#30 | 18.1%(+41.9)#1,691 |
| 31. | 49788 | 58.8% | 20.1%(+38.7)#31 | 18.1%(+40.7)#1,783 |
| 32. | 49744 | 57.9% | 20.1%(+37.8)#32 | 18.1%(+39.8)#1,839 |
| 33. | 48211 | 57.2% | 20.1%(+37.1)#33 | 18.1%(+39.2)#1,878 |
| 34. | 48933 | 56.7% | 20.1%(+36.5)#34 | 18.1%(+38.6)#1,934 |
| 35. | 48238 | 55.2% | 20.1%(+35.1)#35 | 18.1%(+37.2)#2,057 |
| 36. | 49733 | 54.8% | 20.1%(+34.7)#36 | 18.1%(+36.7)#2,081 |
| 37. | 48449 | 54.6% | 20.1%(+34.5)#37 | 18.1%(+36.5)#2,095 |
| 38. | 48203 | 54.6% | 20.1%(+34.4)#38 | 18.1%(+36.5)#2,097 |
| 39. | 49232 | 54.5% | 20.1%(+34.4)#39 | 18.1%(+36.4)#2,105 |
| 40. | 49047 | 54.4% | 20.1%(+34.3)#40 | 18.1%(+36.3)#2,112 |
| 41. | 49022 | 54.3% | 20.1%(+34.2)#41 | 18.1%(+36.2)#2,118 |
| 42. | 48450 | 54.0% | 20.1%(+33.9)#42 | 18.1%(+35.9)#2,146 |
| 43. | 48227 | 53.6% | 20.1%(+33.5)#43 | 18.1%(+35.5)#2,180 |
| 44. | 48210 | 53.2% | 20.1%(+33.1)#44 | 18.1%(+35.2)#2,230 |
| 45. | 48141 | 52.8% | 20.1%(+32.7)#45 | 18.1%(+34.7)#2,269 |
| 46. | 48204 | 52.6% | 20.1%(+32.5)#46 | 18.1%(+34.6)#2,288 |
| 47. | 48228 | 52.1% | 20.1%(+32.0)#47 | 18.1%(+34.0)#2,337 |
| 48. | 48703 | 51.9% | 20.1%(+31.8)#48 | 18.1%(+33.9)#2,348 |
| 49. | 49092 | 51.4% | 20.1%(+31.3)#49 | 18.1%(+33.4)#2,391 |
| 50. | 48651 | 51.1% | 20.1%(+31.0)#50 | 18.1%(+33.0)#2,416 |
| 51. | 48207 | 51.0% | 20.1%(+30.9)#51 | 18.1%(+33.0)#2,425 |
| 52. | 48201 | 50.7% | 20.1%(+30.6)#52 | 18.1%(+32.7)#2,450 |
| 53. | 48209 | 50.7% | 20.1%(+30.6)#53 | 18.1%(+32.6)#2,458 |
| 54. | 49440 | 50.6% | 20.1%(+30.4)#54 | 18.1%(+32.5)#2,477 |
| 55. | 48602 | 50.2% | 20.1%(+30.1)#55 | 18.1%(+32.2)#2,503 |
| 56. | 48506 | 50.2% | 20.1%(+30.1)#56 | 18.1%(+32.1)#2,509 |
| 57. | 48621 | 50.0% | 20.1%(+29.9)#57 | 18.1%(+31.9)#2,547 |
| 58. | 49861 | 50.0% | 20.1%(+29.9)#58 | 18.1%(+31.9)#2,564 |
| 59. | 49616 | 49.6% | 20.1%(+29.5)#59 | 18.1%(+31.6)#2,635 |
| 60. | 48213 | 49.5% | 20.1%(+29.4)#60 | 18.1%(+31.5)#2,641 |
| 61. | 49255 | 49.4% | 20.1%(+29.3)#61 | 18.1%(+31.3)#2,652 |
| 62. | 48720 | 49.4% | 20.1%(+29.2)#62 | 18.1%(+31.3)#2,656 |
| 63. | 49795 | 49.2% | 20.1%(+29.1)#63 | 18.1%(+31.1)#2,669 |
| 64. | 49709 | 49.1% | 20.1%(+29.0)#64 | 18.1%(+31.0)#2,682 |
| 65. | 48891 | 48.6% | 20.1%(+28.5)#65 | 18.1%(+30.5)#2,743 |
| 66. | 49007 | 48.3% | 20.1%(+28.2)#66 | 18.1%(+30.3)#2,774 |
| 67. | 49968 | 48.1% | 20.1%(+28.0)#67 | 18.1%(+30.1)#2,796 |
| 68. | 49827 | 48.1% | 20.1%(+27.9)#68 | 18.1%(+30.0)#2,806 |
| 69. | 48120 | 48.0% | 20.1%(+27.9)#69 | 18.1%(+30.0)#2,808 |
| 70. | 48224 | 47.7% | 20.1%(+27.6)#70 | 18.1%(+29.7)#2,841 |
| 71. | 48235 | 47.5% | 20.1%(+27.3)#71 | 18.1%(+29.4)#2,870 |
| 72. | 48507 | 47.4% | 20.1%(+27.3)#72 | 18.1%(+29.3)#2,879 |
| 73. | 48656 | 47.1% | 20.1%(+27.0)#73 | 18.1%(+29.0)#2,912 |
| 74. | 49268 | 46.9% | 20.1%(+26.8)#74 | 18.1%(+28.9)#2,928 |
| 75. | 48184 | 46.8% | 20.1%(+26.7)#75 | 18.1%(+28.8)#2,939 |
| 76. | 49037 | 46.5% | 20.1%(+26.4)#76 | 18.1%(+28.4)#2,980 |
| 77. | 48212 | 46.2% | 20.1%(+26.1)#77 | 18.1%(+28.2)#3,013 |
| 78. | 49450 | 45.9% | 20.1%(+25.7)#78 | 18.1%(+27.8)#3,073 |
| 79. | 48208 | 45.4% | 20.1%(+25.3)#79 | 18.1%(+27.4)#3,125 |
| 80. | 48601 | 45.1% | 20.1%(+24.9)#80 | 18.1%(+27.0)#3,173 |
| 81. | 49668 | 44.6% | 20.1%(+24.5)#81 | 18.1%(+26.5)#3,232 |
| 82. | 48180 | 44.6% | 20.1%(+24.5)#82 | 18.1%(+26.5)#3,236 |
| 83. | 49618 | 44.4% | 20.1%(+24.3)#83 | 18.1%(+26.4)#3,263 |
| 84. | 49346 | 44.4% | 20.1%(+24.2)#84 | 18.1%(+26.3)#3,287 |
| 85. | 48205 | 44.1% | 20.1%(+24.0)#85 | 18.1%(+26.1)#3,320 |
| 86. | 48740 | 43.7% | 20.1%(+23.6)#86 | 18.1%(+25.6)#3,391 |
| 87. | 48706 | 43.2% | 20.1%(+23.1)#87 | 18.1%(+25.2)#3,451 |
| 88. | 48801 | 43.0% | 20.1%(+22.9)#88 | 18.1%(+25.0)#3,476 |
| 89. | 48622 | 43.0% | 20.1%(+22.8)#89 | 18.1%(+24.9)#3,487 |
| 90. | 49780 | 42.9% | 20.1%(+22.7)#90 | 18.1%(+24.8)#3,503 |
| 91. | 48509 | 42.7% | 20.1%(+22.6)#91 | 18.1%(+24.6)#3,538 |
| 92. | 48754 | 42.6% | 20.1%(+22.4)#92 | 18.1%(+24.5)#3,560 |
| 93. | 49052 | 42.2% | 20.1%(+22.1)#93 | 18.1%(+24.2)#3,620 |
| 94. | 49066 | 42.1% | 20.1%(+22.0)#94 | 18.1%(+24.0)#3,645 |
| 95. | 49935 | 42.0% | 20.1%(+21.9)#95 | 18.1%(+23.9)#3,657 |
| 96. | 49224 | 41.3% | 20.1%(+21.2)#96 | 18.1%(+23.3)#3,770 |
| 97. | 49756 | 41.3% | 20.1%(+21.2)#97 | 18.1%(+23.3)#3,772 |
| 98. | 49676 | 40.9% | 20.1%(+20.8)#98 | 18.1%(+22.9)#3,847 |
| 99. | 48750 | 40.9% | 20.1%(+20.7)#99 | 18.1%(+22.8)#3,858 |
| 100. | 48504 | 40.8% | 20.1%(+20.7)#100 | 18.1%(+22.7)#3,868 |
Common Questions
What are the Top 10 Zip Codes with the Highest Poverty Level Among Children Under the Age of 5 in Michigan?
Top 10 Zip Codes with the Highest Poverty Level Among Children Under the Age of 5 in Michigan are:
What zip code has the Highest Poverty Level Among Children Under the Age of 5 in Michigan?
49947 has the Highest Poverty Level Among Children Under the Age of 5 in Michigan with 100.0%.
What is the Poverty Level Among Children Under the Age of 5 in the State of Michigan?
Poverty Level Among Children Under the Age of 5 in Michigan is 20.1%.
What is the Poverty Level Among Children Under the Age of 5 in the United States?
Poverty Level Among Children Under the Age of 5 in the United States is 18.1%.