Zip Codes with the Highest Percentage of Population Employed in Food Preparation & Serving in Southfield, MI
RELATED REPORTS & OPTIONS
Food Preparation & Serving
Southfield
Compare Zip Codes
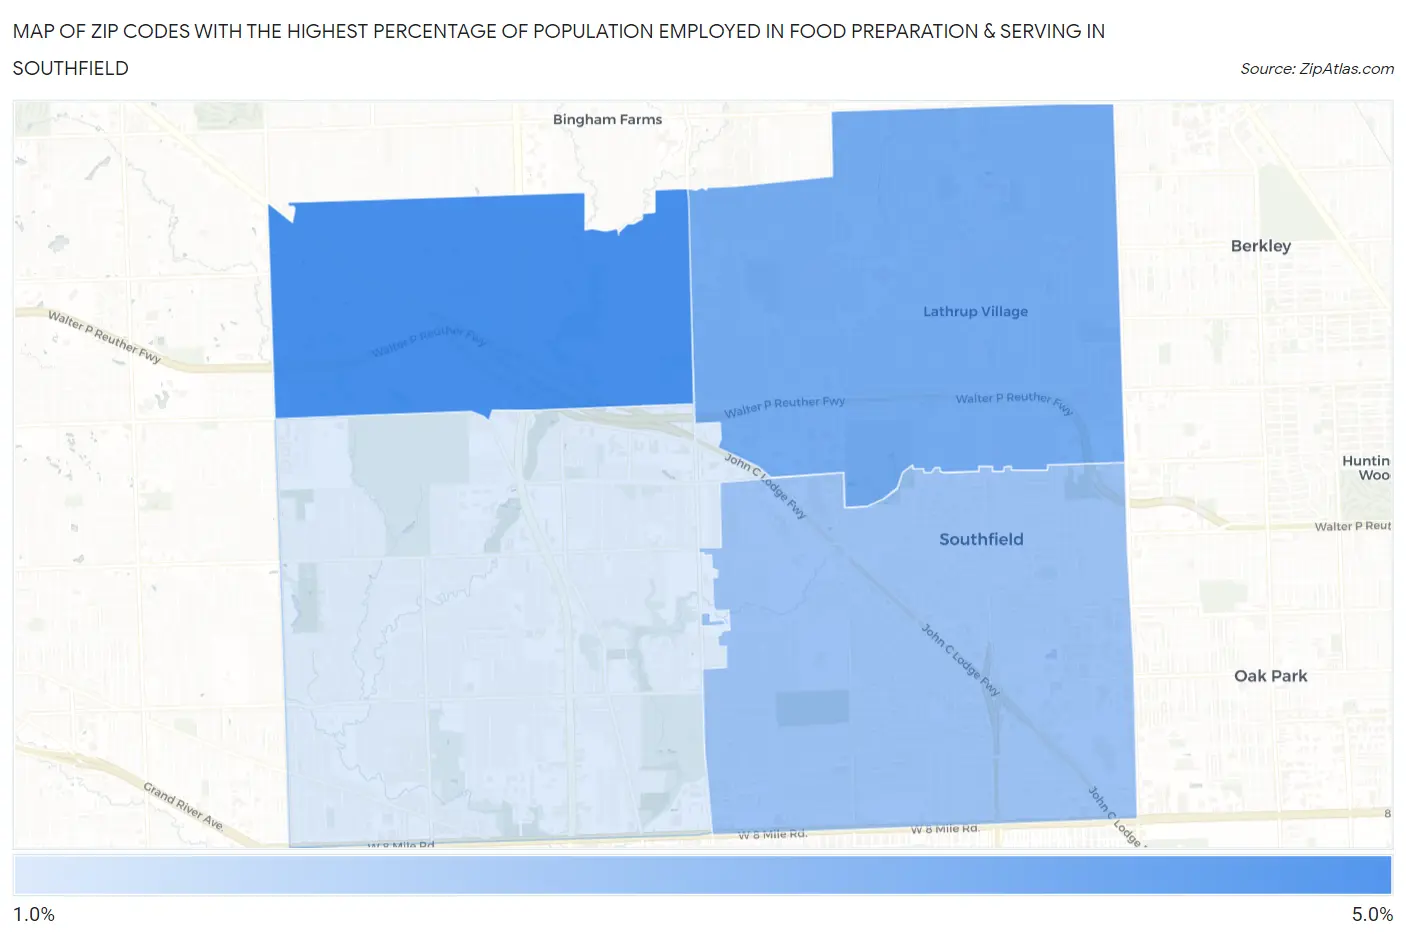
Map of Zip Codes with the Highest Percentage of Population Employed in Food Preparation & Serving in Southfield
1.1%
4.4%
Zip Codes with the Highest Percentage of Population Employed in Food Preparation & Serving in Southfield, MI
| Zip Code | % Employed | vs State | vs National | |
| 1. | 48034 | 4.4% | 5.7%(-1.31)#582 | 5.3%(-0.922)#15,586 |
| 2. | 48076 | 3.3% | 5.7%(-2.34)#748 | 5.3%(-1.95)#19,899 |
| 3. | 48075 | 2.5% | 5.7%(-3.17)#835 | 5.3%(-2.78)#23,144 |
| 4. | 48033 | 1.1% | 5.7%(-4.56)#908 | 5.3%(-4.18)#26,787 |
1
Common Questions
What are the Top 3 Zip Codes with the Highest Percentage of Population Employed in Food Preparation & Serving in Southfield, MI?
Top 3 Zip Codes with the Highest Percentage of Population Employed in Food Preparation & Serving in Southfield, MI are:
What zip code has the Highest Percentage of Population Employed in Food Preparation & Serving in Southfield, MI?
48034 has the Highest Percentage of Population Employed in Food Preparation & Serving in Southfield, MI with 4.4%.
What is the Percentage of Population Employed in Food Preparation & Serving in Southfield, MI?
Percentage of Population Employed in Food Preparation & Serving in Southfield is 2.8%.
What is the Percentage of Population Employed in Food Preparation & Serving in Michigan?
Percentage of Population Employed in Food Preparation & Serving in Michigan is 5.7%.
What is the Percentage of Population Employed in Food Preparation & Serving in the United States?
Percentage of Population Employed in Food Preparation & Serving in the United States is 5.3%.