Zip Codes with the Highest Percentage of Population Employed in Food Preparation & Serving in Muskegon, MI
RELATED REPORTS & OPTIONS
Food Preparation & Serving
Muskegon
Compare Zip Codes
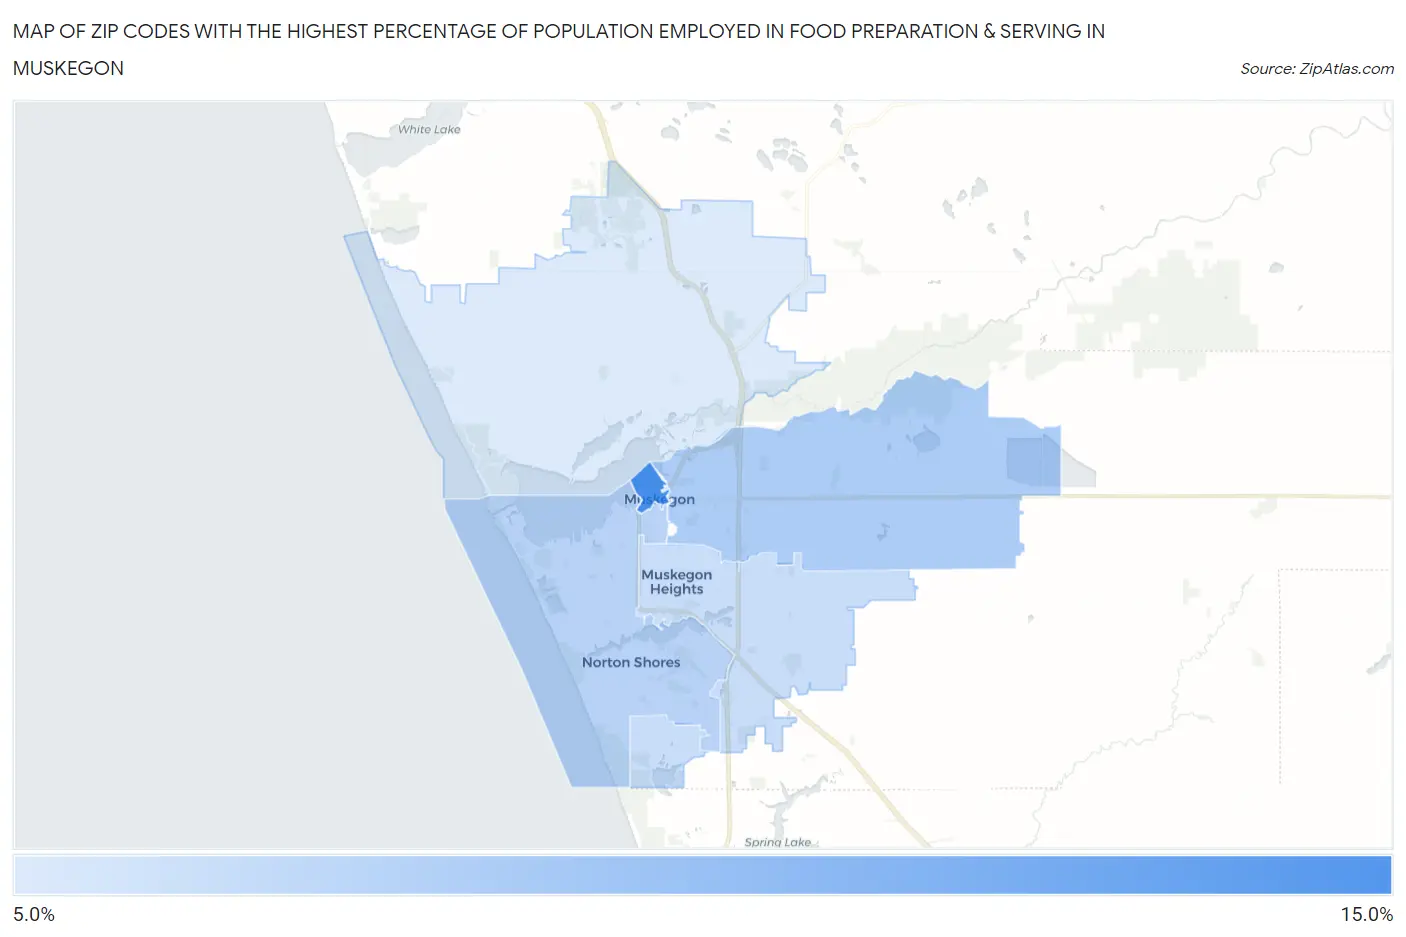
Map of Zip Codes with the Highest Percentage of Population Employed in Food Preparation & Serving in Muskegon
5.3%
14.8%
Zip Codes with the Highest Percentage of Population Employed in Food Preparation & Serving in Muskegon, MI
| Zip Code | % Employed | vs State | vs National | |
| 1. | 49440 | 14.8% | 5.7%(+9.10)#24 | 5.3%(+9.48)#1,013 |
| 2. | 49442 | 8.4% | 5.7%(+2.69)#133 | 5.3%(+3.07)#4,228 |
| 3. | 49441 | 7.5% | 5.7%(+1.84)#181 | 5.3%(+2.22)#5,550 |
| 4. | 49444 | 6.6% | 5.7%(+0.914)#273 | 5.3%(+1.30)#7,642 |
| 5. | 49445 | 5.3% | 5.7%(-0.346)#441 | 5.3%(+0.040)#11,664 |
1
Common Questions
What are the Top 3 Zip Codes with the Highest Percentage of Population Employed in Food Preparation & Serving in Muskegon, MI?
Top 3 Zip Codes with the Highest Percentage of Population Employed in Food Preparation & Serving in Muskegon, MI are:
What zip code has the Highest Percentage of Population Employed in Food Preparation & Serving in Muskegon, MI?
49440 has the Highest Percentage of Population Employed in Food Preparation & Serving in Muskegon, MI with 14.8%.
What is the Percentage of Population Employed in Food Preparation & Serving in Muskegon, MI?
Percentage of Population Employed in Food Preparation & Serving in Muskegon is 9.5%.
What is the Percentage of Population Employed in Food Preparation & Serving in Michigan?
Percentage of Population Employed in Food Preparation & Serving in Michigan is 5.7%.
What is the Percentage of Population Employed in Food Preparation & Serving in the United States?
Percentage of Population Employed in Food Preparation & Serving in the United States is 5.3%.