Zip Codes with the Highest Percentage of Self-Employed / Not Incorporated in Michigan
RELATED REPORTS & OPTIONS
Self-Employed / Not Incorporated
Michigan
Compare Zip Codes
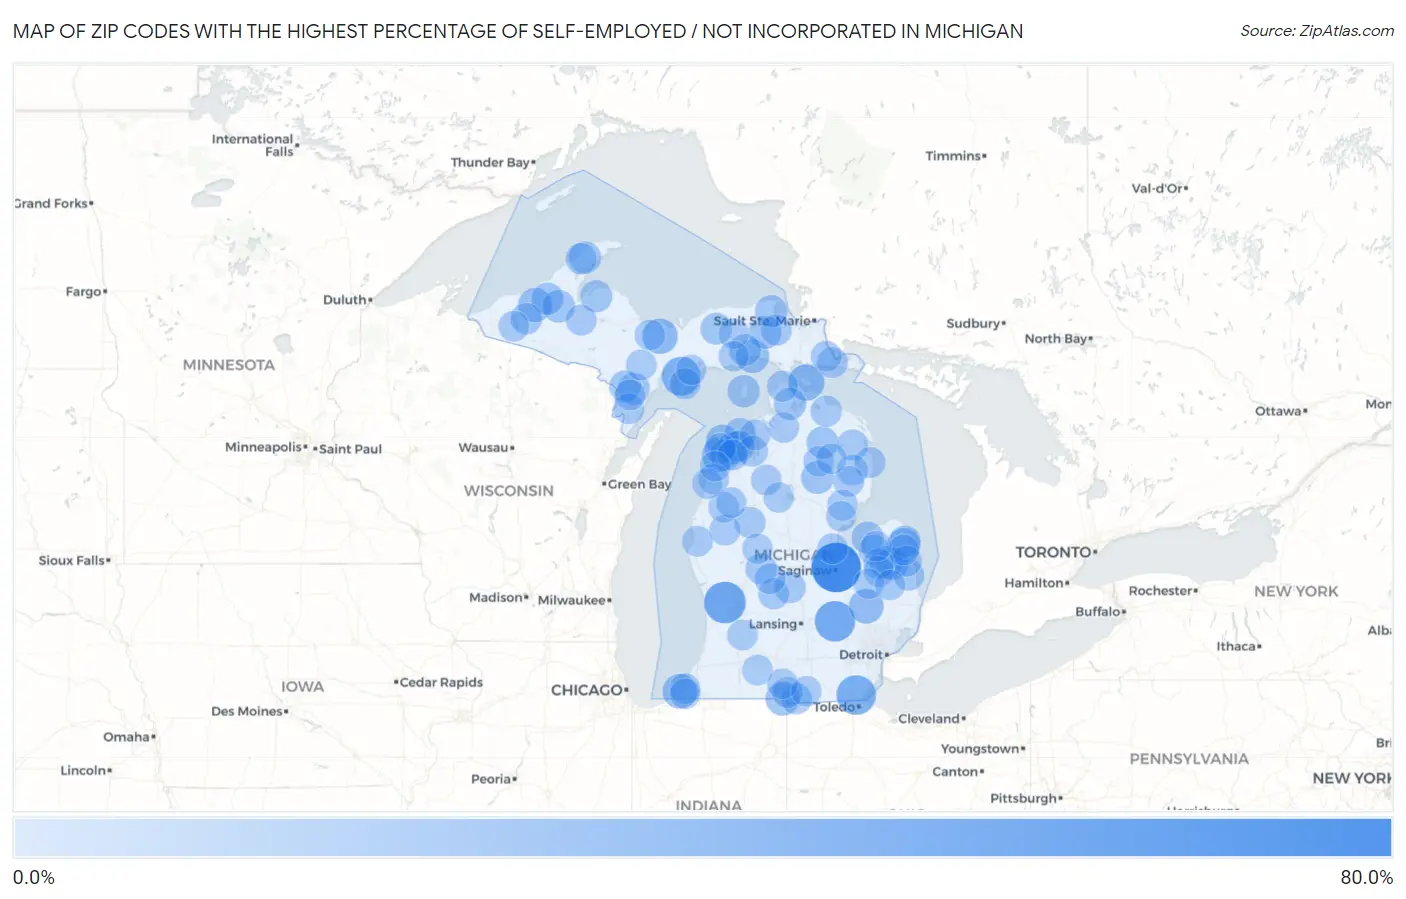
Map of Zip Codes with the Highest Percentage of Self-Employed / Not Incorporated in Michigan
0.0%
80.0%
Zip Codes with the Highest Percentage of Self-Employed / Not Incorporated in Michigan
| Zip Code | % Self-Employed / Not Incorporated | vs State | vs National | |
| 1. | 48724 | 78.5% | 4.9%(+73.6)#1 | 5.8%(+72.7)#77 |
| 2. | 49430 | 50.0% | 4.9%(+45.1)#2 | 5.8%(+44.2)#223 |
| 3. | 48816 | 45.7% | 4.9%(+40.7)#3 | 5.8%(+39.9)#290 |
| 4. | 48177 | 42.4% | 4.9%(+37.5)#4 | 5.8%(+36.6)#354 |
| 5. | 49864 | 40.0% | 4.9%(+35.1)#5 | 5.8%(+34.2)#408 |
| 6. | 49775 | 31.2% | 4.9%(+26.3)#6 | 5.8%(+25.4)#712 |
| 7. | 49826 | 28.1% | 4.9%(+23.2)#7 | 5.8%(+22.3)#885 |
| 8. | 49116 | 25.6% | 4.9%(+20.7)#8 | 5.8%(+19.8)#1,086 |
| 9. | 48440 | 25.6% | 4.9%(+20.7)#9 | 5.8%(+19.8)#1,090 |
| 10. | 49960 | 23.1% | 4.9%(+18.1)#10 | 5.8%(+17.3)#1,341 |
| 11. | 49255 | 22.3% | 4.9%(+17.4)#11 | 5.8%(+16.5)#1,435 |
| 12. | 49636 | 22.3% | 4.9%(+17.3)#12 | 5.8%(+16.5)#1,436 |
| 13. | 49762 | 21.8% | 4.9%(+16.9)#13 | 5.8%(+16.0)#1,502 |
| 14. | 48470 | 21.6% | 4.9%(+16.7)#14 | 5.8%(+15.8)#1,538 |
| 15. | 49654 | 21.1% | 4.9%(+16.2)#15 | 5.8%(+15.3)#1,617 |
| 16. | 48636 | 19.3% | 4.9%(+14.3)#16 | 5.8%(+13.5)#1,953 |
| 17. | 49748 | 18.4% | 4.9%(+13.5)#17 | 5.8%(+12.6)#2,195 |
| 18. | 48426 | 18.3% | 4.9%(+13.4)#18 | 5.8%(+12.5)#2,237 |
| 19. | 49952 | 18.0% | 4.9%(+13.1)#19 | 5.8%(+12.2)#2,313 |
| 20. | 49653 | 17.8% | 4.9%(+12.9)#20 | 5.8%(+12.0)#2,362 |
| 21. | 49948 | 17.7% | 4.9%(+12.8)#21 | 5.8%(+11.9)#2,395 |
| 22. | 49782 | 17.7% | 4.9%(+12.7)#22 | 5.8%(+11.9)#2,402 |
| 23. | 49917 | 17.3% | 4.9%(+12.4)#23 | 5.8%(+11.5)#2,522 |
| 24. | 49768 | 17.2% | 4.9%(+12.3)#24 | 5.8%(+11.4)#2,555 |
| 25. | 49716 | 17.2% | 4.9%(+12.3)#25 | 5.8%(+11.4)#2,578 |
| 26. | 48472 | 17.1% | 4.9%(+12.1)#26 | 5.8%(+11.2)#2,615 |
| 27. | 49962 | 16.7% | 4.9%(+11.7)#27 | 5.8%(+10.9)#2,747 |
| 28. | 48720 | 16.4% | 4.9%(+11.5)#28 | 5.8%(+10.6)#2,827 |
| 29. | 49886 | 16.3% | 4.9%(+11.4)#29 | 5.8%(+10.5)#2,865 |
| 30. | 49883 | 15.8% | 4.9%(+10.9)#30 | 5.8%(+9.97)#3,080 |
| 31. | 49709 | 15.8% | 4.9%(+10.8)#31 | 5.8%(+9.95)#3,092 |
| 32. | 49827 | 15.6% | 4.9%(+10.7)#32 | 5.8%(+9.79)#3,156 |
| 33. | 49670 | 15.0% | 4.9%(+10.0)#33 | 5.8%(+9.14)#3,441 |
| 34. | 49847 | 14.7% | 4.9%(+9.73)#34 | 5.8%(+8.85)#3,582 |
| 35. | 49925 | 14.7% | 4.9%(+9.73)#35 | 5.8%(+8.85)#3,585 |
| 36. | 49664 | 14.6% | 4.9%(+9.69)#36 | 5.8%(+8.81)#3,598 |
| 37. | 48856 | 14.5% | 4.9%(+9.56)#37 | 5.8%(+8.68)#3,657 |
| 38. | 48441 | 14.4% | 4.9%(+9.50)#38 | 5.8%(+8.62)#3,683 |
| 39. | 49942 | 14.3% | 4.9%(+9.35)#39 | 5.8%(+8.47)#3,758 |
| 40. | 49682 | 14.2% | 4.9%(+9.30)#40 | 5.8%(+8.41)#3,781 |
| 41. | 48850 | 14.0% | 4.9%(+9.03)#41 | 5.8%(+8.14)#3,918 |
| 42. | 48401 | 13.8% | 4.9%(+8.86)#42 | 5.8%(+7.98)#4,011 |
| 43. | 49759 | 13.8% | 4.9%(+8.85)#43 | 5.8%(+7.96)#4,026 |
| 44. | 49744 | 13.4% | 4.9%(+8.49)#44 | 5.8%(+7.61)#4,233 |
| 45. | 49232 | 13.4% | 4.9%(+8.48)#45 | 5.8%(+7.59)#4,243 |
| 46. | 49728 | 13.4% | 4.9%(+8.47)#46 | 5.8%(+7.59)#4,244 |
| 47. | 49630 | 13.3% | 4.9%(+8.41)#47 | 5.8%(+7.53)#4,278 |
| 48. | 48427 | 13.3% | 4.9%(+8.32)#48 | 5.8%(+7.44)#4,344 |
| 49. | 49655 | 13.1% | 4.9%(+8.14)#49 | 5.8%(+7.25)#4,475 |
| 50. | 49835 | 13.0% | 4.9%(+8.11)#50 | 5.8%(+7.23)#4,491 |
| 51. | 48834 | 13.0% | 4.9%(+8.04)#51 | 5.8%(+7.16)#4,546 |
| 52. | 48721 | 12.9% | 4.9%(+7.97)#52 | 5.8%(+7.09)#4,583 |
| 53. | 48888 | 12.8% | 4.9%(+7.89)#53 | 5.8%(+7.01)#4,645 |
| 54. | 49718 | 12.8% | 4.9%(+7.86)#54 | 5.8%(+6.98)#4,667 |
| 55. | 48705 | 12.8% | 4.9%(+7.83)#55 | 5.8%(+6.95)#4,679 |
| 56. | 49274 | 12.6% | 4.9%(+7.71)#56 | 5.8%(+6.82)#4,771 |
| 57. | 49629 | 12.6% | 4.9%(+7.65)#57 | 5.8%(+6.77)#4,817 |
| 58. | 48456 | 12.6% | 4.9%(+7.65)#58 | 5.8%(+6.77)#4,821 |
| 59. | 49621 | 12.5% | 4.9%(+7.58)#59 | 5.8%(+6.69)#4,873 |
| 60. | 49919 | 12.5% | 4.9%(+7.57)#60 | 5.8%(+6.68)#4,897 |
| 61. | 49304 | 12.4% | 4.9%(+7.51)#61 | 5.8%(+6.63)#4,939 |
| 62. | 49887 | 12.3% | 4.9%(+7.39)#62 | 5.8%(+6.50)#5,025 |
| 63. | 48631 | 12.3% | 4.9%(+7.37)#63 | 5.8%(+6.49)#5,037 |
| 64. | 49627 | 12.2% | 4.9%(+7.31)#64 | 5.8%(+6.43)#5,080 |
| 65. | 48737 | 12.2% | 4.9%(+7.30)#65 | 5.8%(+6.41)#5,091 |
| 66. | 49725 | 12.2% | 4.9%(+7.28)#66 | 5.8%(+6.39)#5,110 |
| 67. | 48770 | 12.2% | 4.9%(+7.23)#67 | 5.8%(+6.35)#5,151 |
| 68. | 49947 | 12.1% | 4.9%(+7.17)#68 | 5.8%(+6.29)#5,207 |
| 69. | 49616 | 12.0% | 4.9%(+7.04)#69 | 5.8%(+6.16)#5,309 |
| 70. | 49344 | 11.9% | 4.9%(+7.00)#70 | 5.8%(+6.12)#5,328 |
| 71. | 48735 | 11.9% | 4.9%(+6.97)#71 | 5.8%(+6.09)#5,352 |
| 72. | 49713 | 11.8% | 4.9%(+6.92)#72 | 5.8%(+6.03)#5,398 |
| 73. | 48729 | 11.8% | 4.9%(+6.91)#73 | 5.8%(+6.03)#5,399 |
| 74. | 49449 | 11.8% | 4.9%(+6.91)#74 | 5.8%(+6.03)#5,402 |
| 75. | 49863 | 11.8% | 4.9%(+6.91)#75 | 5.8%(+6.03)#5,406 |
| 76. | 49689 | 11.8% | 4.9%(+6.89)#76 | 5.8%(+6.01)#5,427 |
| 77. | 49633 | 11.8% | 4.9%(+6.86)#77 | 5.8%(+5.98)#5,456 |
| 78. | 49052 | 11.8% | 4.9%(+6.83)#78 | 5.8%(+5.95)#5,483 |
| 79. | 49736 | 11.7% | 4.9%(+6.79)#79 | 5.8%(+5.90)#5,525 |
| 80. | 49125 | 11.7% | 4.9%(+6.78)#80 | 5.8%(+5.90)#5,532 |
| 81. | 49818 | 11.6% | 4.9%(+6.71)#81 | 5.8%(+5.82)#5,589 |
| 82. | 49756 | 11.5% | 4.9%(+6.57)#82 | 5.8%(+5.69)#5,696 |
| 83. | 49638 | 11.5% | 4.9%(+6.55)#83 | 5.8%(+5.66)#5,727 |
| 84. | 48741 | 11.4% | 4.9%(+6.47)#84 | 5.8%(+5.59)#5,815 |
| 85. | 49128 | 11.4% | 4.9%(+6.42)#85 | 5.8%(+5.54)#5,846 |
| 86. | 48754 | 11.3% | 4.9%(+6.38)#86 | 5.8%(+5.50)#5,890 |
| 87. | 49613 | 11.3% | 4.9%(+6.37)#87 | 5.8%(+5.48)#5,905 |
| 88. | 49082 | 11.3% | 4.9%(+6.34)#88 | 5.8%(+5.45)#5,926 |
| 89. | 48619 | 11.2% | 4.9%(+6.27)#89 | 5.8%(+5.39)#5,995 |
| 90. | 49853 | 11.2% | 4.9%(+6.22)#90 | 5.8%(+5.34)#6,052 |
| 91. | 49885 | 11.0% | 4.9%(+6.11)#91 | 5.8%(+5.23)#6,160 |
| 92. | 48766 | 11.0% | 4.9%(+6.09)#92 | 5.8%(+5.21)#6,183 |
| 93. | 48435 | 11.0% | 4.9%(+6.08)#93 | 5.8%(+5.20)#6,197 |
| 94. | 49271 | 11.0% | 4.9%(+6.07)#94 | 5.8%(+5.19)#6,207 |
| 95. | 49342 | 10.9% | 4.9%(+5.94)#95 | 5.8%(+5.05)#6,332 |
| 96. | 49667 | 10.8% | 4.9%(+5.92)#96 | 5.8%(+5.03)#6,352 |
| 97. | 49640 | 10.8% | 4.9%(+5.90)#97 | 5.8%(+5.02)#6,369 |
| 98. | 48416 | 10.8% | 4.9%(+5.89)#98 | 5.8%(+5.01)#6,391 |
| 99. | 49817 | 10.8% | 4.9%(+5.82)#99 | 5.8%(+4.94)#6,480 |
| 100. | 49838 | 10.8% | 4.9%(+5.82)#100 | 5.8%(+4.94)#6,485 |
Common Questions
What are the Top 10 Zip Codes with the Highest Percentage of Self-Employed / Not Incorporated in Michigan?
Top 10 Zip Codes with the Highest Percentage of Self-Employed / Not Incorporated in Michigan are:
What zip code has the Highest Percentage of Self-Employed / Not Incorporated in Michigan?
48724 has the Highest Percentage of Self-Employed / Not Incorporated in Michigan with 78.5%.
What is the Percentage of Self-Employed / Not Incorporated in the State of Michigan?
Percentage of Self-Employed / Not Incorporated in Michigan is 4.9%.
What is the Percentage of Self-Employed / Not Incorporated in the United States?
Percentage of Self-Employed / Not Incorporated in the United States is 5.8%.