Zip Codes with the Highest Percentage of Population Employed in Food Preparation & Serving in Washington, MI
RELATED REPORTS & OPTIONS
Food Preparation & Serving
Washington
Compare Zip Codes
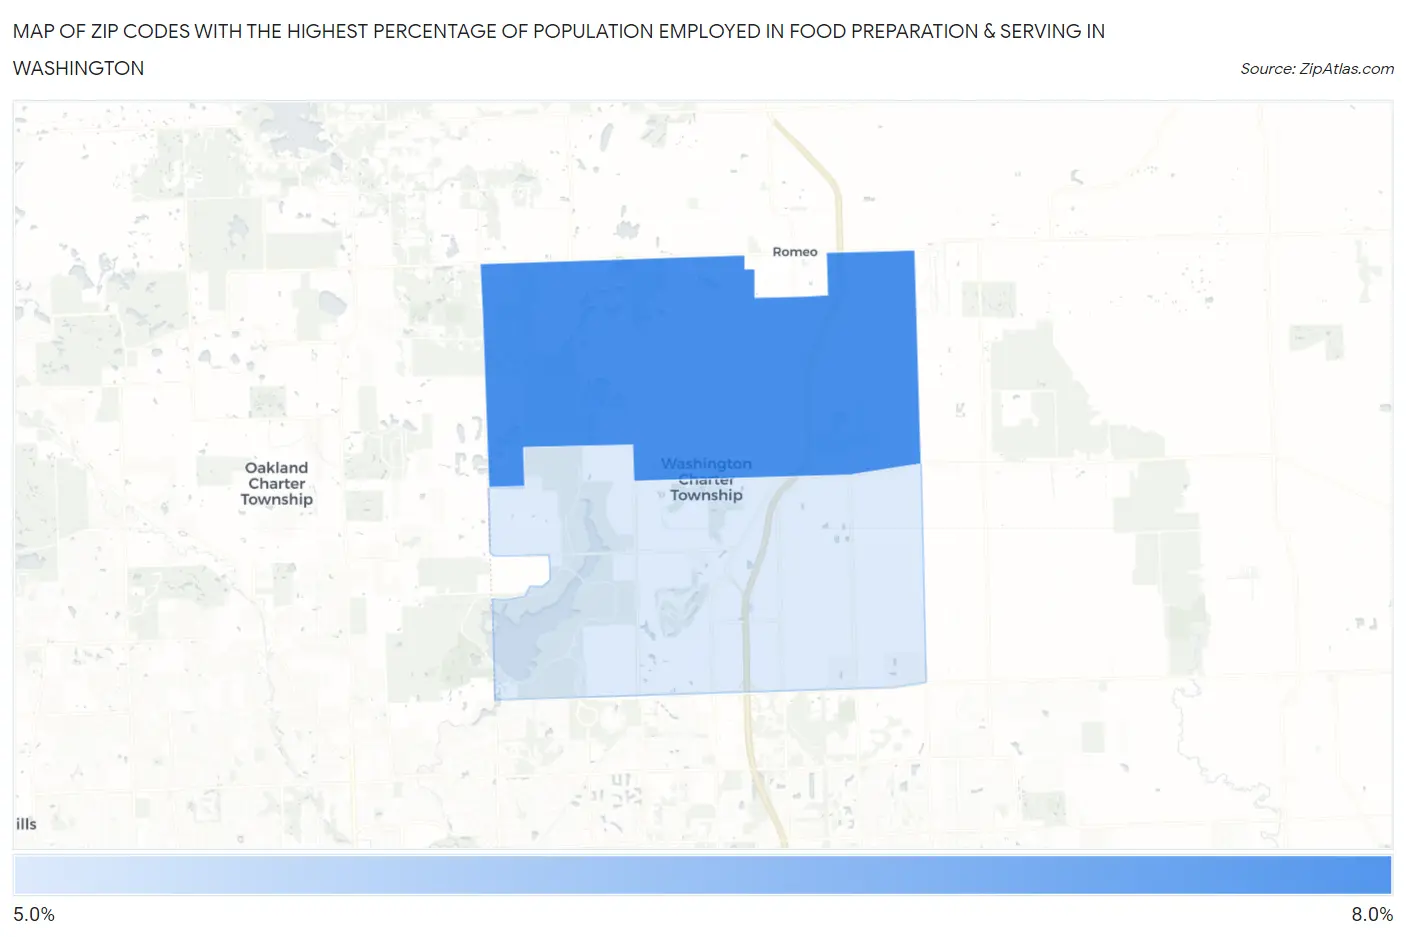
Map of Zip Codes with the Highest Percentage of Population Employed in Food Preparation & Serving in Washington
5.1%
6.3%
Zip Codes with the Highest Percentage of Population Employed in Food Preparation & Serving in Washington, MI
| Zip Code | % Employed | vs State | vs National | |
| 1. | 48095 | 6.3% | 5.7%(+0.675)#295 | 5.3%(+1.06)#8,296 |
| 2. | 48094 | 5.1% | 5.7%(-0.607)#478 | 5.3%(-0.220)#12,667 |
1
Common Questions
What are the Top Zip Codes with the Highest Percentage of Population Employed in Food Preparation & Serving in Washington, MI?
Top Zip Codes with the Highest Percentage of Population Employed in Food Preparation & Serving in Washington, MI are:
What zip code has the Highest Percentage of Population Employed in Food Preparation & Serving in Washington, MI?
48095 has the Highest Percentage of Population Employed in Food Preparation & Serving in Washington, MI with 6.3%.
What is the Percentage of Population Employed in Food Preparation & Serving in Michigan?
Percentage of Population Employed in Food Preparation & Serving in Michigan is 5.7%.
What is the Percentage of Population Employed in Food Preparation & Serving in the United States?
Percentage of Population Employed in Food Preparation & Serving in the United States is 5.3%.