Zip Codes with the Highest Percentage of Population Employed in Food Preparation & Serving in Detroit, MI
RELATED REPORTS & OPTIONS
Food Preparation & Serving
Detroit
Compare Zip Codes
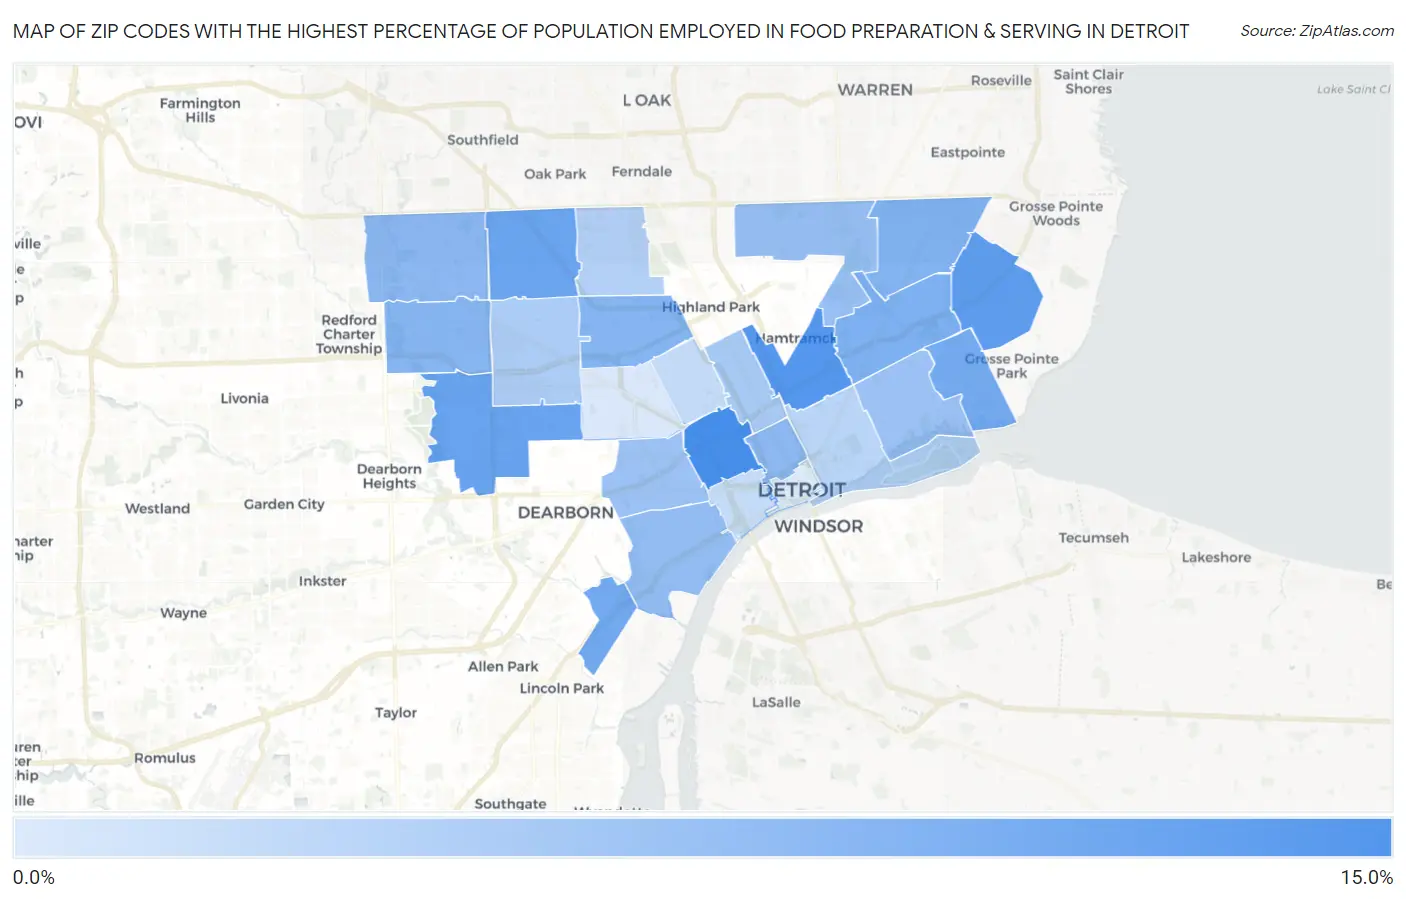
Map of Zip Codes with the Highest Percentage of Population Employed in Food Preparation & Serving in Detroit
2.9%
10.2%
Zip Codes with the Highest Percentage of Population Employed in Food Preparation & Serving in Detroit, MI
| Zip Code | % Employed | vs State | vs National | |
| 1. | 48208 | 10.2% | 5.7%(+4.55)#64 | 5.3%(+4.94)#2,470 |
| 2. | 48211 | 9.5% | 5.7%(+3.80)#85 | 5.3%(+4.18)#3,082 |
| 3. | 48224 | 9.0% | 5.7%(+3.28)#103 | 5.3%(+3.67)#3,571 |
| 4. | 48228 | 8.5% | 5.7%(+2.85)#122 | 5.3%(+3.24)#4,046 |
| 5. | 48235 | 8.4% | 5.7%(+2.69)#131 | 5.3%(+3.08)#4,216 |
| 6. | 48217 | 8.0% | 5.7%(+2.38)#146 | 5.3%(+2.76)#4,654 |
| 7. | 48215 | 7.9% | 5.7%(+2.24)#156 | 5.3%(+2.63)#4,862 |
| 8. | 48213 | 7.5% | 5.7%(+1.83)#182 | 5.3%(+2.22)#5,561 |
| 9. | 48205 | 7.2% | 5.7%(+1.53)#207 | 5.3%(+1.92)#6,123 |
| 10. | 48238 | 7.1% | 5.7%(+1.44)#221 | 5.3%(+1.83)#6,316 |
| 11. | 48223 | 7.1% | 5.7%(+1.39)#226 | 5.3%(+1.78)#6,416 |
| 12. | 48219 | 6.8% | 5.7%(+1.16)#241 | 5.3%(+1.54)#6,989 |
| 13. | 48201 | 6.8% | 5.7%(+1.10)#250 | 5.3%(+1.48)#7,140 |
| 14. | 48209 | 6.5% | 5.7%(+0.794)#285 | 5.3%(+1.18)#7,964 |
| 15. | 48234 | 6.2% | 5.7%(+0.508)#322 | 5.3%(+0.895)#8,795 |
| 16. | 48210 | 6.2% | 5.7%(+0.481)#327 | 5.3%(+0.868)#8,865 |
| 17. | 48214 | 6.1% | 5.7%(+0.404)#337 | 5.3%(+0.791)#9,098 |
| 18. | 48202 | 5.4% | 5.7%(-0.226)#429 | 5.3%(+0.161)#11,236 |
| 19. | 48227 | 5.2% | 5.7%(-0.455)#459 | 5.3%(-0.068)#12,072 |
| 20. | 48221 | 4.9% | 5.7%(-0.746)#506 | 5.3%(-0.359)#13,236 |
| 21. | 48207 | 4.6% | 5.7%(-1.11)#549 | 5.3%(-0.722)#14,771 |
| 22. | 48206 | 4.1% | 5.7%(-1.57)#638 | 5.3%(-1.18)#16,674 |
| 23. | 48216 | 4.0% | 5.7%(-1.68)#660 | 5.3%(-1.29)#17,165 |
| 24. | 48204 | 3.0% | 5.7%(-2.66)#793 | 5.3%(-2.28)#21,227 |
| 25. | 48226 | 2.9% | 5.7%(-2.74)#797 | 5.3%(-2.35)#21,510 |
1
Common Questions
What are the Top 10 Zip Codes with the Highest Percentage of Population Employed in Food Preparation & Serving in Detroit, MI?
Top 10 Zip Codes with the Highest Percentage of Population Employed in Food Preparation & Serving in Detroit, MI are:
What zip code has the Highest Percentage of Population Employed in Food Preparation & Serving in Detroit, MI?
48208 has the Highest Percentage of Population Employed in Food Preparation & Serving in Detroit, MI with 10.2%.
What is the Percentage of Population Employed in Food Preparation & Serving in Detroit, MI?
Percentage of Population Employed in Food Preparation & Serving in Detroit is 6.8%.
What is the Percentage of Population Employed in Food Preparation & Serving in Michigan?
Percentage of Population Employed in Food Preparation & Serving in Michigan is 5.7%.
What is the Percentage of Population Employed in Food Preparation & Serving in the United States?
Percentage of Population Employed in Food Preparation & Serving in the United States is 5.3%.