Zip Codes with the Highest Percentage of Population Employed in Food Preparation & Serving in Flint, MI
RELATED REPORTS & OPTIONS
Food Preparation & Serving
Flint
Compare Zip Codes
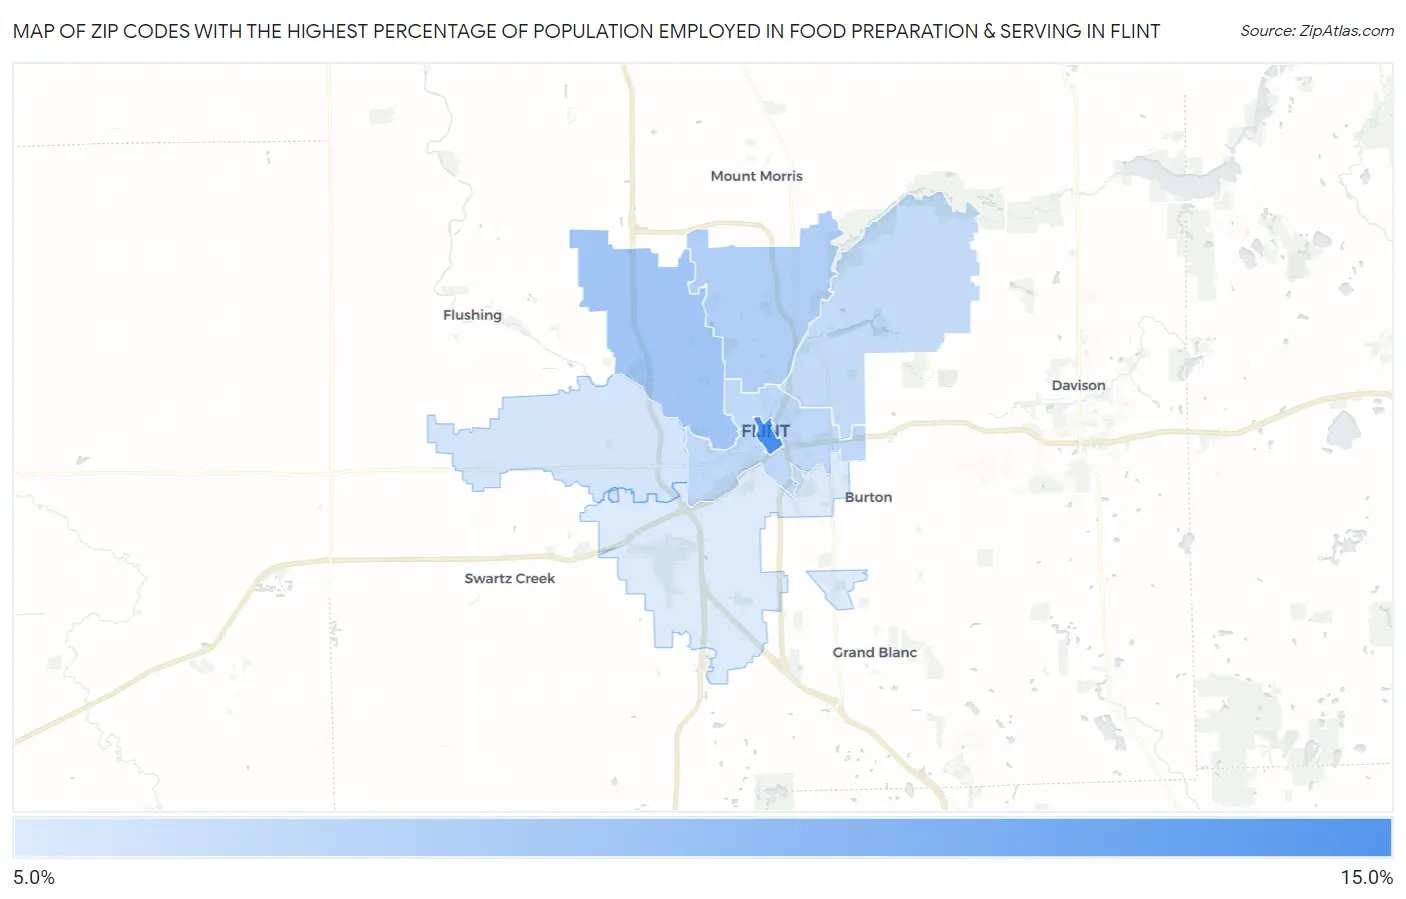
Map of Zip Codes with the Highest Percentage of Population Employed in Food Preparation & Serving in Flint
5.8%
11.7%
Zip Codes with the Highest Percentage of Population Employed in Food Preparation & Serving in Flint, MI
| Zip Code | % Employed | vs State | vs National | |
| 1. | 48502 | 11.7% | 5.7%(+6.04)#41 | 5.3%(+6.42)#1,772 |
| 2. | 48504 | 8.1% | 5.7%(+2.42)#145 | 5.3%(+2.81)#4,577 |
| 3. | 48505 | 7.5% | 5.7%(+1.80)#186 | 5.3%(+2.18)#5,615 |
| 4. | 48503 | 7.0% | 5.7%(+1.28)#236 | 5.3%(+1.67)#6,671 |
| 5. | 48506 | 6.8% | 5.7%(+1.11)#248 | 5.3%(+1.50)#7,102 |
| 6. | 48532 | 6.1% | 5.7%(+0.407)#336 | 5.3%(+0.793)#9,086 |
| 7. | 48507 | 5.8% | 5.7%(+0.088)#379 | 5.3%(+0.475)#10,150 |
1
Common Questions
What are the Top 5 Zip Codes with the Highest Percentage of Population Employed in Food Preparation & Serving in Flint, MI?
Top 5 Zip Codes with the Highest Percentage of Population Employed in Food Preparation & Serving in Flint, MI are:
What zip code has the Highest Percentage of Population Employed in Food Preparation & Serving in Flint, MI?
48502 has the Highest Percentage of Population Employed in Food Preparation & Serving in Flint, MI with 11.7%.
What is the Percentage of Population Employed in Food Preparation & Serving in Flint, MI?
Percentage of Population Employed in Food Preparation & Serving in Flint is 6.5%.
What is the Percentage of Population Employed in Food Preparation & Serving in Michigan?
Percentage of Population Employed in Food Preparation & Serving in Michigan is 5.7%.
What is the Percentage of Population Employed in Food Preparation & Serving in the United States?
Percentage of Population Employed in Food Preparation & Serving in the United States is 5.3%.