Andrews, FL Map & Demographics
Andrews Map
Andrews Overview
$26,139
PER CAPITA INCOME
$34,594
AVG FAMILY INCOME
$34,636
AVG HOUSEHOLD INCOME
25.9%
WAGE / INCOME GAP [ % ]
74.1¢/ $1
WAGE / INCOME GAP [ $ ]
0.40
INEQUALITY / GINI INDEX
944
TOTAL POPULATION
392
MALE POPULATION
552
FEMALE POPULATION
71.01
MALES / 100 FEMALES
140.82
FEMALES / 100 MALES
44.0
MEDIAN AGE
2.9
AVG FAMILY SIZE
2.8
AVG HOUSEHOLD SIZE
518
LABOR FORCE [ PEOPLE ]
62.7%
PERCENT IN LABOR FORCE
Income in Andrews
Income Overview in Andrews
Per Capita Income in Andrews is $26,139, while median incomes of families and households are $34,594 and $34,636 respectively.
| Characteristic | Number | Measure |
| Per Capita Income | 944 | $26,139 |
| Median Family Income | 317 | $34,594 |
| Mean Family Income | 317 | $58,528 |
| Median Household Income | 343 | $34,636 |
| Mean Household Income | 343 | $62,116 |
| Income Deficit | 317 | $0 |
| Wage / Income Gap (%) | 944 | 25.94% |
| Wage / Income Gap ($) | 944 | 74.06¢ per $1 |
| Gini / Inequality Index | 944 | 0.40 |
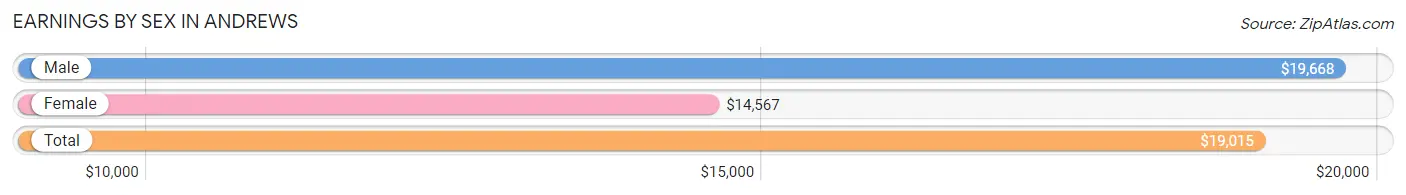
Earnings by Sex in Andrews
Average Earnings in Andrews are $19,015, $19,668 for men and $14,567 for women, a difference of 25.9%.
| Sex | Number | Average Earnings |
| Male | 307 (47.0%) | $19,668 |
| Female | 346 (53.0%) | $14,567 |
| Total | 653 (100.0%) | $19,015 |
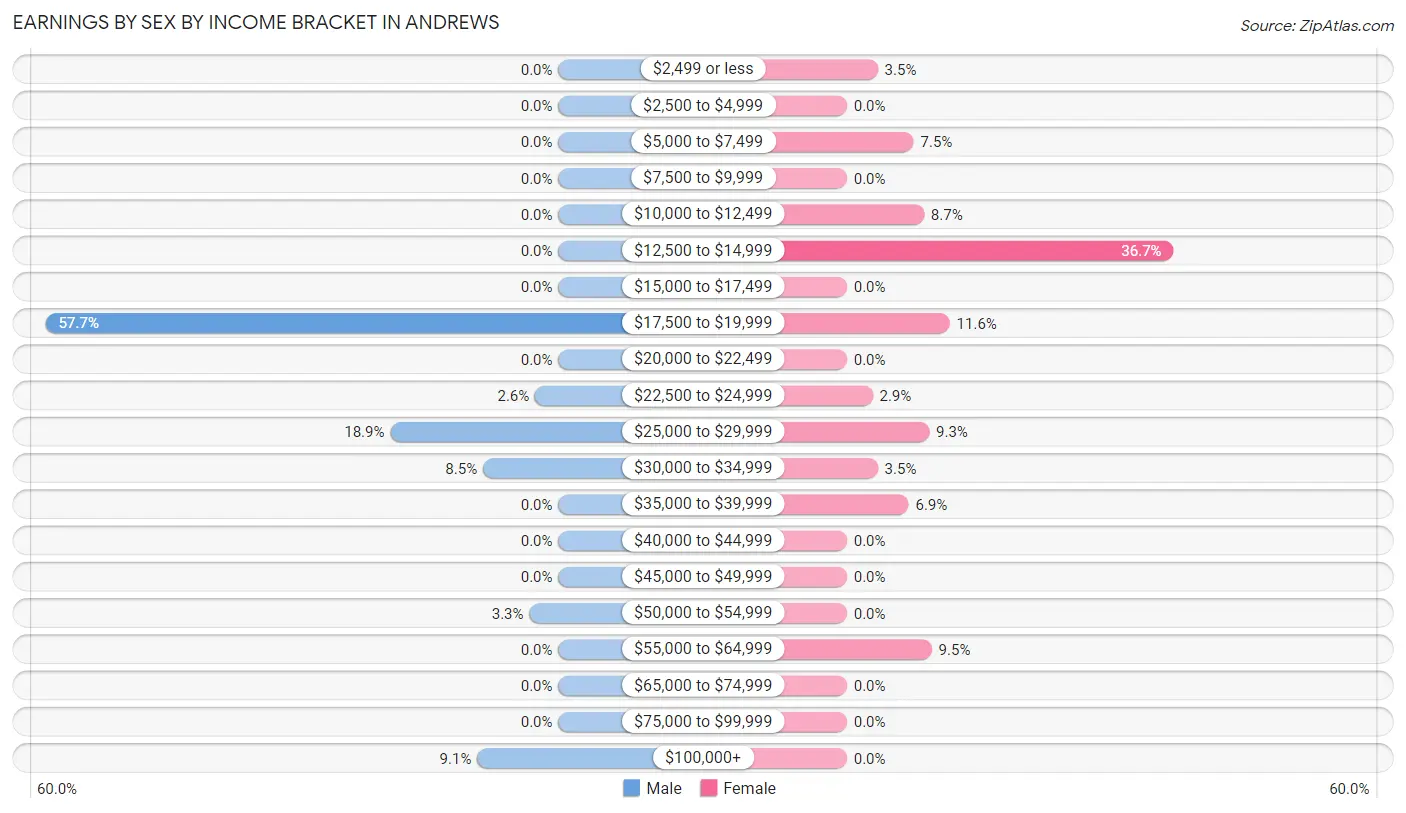
Earnings by Sex by Income Bracket in Andrews
The most common earnings brackets in Andrews are $17,500 to $19,999 for men (177 | 57.7%) and $12,500 to $14,999 for women (127 | 36.7%).
| Income | Male | Female |
| $2,499 or less | 0 (0.0%) | 12 (3.5%) |
| $2,500 to $4,999 | 0 (0.0%) | 0 (0.0%) |
| $5,000 to $7,499 | 0 (0.0%) | 26 (7.5%) |
| $7,500 to $9,999 | 0 (0.0%) | 0 (0.0%) |
| $10,000 to $12,499 | 0 (0.0%) | 30 (8.7%) |
| $12,500 to $14,999 | 0 (0.0%) | 127 (36.7%) |
| $15,000 to $17,499 | 0 (0.0%) | 0 (0.0%) |
| $17,500 to $19,999 | 177 (57.7%) | 40 (11.6%) |
| $20,000 to $22,499 | 0 (0.0%) | 0 (0.0%) |
| $22,500 to $24,999 | 8 (2.6%) | 10 (2.9%) |
| $25,000 to $29,999 | 58 (18.9%) | 32 (9.2%) |
| $30,000 to $34,999 | 26 (8.5%) | 12 (3.5%) |
| $35,000 to $39,999 | 0 (0.0%) | 24 (6.9%) |
| $40,000 to $44,999 | 0 (0.0%) | 0 (0.0%) |
| $45,000 to $49,999 | 0 (0.0%) | 0 (0.0%) |
| $50,000 to $54,999 | 10 (3.3%) | 0 (0.0%) |
| $55,000 to $64,999 | 0 (0.0%) | 33 (9.5%) |
| $65,000 to $74,999 | 0 (0.0%) | 0 (0.0%) |
| $75,000 to $99,999 | 0 (0.0%) | 0 (0.0%) |
| $100,000+ | 28 (9.1%) | 0 (0.0%) |
| Total | 307 (100.0%) | 346 (100.0%) |
Earnings by Sex by Educational Attainment in Andrews
| Educational Attainment | Male Income | Female Income |
| Less than High School | - | - |
| High School Diploma | - | - |
| College or Associate's Degree | - | - |
| Bachelor's Degree | - | - |
| Graduate Degree | - | - |
| Total | $19,258 | $14,547 |
Family Income in Andrews
Family Income Brackets in Andrews
According to the Andrews family income data, there are 163 families falling into the $25,000 to $34,999 income range, which is the most common income bracket and makes up 51.4% of all families.
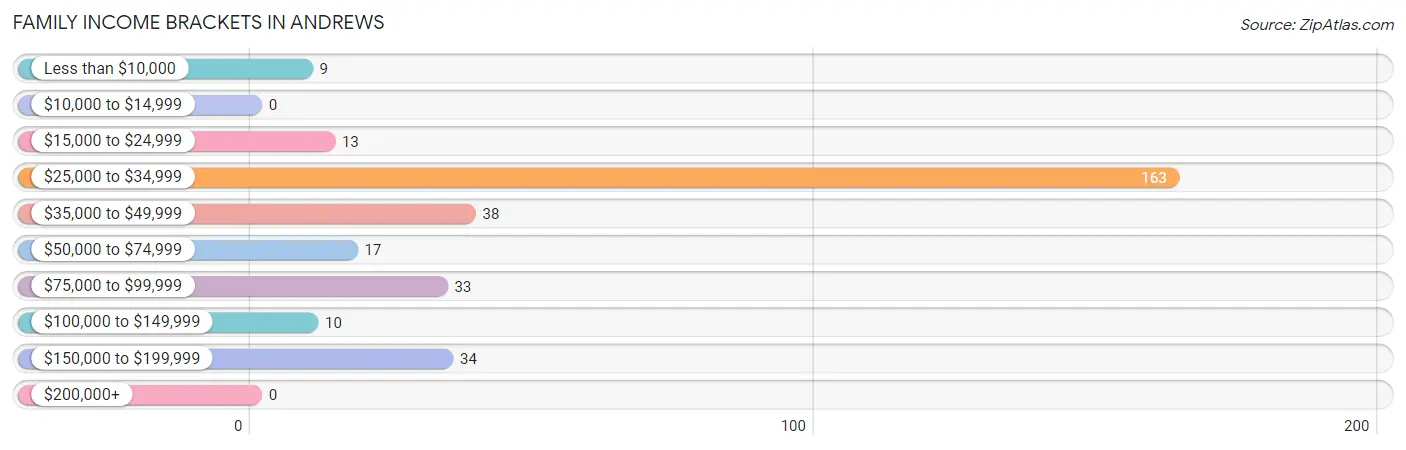
| Income Bracket | # Families | % Families |
| Less than $10,000 | 9 | 2.8% |
| $10,000 to $14,999 | 0 | 0.0% |
| $15,000 to $24,999 | 13 | 4.1% |
| $25,000 to $34,999 | 163 | 51.4% |
| $35,000 to $49,999 | 38 | 12.0% |
| $50,000 to $74,999 | 17 | 5.4% |
| $75,000 to $99,999 | 33 | 10.4% |
| $100,000 to $149,999 | 10 | 3.2% |
| $150,000 to $199,999 | 34 | 10.7% |
| $200,000+ | 0 | 0.0% |
Family Income by Famaliy Size in Andrews
2-person families (210 | 66.2%) account for the highest median family income in Andrews with $33,951 per family, while 2-person families (210 | 66.2%) have the highest median income of $16,976 per family member.
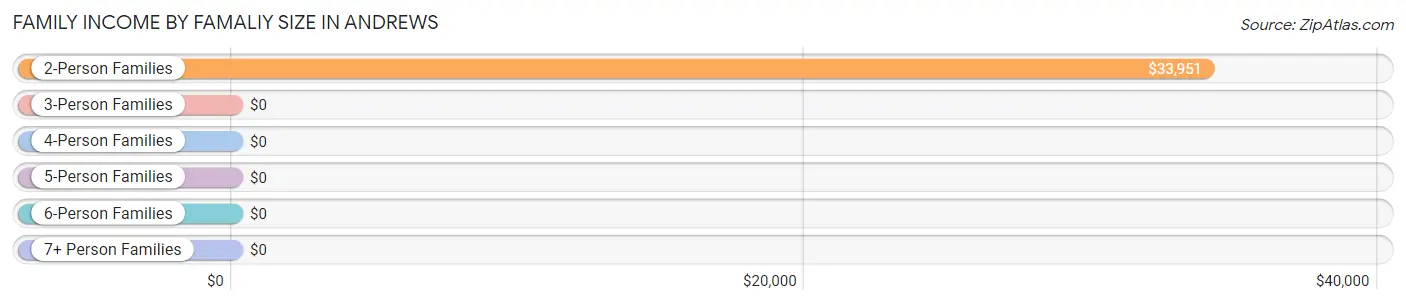
| Income Bracket | # Families | Median Income |
| 2-Person Families | 210 (66.2%) | $33,951 |
| 3-Person Families | 74 (23.3%) | $0 |
| 4-Person Families | 0 (0.0%) | $0 |
| 5-Person Families | 33 (10.4%) | $0 |
| 6-Person Families | 0 (0.0%) | $0 |
| 7+ Person Families | 0 (0.0%) | $0 |
| Total | 317 (100.0%) | $34,594 |
Family Income by Number of Earners in Andrews
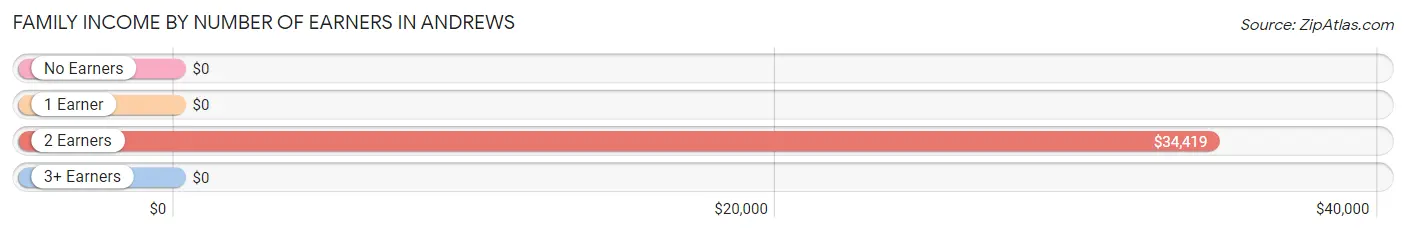
| Number of Earners | # Families | Median Income |
| No Earners | 42 (13.3%) | $0 |
| 1 Earner | 30 (9.5%) | $0 |
| 2 Earners | 221 (69.7%) | $34,419 |
| 3+ Earners | 24 (7.6%) | $0 |
| Total | 317 (100.0%) | $34,594 |
Household Income in Andrews
Household Income Brackets in Andrews
With 175 households falling in the category, the $25,000 to $34,999 income range is the most frequent in Andrews, accounting for 51.0% of all households.
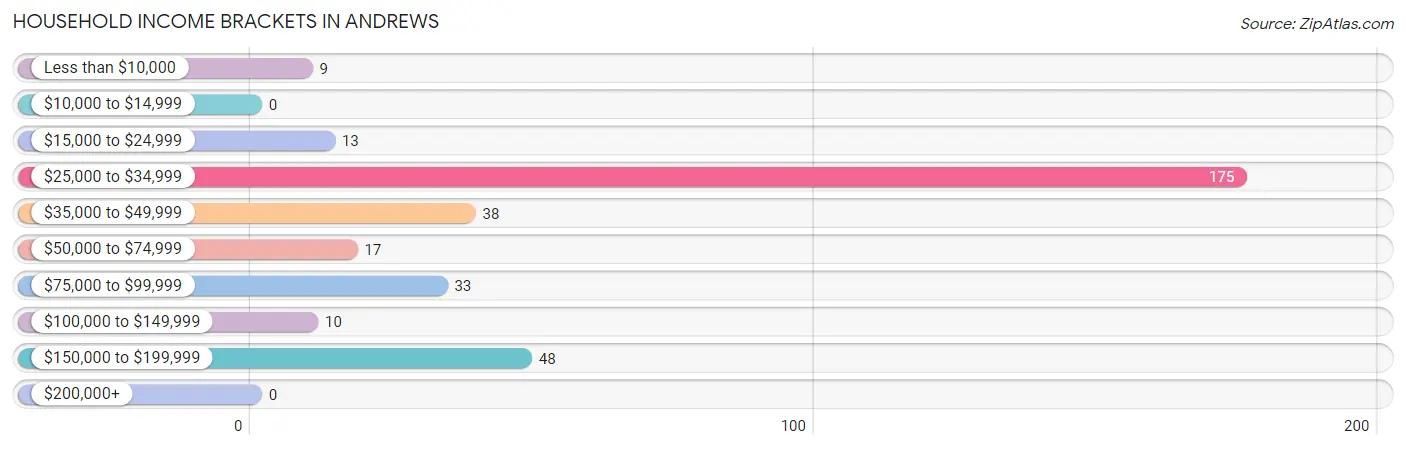
| Income Bracket | # Households | % Households |
| Less than $10,000 | 9 | 2.6% |
| $10,000 to $14,999 | 0 | 0.0% |
| $15,000 to $24,999 | 13 | 3.8% |
| $25,000 to $34,999 | 175 | 51.0% |
| $35,000 to $49,999 | 38 | 11.1% |
| $50,000 to $74,999 | 17 | 5.0% |
| $75,000 to $99,999 | 33 | 9.6% |
| $100,000 to $149,999 | 10 | 2.9% |
| $150,000 to $199,999 | 48 | 14.0% |
| $200,000+ | 0 | 0.0% |
Household Income by Householder Age in Andrews
The median household income in Andrews is $34,636, with the highest median household income of $34,340 found in the 65+ years age bracket for the primary householder. A total of 53 households (15.4%) fall into this category. Meanwhile, the 15 to 24 years age bracket for the primary householder has the lowest median household income of $0, with 30 households (8.7%) in this group.
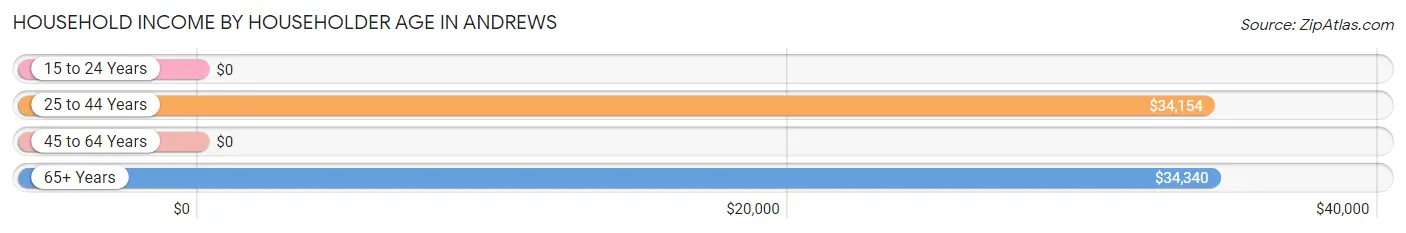
| Income Bracket | # Households | Median Income |
| 15 to 24 Years | 30 (8.7%) | $0 |
| 25 to 44 Years | 168 (49.0%) | $34,154 |
| 45 to 64 Years | 92 (26.8%) | $0 |
| 65+ Years | 53 (15.4%) | $34,340 |
| Total | 343 (100.0%) | $34,636 |
Poverty in Andrews
Income Below Poverty by Sex and Age in Andrews
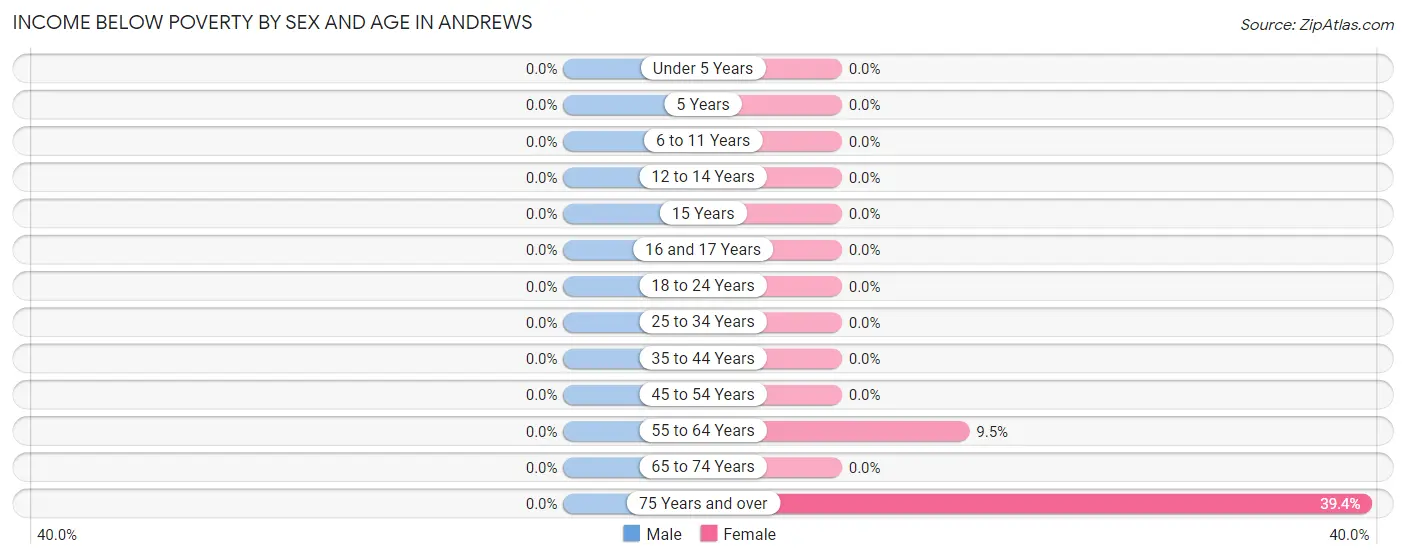
| Age Bracket | Male | Female |
| Under 5 Years | 0 (0.0%) | 0 (0.0%) |
| 5 Years | 0 (0.0%) | 0 (0.0%) |
| 6 to 11 Years | 0 (0.0%) | 0 (0.0%) |
| 12 to 14 Years | 0 (0.0%) | 0 (0.0%) |
| 15 Years | 0 (0.0%) | 0 (0.0%) |
| 16 and 17 Years | 0 (0.0%) | 0 (0.0%) |
| 18 to 24 Years | 0 (0.0%) | 0 (0.0%) |
| 25 to 34 Years | 0 (0.0%) | 0 (0.0%) |
| 35 to 44 Years | 0 (0.0%) | 0 (0.0%) |
| 45 to 54 Years | 0 (0.0%) | 0 (0.0%) |
| 55 to 64 Years | 0 (0.0%) | 9 (9.5%) |
| 65 to 74 Years | 0 (0.0%) | 0 (0.0%) |
| 75 Years and over | 0 (0.0%) | 13 (39.4%) |
| Total | 0 (0.0%) | 22 (4.0%) |
Income Above Poverty by Sex and Age in Andrews
According to the poverty statistics in Andrews, males aged 6 to 11 years and females aged under 5 years are the age groups that are most secure financially, with 100.0% of males and 100.0% of females in these age groups living above the poverty line.
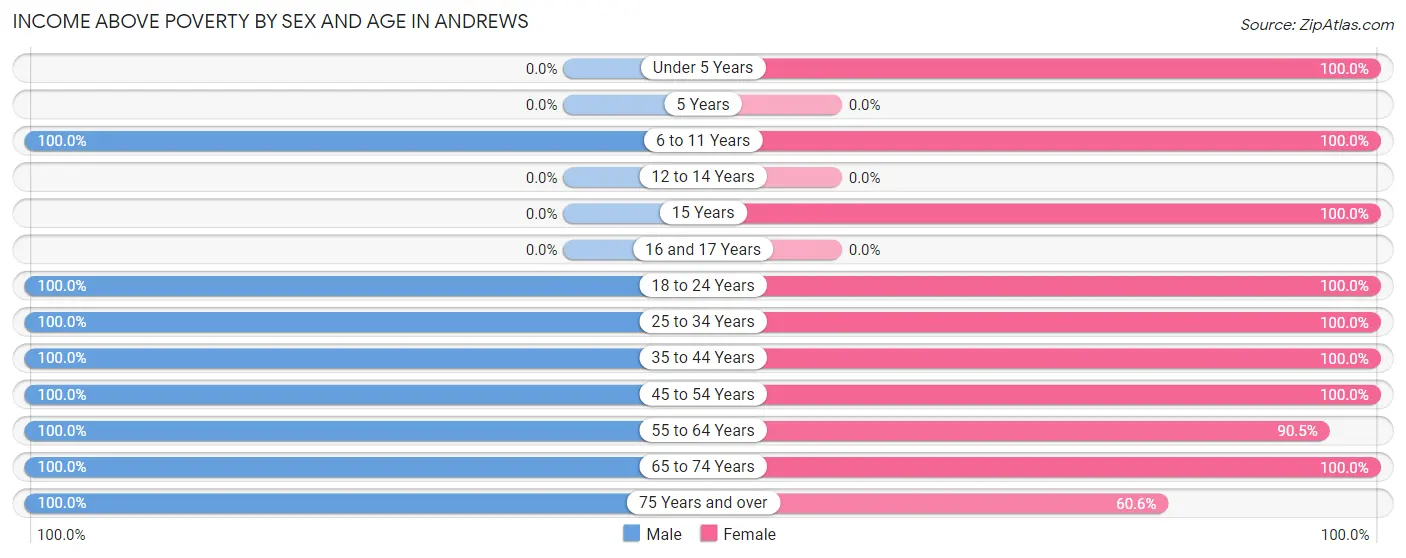
| Age Bracket | Male | Female |
| Under 5 Years | 0 (0.0%) | 28 (100.0%) |
| 5 Years | 0 (0.0%) | 0 (0.0%) |
| 6 to 11 Years | 31 (100.0%) | 27 (100.0%) |
| 12 to 14 Years | 0 (0.0%) | 0 (0.0%) |
| 15 Years | 0 (0.0%) | 32 (100.0%) |
| 16 and 17 Years | 0 (0.0%) | 0 (0.0%) |
| 18 to 24 Years | 58 (100.0%) | 62 (100.0%) |
| 25 to 34 Years | 8 (100.0%) | 40 (100.0%) |
| 35 to 44 Years | 26 (100.0%) | 160 (100.0%) |
| 45 to 54 Years | 164 (100.0%) | 38 (100.0%) |
| 55 to 64 Years | 51 (100.0%) | 86 (90.5%) |
| 65 to 74 Years | 35 (100.0%) | 37 (100.0%) |
| 75 Years and over | 19 (100.0%) | 20 (60.6%) |
| Total | 392 (100.0%) | 530 (96.0%) |
Income Below Poverty Among Married-Couple Families in Andrews
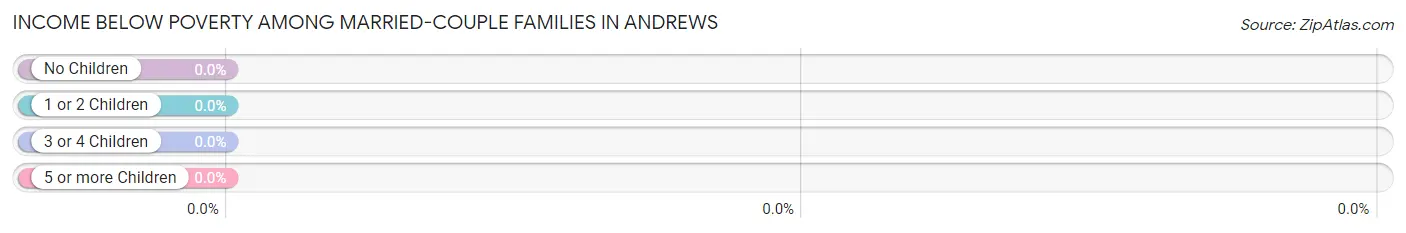
| Children | Above Poverty | Below Poverty |
| No Children | 215 (100.0%) | 0 (0.0%) |
| 1 or 2 Children | 30 (100.0%) | 0 (0.0%) |
| 3 or 4 Children | 33 (100.0%) | 0 (0.0%) |
| 5 or more Children | 0 (0.0%) | 0 (0.0%) |
| Total | 278 (100.0%) | 0 (0.0%) |
Income Below Poverty Among Single-Parent Households in Andrews
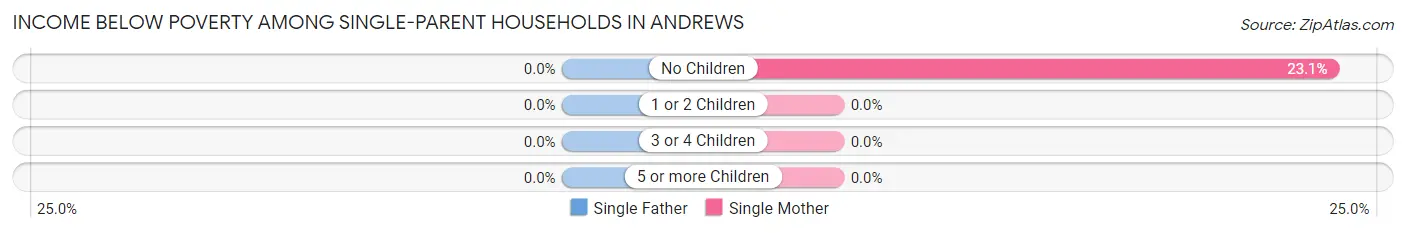
| Children | Single Father | Single Mother |
| No Children | 0 (0.0%) | 9 (23.1%) |
| 1 or 2 Children | 0 (0.0%) | 0 (0.0%) |
| 3 or 4 Children | 0 (0.0%) | 0 (0.0%) |
| 5 or more Children | 0 (0.0%) | 0 (0.0%) |
| Total | 0 (0.0%) | 9 (23.1%) |
Income Below Poverty Among Married-Couple vs Single-Parent Households in Andrews
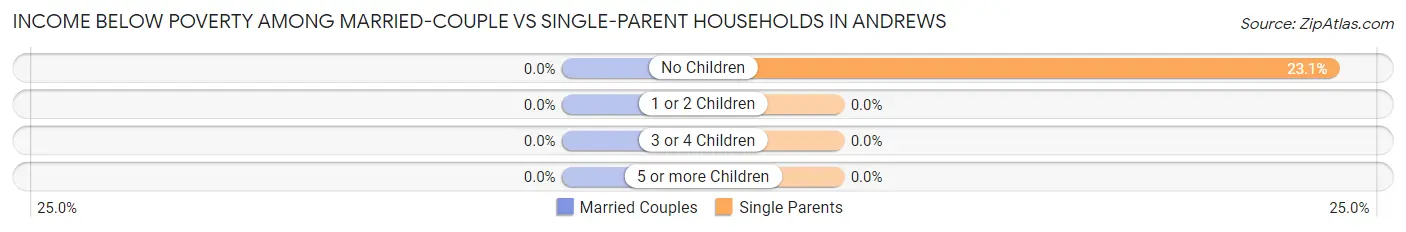
| Children | Married-Couple Families | Single-Parent Households |
| No Children | 0 (0.0%) | 9 (23.1%) |
| 1 or 2 Children | 0 (0.0%) | 0 (0.0%) |
| 3 or 4 Children | 0 (0.0%) | 0 (0.0%) |
| 5 or more Children | 0 (0.0%) | 0 (0.0%) |
| Total | 0 (0.0%) | 9 (23.1%) |
Race in Andrews
The most populous races in Andrews are White / Caucasian (848 | 89.8%), and Two or more Races (96 | 10.2%).
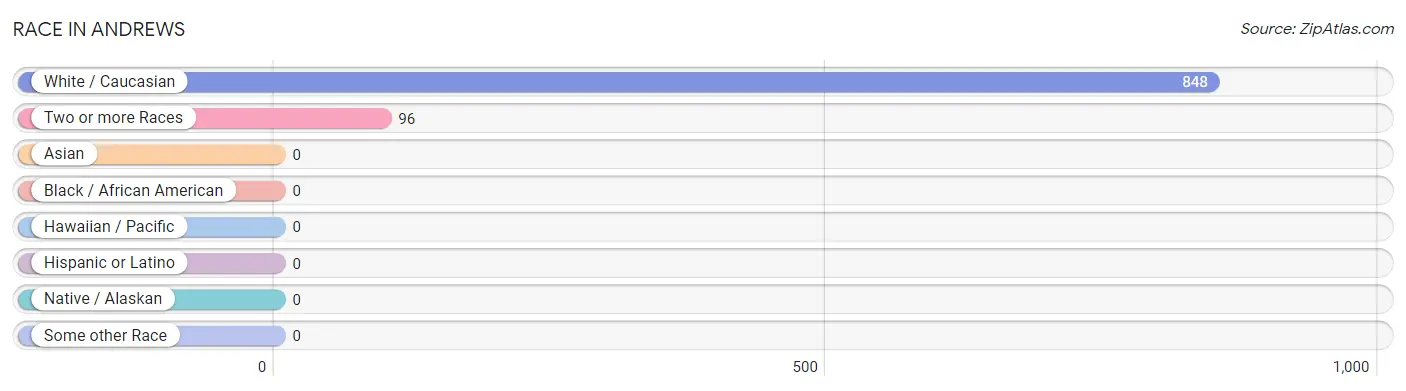
| Race | # Population | % Population |
| Asian | 0 | 0.0% |
| Black / African American | 0 | 0.0% |
| Hawaiian / Pacific | 0 | 0.0% |
| Hispanic or Latino | 0 | 0.0% |
| Native / Alaskan | 0 | 0.0% |
| White / Caucasian | 848 | 89.8% |
| Two or more Races | 96 | 10.2% |
| Some other Race | 0 | 0.0% |
| Total | 944 | 100.0% |
Ancestry in Andrews
The most populous ancestries reported in Andrews are Irish (431 | 45.7%), American (103 | 10.9%), Native Hawaiian (86 | 9.1%), English (46 | 4.9%), and Scotch-Irish (29 | 3.1%), together accounting for 73.6% of all Andrews residents.
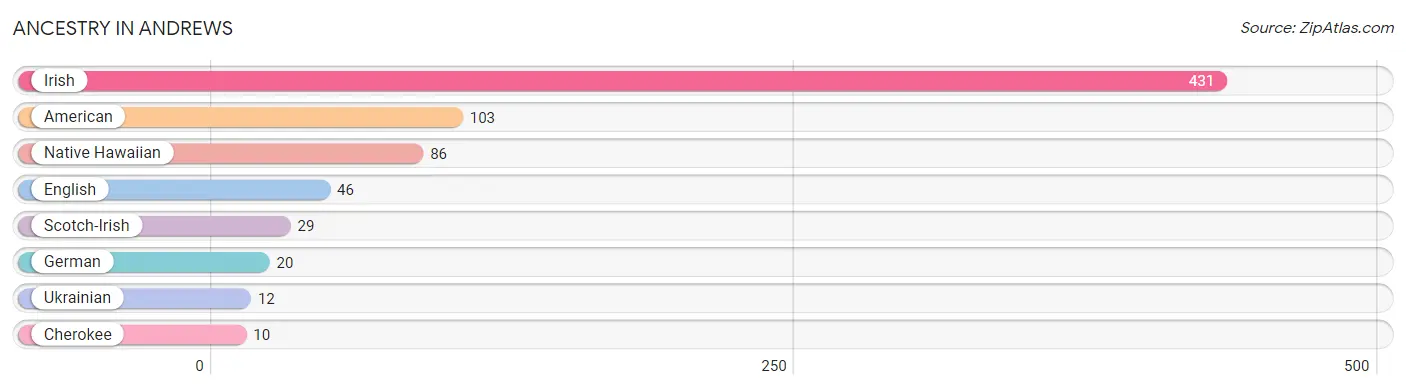
| Ancestry | # Population | % Population |
| American | 103 | 10.9% |
| Cherokee | 10 | 1.1% |
| English | 46 | 4.9% |
| German | 20 | 2.1% |
| Irish | 431 | 45.7% |
| Native Hawaiian | 86 | 9.1% |
| Scotch-Irish | 29 | 3.1% |
| Ukrainian | 12 | 1.3% | View All 8 Rows |
Immigrants in Andrews

| Immigration Origin | # Population | % Population | View All 0 Rows |
Sex and Age in Andrews
Sex and Age in Andrews
The most populous age groups in Andrews are 50 to 54 Years (164 | 41.8%) for men and 40 to 44 Years (127 | 23.0%) for women.
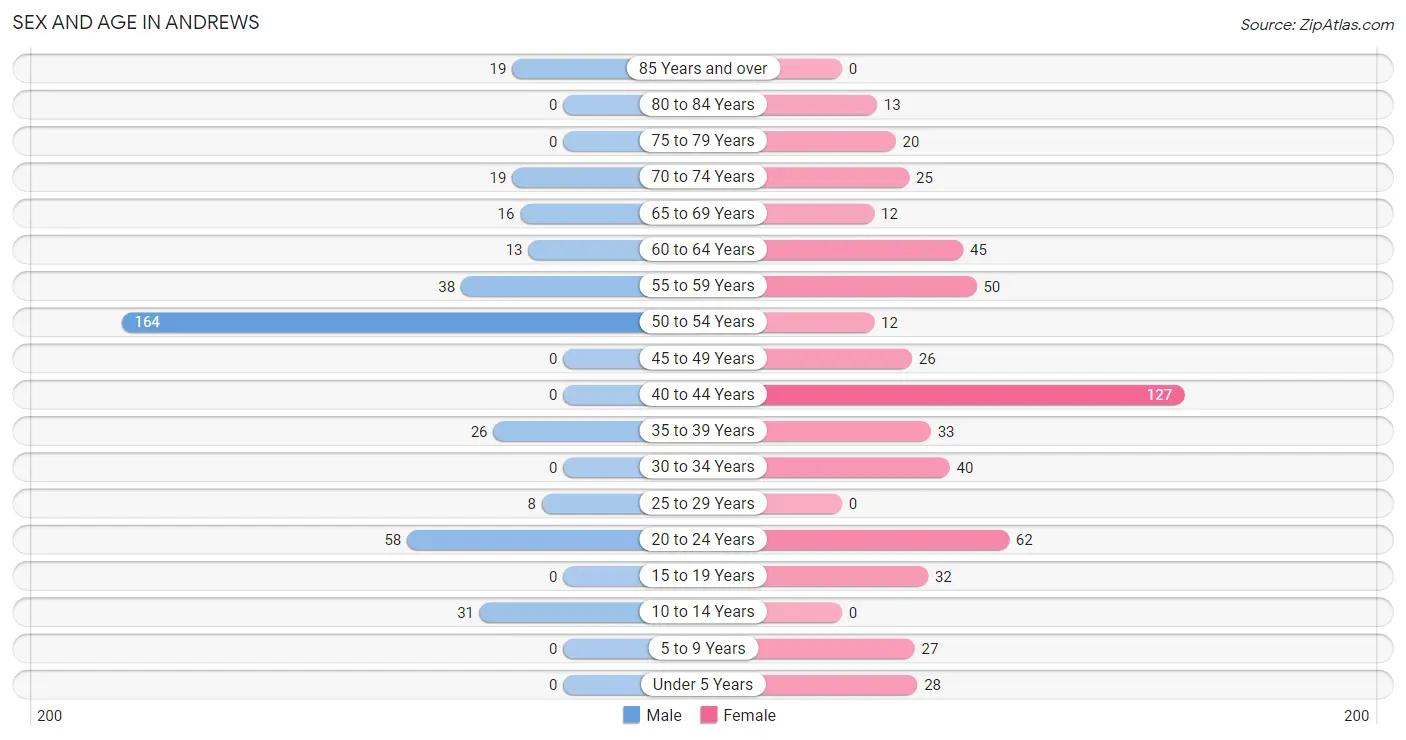
| Age Bracket | Male | Female |
| Under 5 Years | 0 (0.0%) | 28 (5.1%) |
| 5 to 9 Years | 0 (0.0%) | 27 (4.9%) |
| 10 to 14 Years | 31 (7.9%) | 0 (0.0%) |
| 15 to 19 Years | 0 (0.0%) | 32 (5.8%) |
| 20 to 24 Years | 58 (14.8%) | 62 (11.2%) |
| 25 to 29 Years | 8 (2.0%) | 0 (0.0%) |
| 30 to 34 Years | 0 (0.0%) | 40 (7.2%) |
| 35 to 39 Years | 26 (6.6%) | 33 (6.0%) |
| 40 to 44 Years | 0 (0.0%) | 127 (23.0%) |
| 45 to 49 Years | 0 (0.0%) | 26 (4.7%) |
| 50 to 54 Years | 164 (41.8%) | 12 (2.2%) |
| 55 to 59 Years | 38 (9.7%) | 50 (9.1%) |
| 60 to 64 Years | 13 (3.3%) | 45 (8.2%) |
| 65 to 69 Years | 16 (4.1%) | 12 (2.2%) |
| 70 to 74 Years | 19 (4.9%) | 25 (4.5%) |
| 75 to 79 Years | 0 (0.0%) | 20 (3.6%) |
| 80 to 84 Years | 0 (0.0%) | 13 (2.4%) |
| 85 Years and over | 19 (4.9%) | 0 (0.0%) |
| Total | 392 (100.0%) | 552 (100.0%) |
Families and Households in Andrews
Median Family Size in Andrews
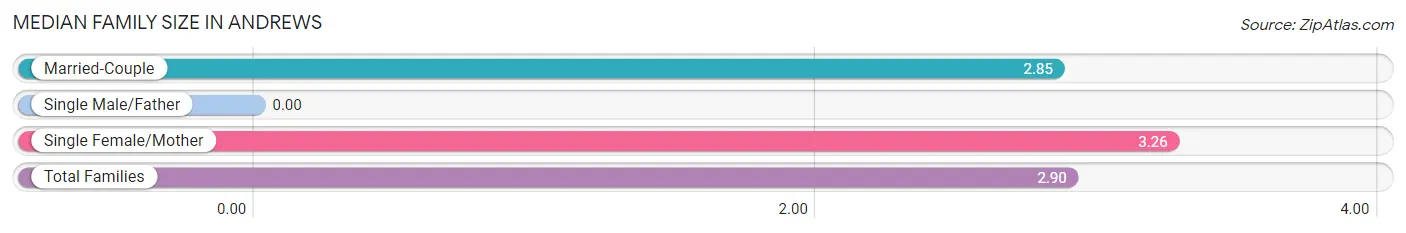
| Family Type | # Families | Family Size |
| Married-Couple | 278 (87.7%) | 2.85 |
| Single Male/Father | 0 (0.0%) | - |
| Single Female/Mother | 39 (12.3%) | 3.26 |
| Total Families | 317 (100.0%) | 2.90 |
Median Household Size in Andrews
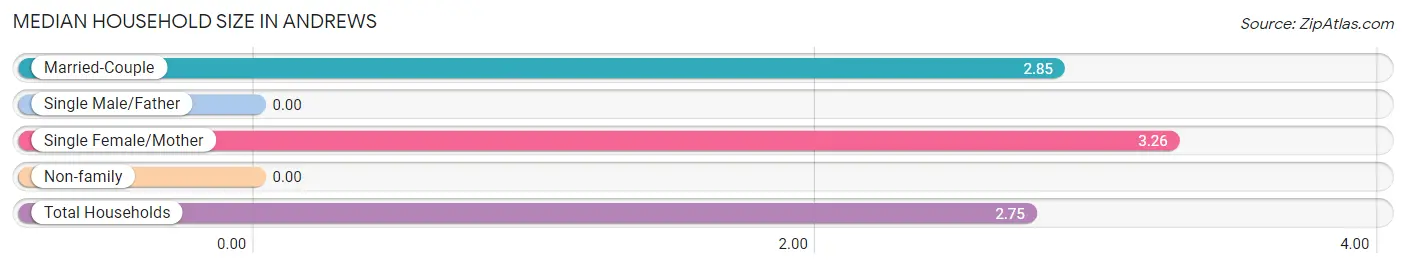
| Household Type | # Households | Household Size |
| Married-Couple | 278 (81.0%) | 2.85 |
| Single Male/Father | 0 (0.0%) | - |
| Single Female/Mother | 39 (11.4%) | 3.26 |
| Non-family | 26 (7.6%) | - |
| Total Households | 343 (100.0%) | 2.75 |
Household Size by Marriage Status in Andrews
Out of a total of 343 households in Andrews, 317 (92.4%) are family households, while 26 (7.6%) are nonfamily households. The most numerous type of family households are 2-person households, comprising 210, and the most common type of nonfamily households are 1-person households, comprising 26.
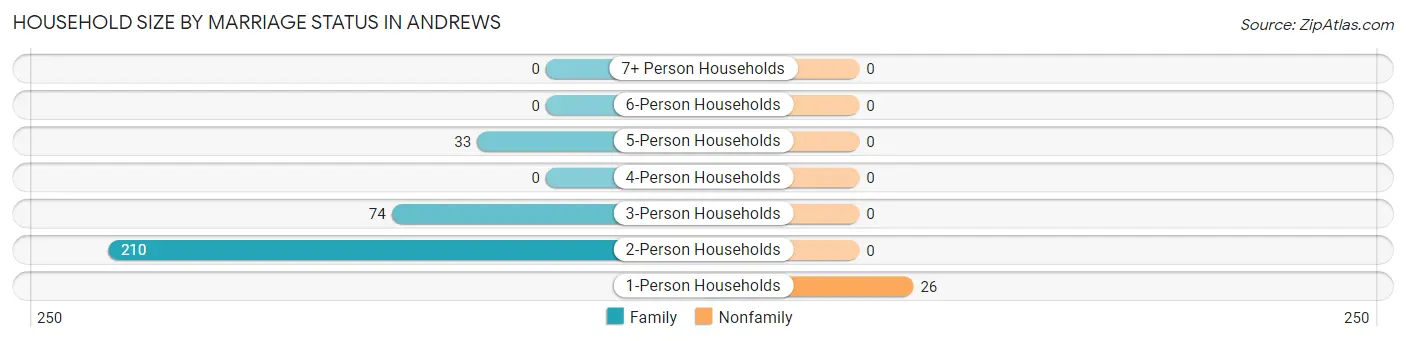
| Household Size | Family Households | Nonfamily Households |
| 1-Person Households | - | 26 (7.6%) |
| 2-Person Households | 210 (61.2%) | 0 (0.0%) |
| 3-Person Households | 74 (21.6%) | 0 (0.0%) |
| 4-Person Households | 0 (0.0%) | 0 (0.0%) |
| 5-Person Households | 33 (9.6%) | 0 (0.0%) |
| 6-Person Households | 0 (0.0%) | 0 (0.0%) |
| 7+ Person Households | 0 (0.0%) | 0 (0.0%) |
| Total | 317 (92.4%) | 26 (7.6%) |
Female Fertility in Andrews
Fertility by Age in Andrews
| Age Bracket | Women with Births | Births / 1,000 Women |
| 15 to 19 years | 0 (0.0%) | 0.0 |
| 20 to 34 years | 0 (0.0%) | 0.0 |
| 35 to 50 years | 0 (0.0%) | 0.0 |
| Total | 0 (0.0%) | 0.0 |
Fertility by Age by Marriage Status in Andrews
| Age Bracket | Married | Unmarried |
| 15 to 19 years | 0 (0.0%) | 0 (0.0%) |
| 20 to 34 years | 0 (0.0%) | 0 (0.0%) |
| 35 to 50 years | 0 (0.0%) | 0 (0.0%) |
| Total | 0 (0.0%) | 0 (0.0%) |
Fertility by Education in Andrews
| Educational Attainment | Women with Births | Births / 1,000 Women |
| Less than High School | 0 (0.0%) | 0.0 |
| High School Diploma | 0 (0.0%) | 0.0 |
| College or Associate's Degree | 0 (0.0%) | 0.0 |
| Bachelor's Degree | 0 (0.0%) | 0.0 |
| Graduate Degree | 0 (0.0%) | 0.0 |
| Total | 0 (0.0%) | 0.0 |
Fertility by Education by Marriage Status in Andrews
| Educational Attainment | Married | Unmarried |
| Less than High School | 0 (0.0%) | 0 (0.0%) |
| High School Diploma | 0 (0.0%) | 0 (0.0%) |
| College or Associate's Degree | 0 (0.0%) | 0 (0.0%) |
| Bachelor's Degree | 0 (0.0%) | 0 (0.0%) |
| Graduate Degree | 0 (0.0%) | 0 (0.0%) |
| Total | 0 (0.0%) | 0 (0.0%) |
Employment Characteristics in Andrews
Employment by Class of Employer in Andrews
Among the 518 employed individuals in Andrews, private company employees (243 | 46.9%), self-employed (not incorporated) (189 | 36.5%), and state government employees (32 | 6.2%) make up the most common classes of employment.
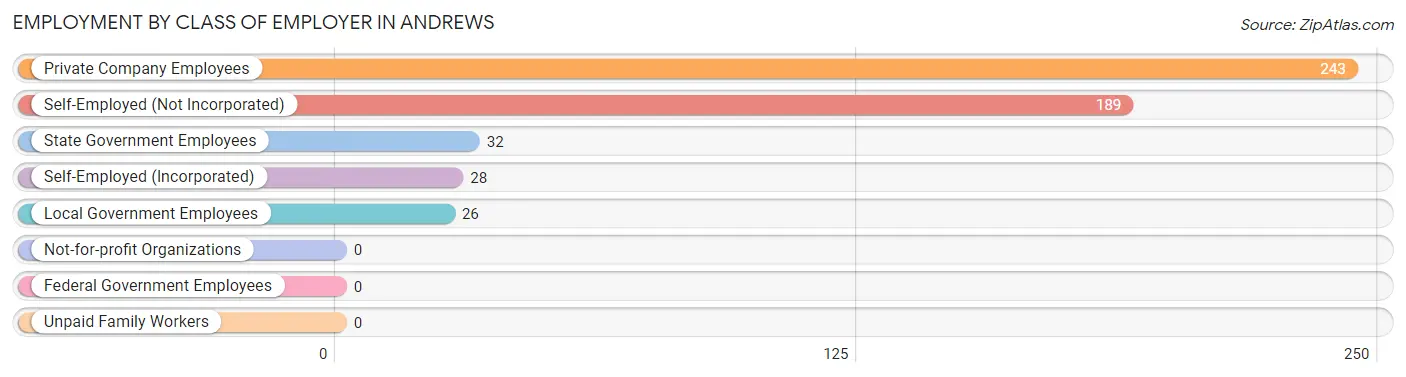
| Employer Class | # Employees | % Employees |
| Private Company Employees | 243 | 46.9% |
| Self-Employed (Incorporated) | 28 | 5.4% |
| Self-Employed (Not Incorporated) | 189 | 36.5% |
| Not-for-profit Organizations | 0 | 0.0% |
| Local Government Employees | 26 | 5.0% |
| State Government Employees | 32 | 6.2% |
| Federal Government Employees | 0 | 0.0% |
| Unpaid Family Workers | 0 | 0.0% |
| Total | 518 | 100.0% |
Employment Status by Age in Andrews
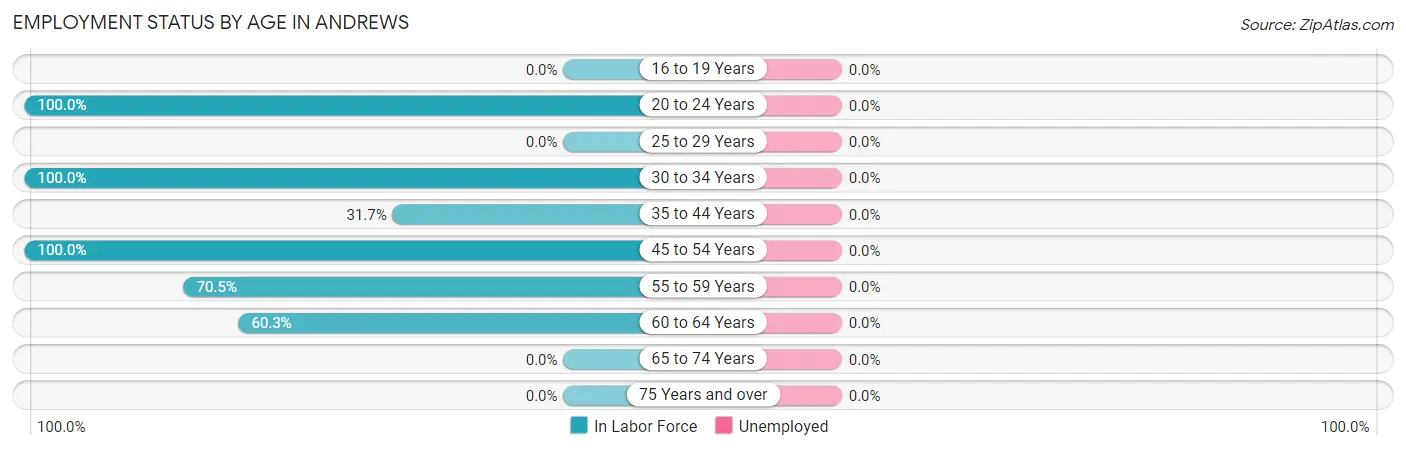
| Age Bracket | In Labor Force | Unemployed |
| 16 to 19 Years | 0 (0.0%) | 0 (0.0%) |
| 20 to 24 Years | 120 (100.0%) | 0 (0.0%) |
| 25 to 29 Years | 0 (0.0%) | 0 (0.0%) |
| 30 to 34 Years | 40 (100.0%) | 0 (0.0%) |
| 35 to 44 Years | 59 (31.7%) | 0 (0.0%) |
| 45 to 54 Years | 202 (100.0%) | 0 (0.0%) |
| 55 to 59 Years | 62 (70.5%) | 0 (0.0%) |
| 60 to 64 Years | 35 (60.3%) | 0 (0.0%) |
| 65 to 74 Years | 0 (0.0%) | 0 (0.0%) |
| 75 Years and over | 0 (0.0%) | 0 (0.0%) |
| Total | 518 (62.7%) | 0 (0.0%) |
Employment Status by Educational Attainment in Andrews
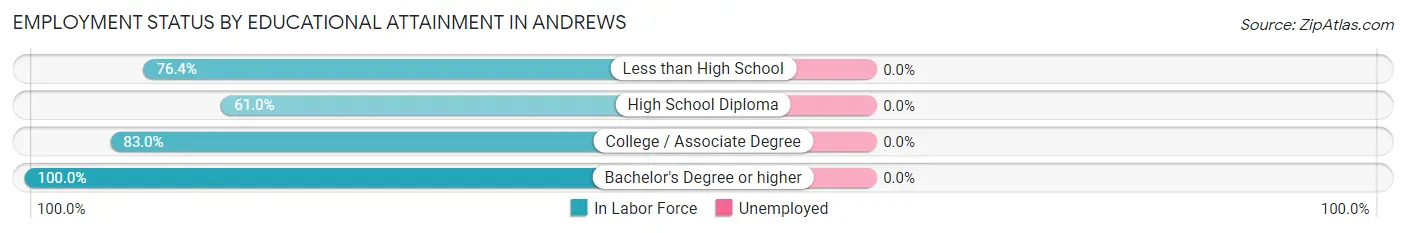
| Educational Attainment | In Labor Force | Unemployed |
| Less than High School | 84 (76.4%) | 0 (0.0%) |
| High School Diploma | 221 (61.0%) | 0 (0.0%) |
| College / Associate Degree | 83 (83.0%) | 0 (0.0%) |
| Bachelor's Degree or higher | 10 (100.0%) | 0 (0.0%) |
| Total | 398 (68.4%) | 0 (0.0%) |
Employment Occupations by Sex in Andrews
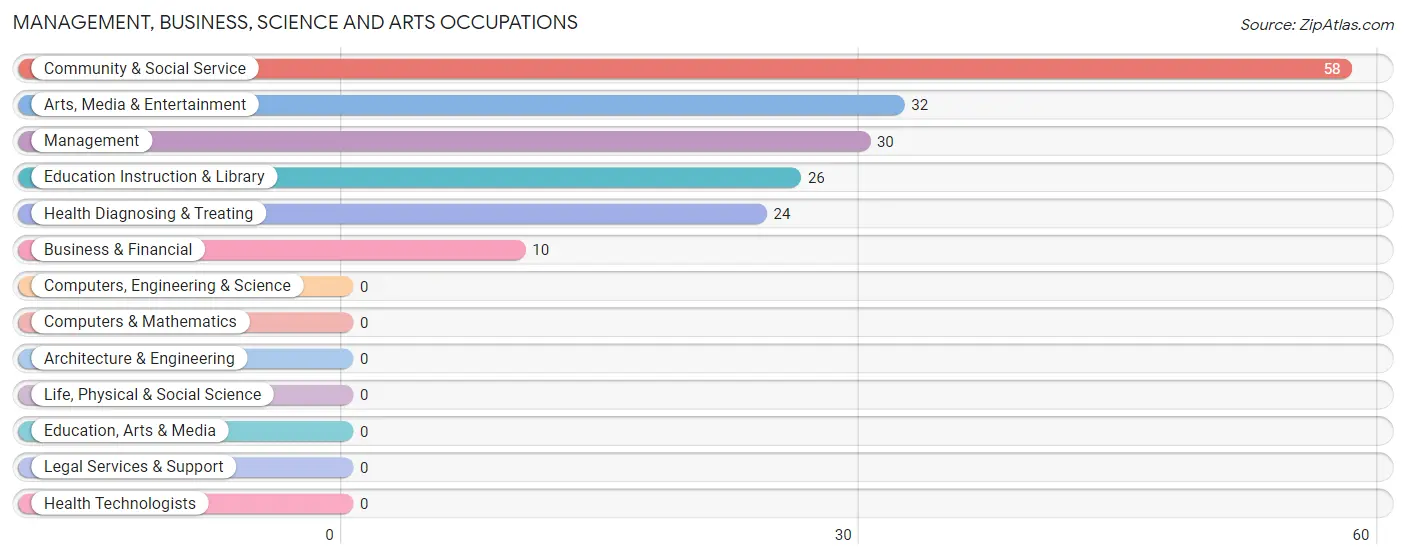
Management, Business, Science and Arts Occupations
The most common Management, Business, Science and Arts occupations in Andrews are Community & Social Service (58 | 11.2%), Arts, Media & Entertainment (32 | 6.2%), Management (30 | 5.8%), Education Instruction & Library (26 | 5.0%), and Health Diagnosing & Treating (24 | 4.6%).
Management, Business, Science and Arts Occupations by Sex
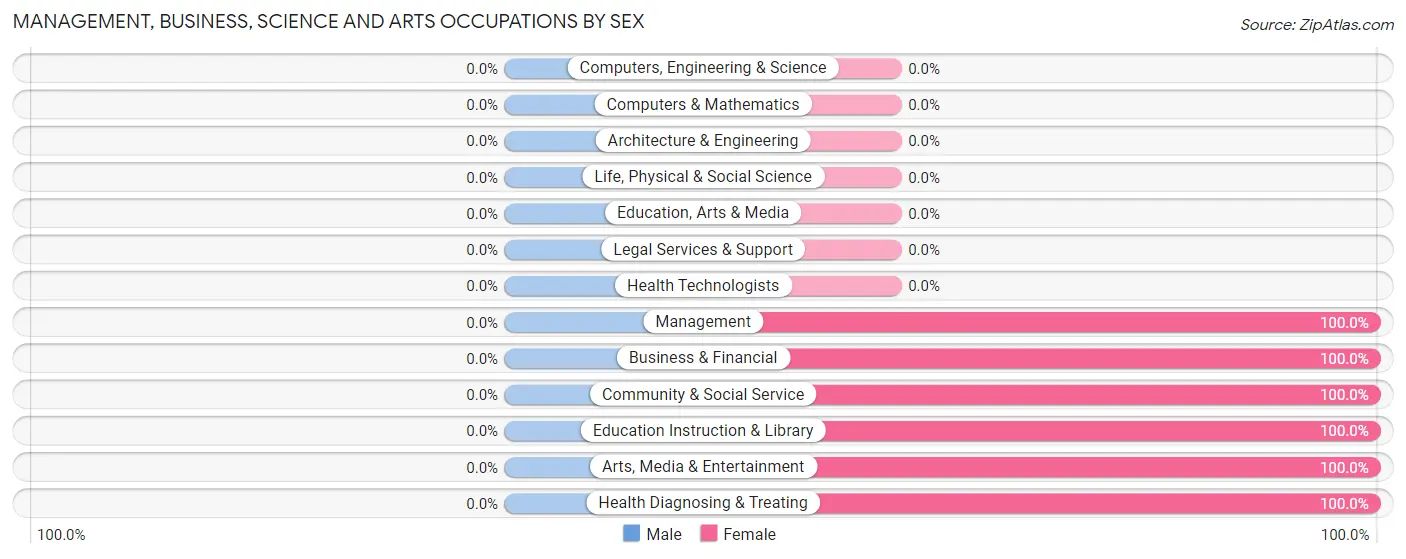
| Occupation | Male | Female |
| Management | 0 (0.0%) | 30 (100.0%) |
| Business & Financial | 0 (0.0%) | 10 (100.0%) |
| Computers, Engineering & Science | 0 (0.0%) | 0 (0.0%) |
| Computers & Mathematics | 0 (0.0%) | 0 (0.0%) |
| Architecture & Engineering | 0 (0.0%) | 0 (0.0%) |
| Life, Physical & Social Science | 0 (0.0%) | 0 (0.0%) |
| Community & Social Service | 0 (0.0%) | 58 (100.0%) |
| Education, Arts & Media | 0 (0.0%) | 0 (0.0%) |
| Legal Services & Support | 0 (0.0%) | 0 (0.0%) |
| Education Instruction & Library | 0 (0.0%) | 26 (100.0%) |
| Arts, Media & Entertainment | 0 (0.0%) | 32 (100.0%) |
| Health Diagnosing & Treating | 0 (0.0%) | 24 (100.0%) |
| Health Technologists | 0 (0.0%) | 0 (0.0%) |
| Total (Category) | 0 (0.0%) | 122 (100.0%) |
| Total (Overall) | 299 (57.7%) | 219 (42.3%) |
Services Occupations
The most common Services occupations in Andrews are Food Preparation & Serving (30 | 5.8%), and Healthcare Support (12 | 2.3%).
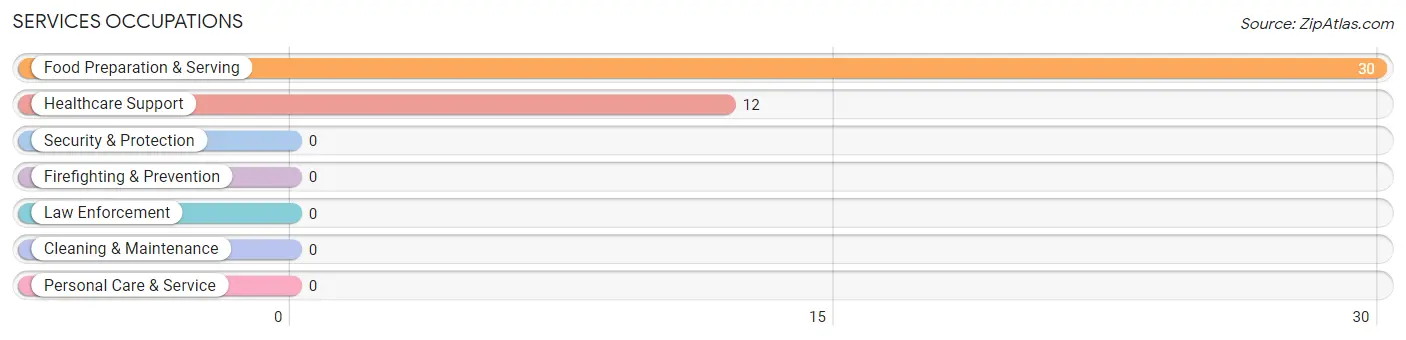
Services Occupations by Sex
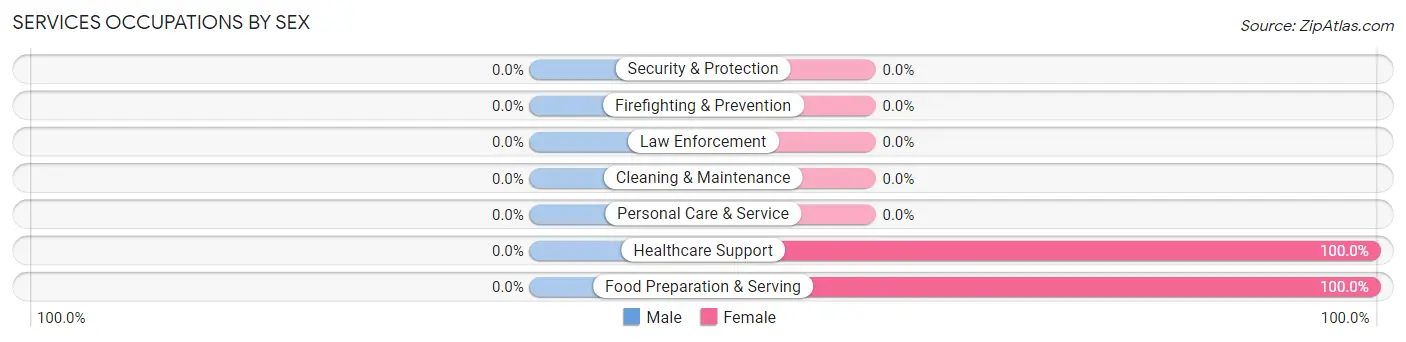
| Occupation | Male | Female |
| Healthcare Support | 0 (0.0%) | 12 (100.0%) |
| Security & Protection | 0 (0.0%) | 0 (0.0%) |
| Firefighting & Prevention | 0 (0.0%) | 0 (0.0%) |
| Law Enforcement | 0 (0.0%) | 0 (0.0%) |
| Food Preparation & Serving | 0 (0.0%) | 30 (100.0%) |
| Cleaning & Maintenance | 0 (0.0%) | 0 (0.0%) |
| Personal Care & Service | 0 (0.0%) | 0 (0.0%) |
| Total (Category) | 0 (0.0%) | 42 (100.0%) |
| Total (Overall) | 299 (57.7%) | 219 (42.3%) |
Sales and Office Occupations
The most common Sales and Office occupations in Andrews are , and Office & Administration (45 | 8.7%).
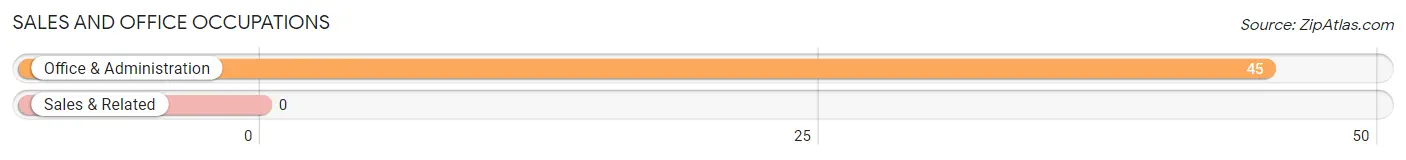
Sales and Office Occupations by Sex
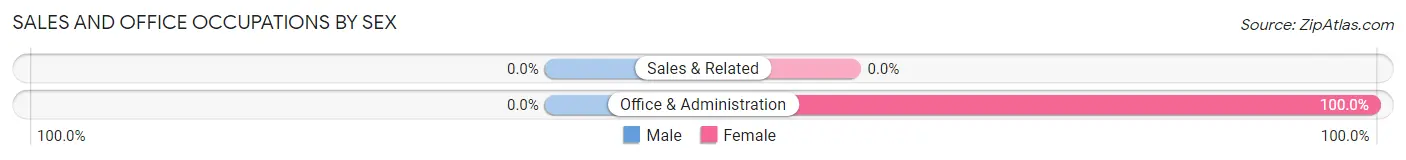
| Occupation | Male | Female |
| Sales & Related | 0 (0.0%) | 0 (0.0%) |
| Office & Administration | 0 (0.0%) | 45 (100.0%) |
| Total (Category) | 0 (0.0%) | 45 (100.0%) |
| Total (Overall) | 299 (57.7%) | 219 (42.3%) |
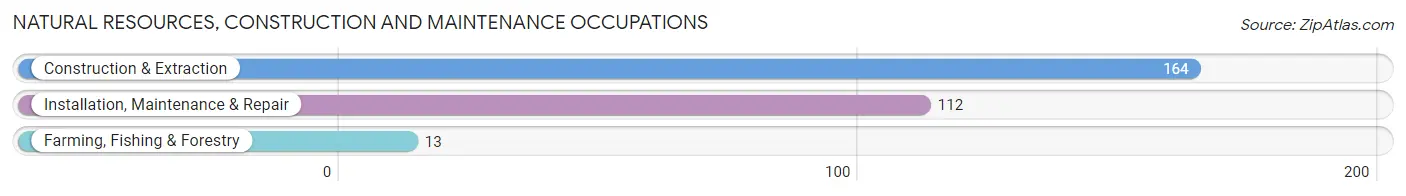
Natural Resources, Construction and Maintenance Occupations
The most common Natural Resources, Construction and Maintenance occupations in Andrews are Construction & Extraction (164 | 31.7%), Installation, Maintenance & Repair (112 | 21.6%), and Farming, Fishing & Forestry (13 | 2.5%).
Natural Resources, Construction and Maintenance Occupations by Sex
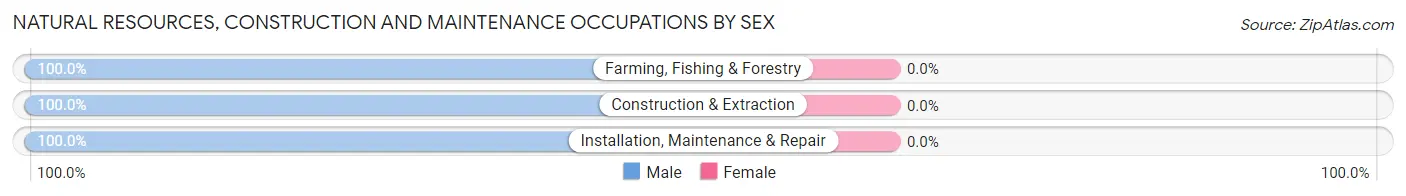
| Occupation | Male | Female |
| Farming, Fishing & Forestry | 13 (100.0%) | 0 (0.0%) |
| Construction & Extraction | 164 (100.0%) | 0 (0.0%) |
| Installation, Maintenance & Repair | 112 (100.0%) | 0 (0.0%) |
| Total (Category) | 289 (100.0%) | 0 (0.0%) |
| Total (Overall) | 299 (57.7%) | 219 (42.3%) |
Production, Transportation and Moving Occupations
The most common Production, Transportation and Moving occupations in Andrews are Transportation (10 | 1.9%), and Material Moving (10 | 1.9%).
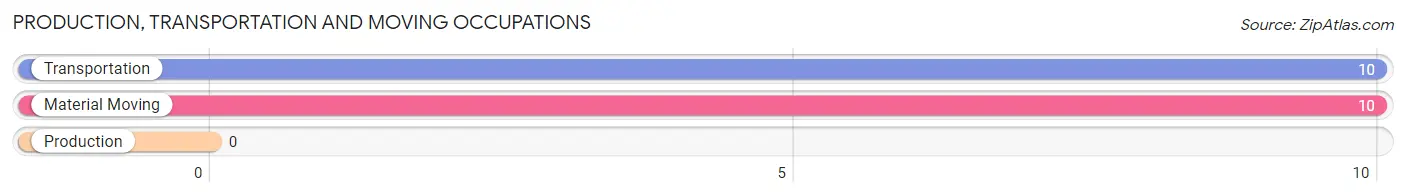
Production, Transportation and Moving Occupations by Sex
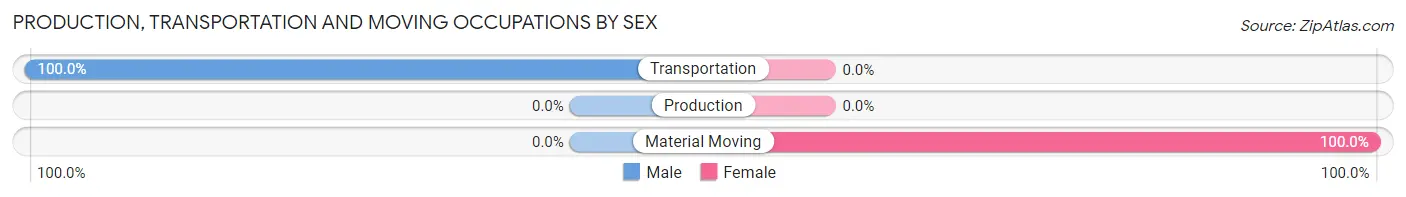
| Occupation | Male | Female |
| Production | 0 (0.0%) | 0 (0.0%) |
| Transportation | 10 (100.0%) | 0 (0.0%) |
| Material Moving | 0 (0.0%) | 10 (100.0%) |
| Total (Category) | 10 (50.0%) | 10 (50.0%) |
| Total (Overall) | 299 (57.7%) | 219 (42.3%) |
Employment Industries by Sex in Andrews
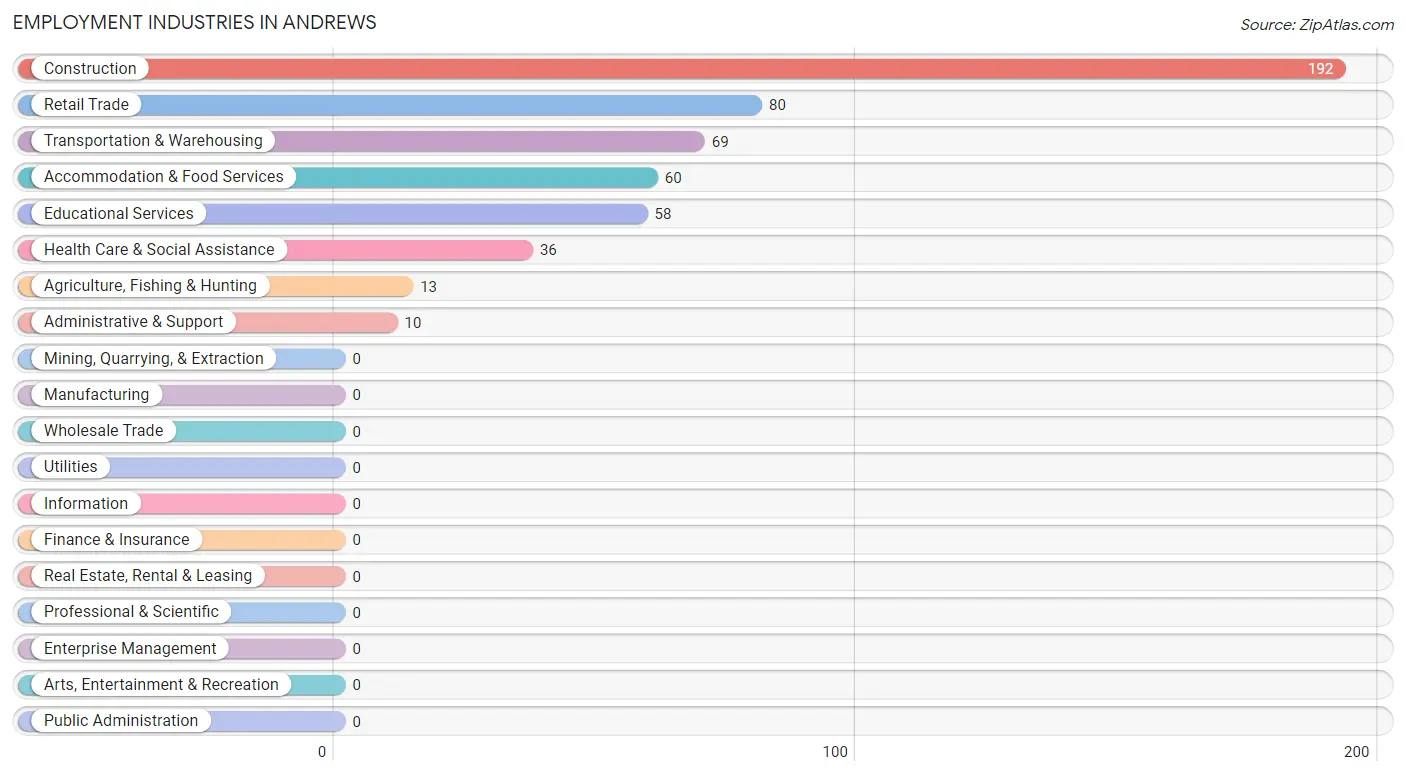
Employment Industries in Andrews
The major employment industries in Andrews include Construction (192 | 37.1%), Retail Trade (80 | 15.4%), Transportation & Warehousing (69 | 13.3%), Accommodation & Food Services (60 | 11.6%), and Educational Services (58 | 11.2%).
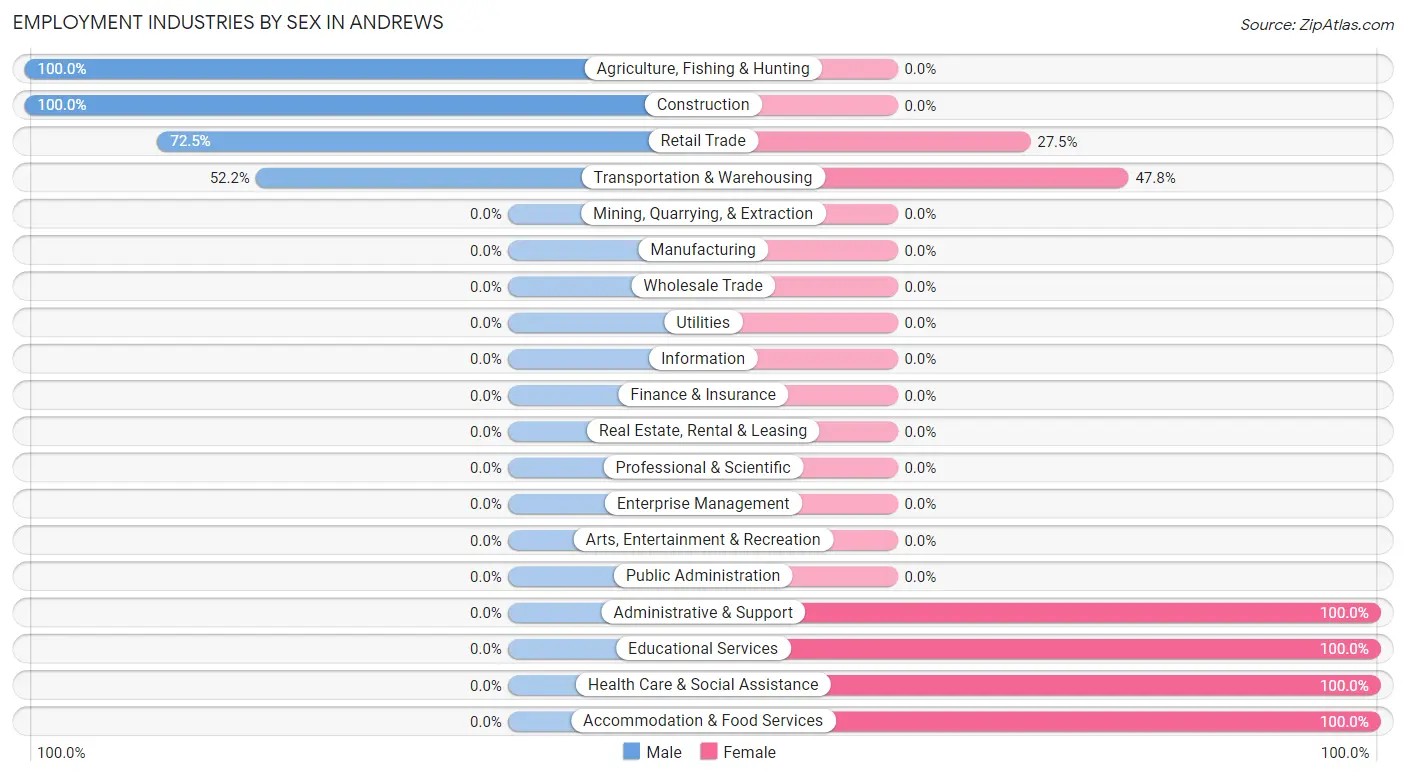
Employment Industries by Sex in Andrews
The Andrews industries that see more men than women are Agriculture, Fishing & Hunting (100.0%), Construction (100.0%), and Retail Trade (72.5%), whereas the industries that tend to have a higher number of women are Administrative & Support (100.0%), Educational Services (100.0%), and Health Care & Social Assistance (100.0%).
| Industry | Male | Female |
| Agriculture, Fishing & Hunting | 13 (100.0%) | 0 (0.0%) |
| Mining, Quarrying, & Extraction | 0 (0.0%) | 0 (0.0%) |
| Construction | 192 (100.0%) | 0 (0.0%) |
| Manufacturing | 0 (0.0%) | 0 (0.0%) |
| Wholesale Trade | 0 (0.0%) | 0 (0.0%) |
| Retail Trade | 58 (72.5%) | 22 (27.5%) |
| Transportation & Warehousing | 36 (52.2%) | 33 (47.8%) |
| Utilities | 0 (0.0%) | 0 (0.0%) |
| Information | 0 (0.0%) | 0 (0.0%) |
| Finance & Insurance | 0 (0.0%) | 0 (0.0%) |
| Real Estate, Rental & Leasing | 0 (0.0%) | 0 (0.0%) |
| Professional & Scientific | 0 (0.0%) | 0 (0.0%) |
| Enterprise Management | 0 (0.0%) | 0 (0.0%) |
| Administrative & Support | 0 (0.0%) | 10 (100.0%) |
| Educational Services | 0 (0.0%) | 58 (100.0%) |
| Health Care & Social Assistance | 0 (0.0%) | 36 (100.0%) |
| Arts, Entertainment & Recreation | 0 (0.0%) | 0 (0.0%) |
| Accommodation & Food Services | 0 (0.0%) | 60 (100.0%) |
| Public Administration | 0 (0.0%) | 0 (0.0%) |
| Total | 299 (57.7%) | 219 (42.3%) |
Education in Andrews
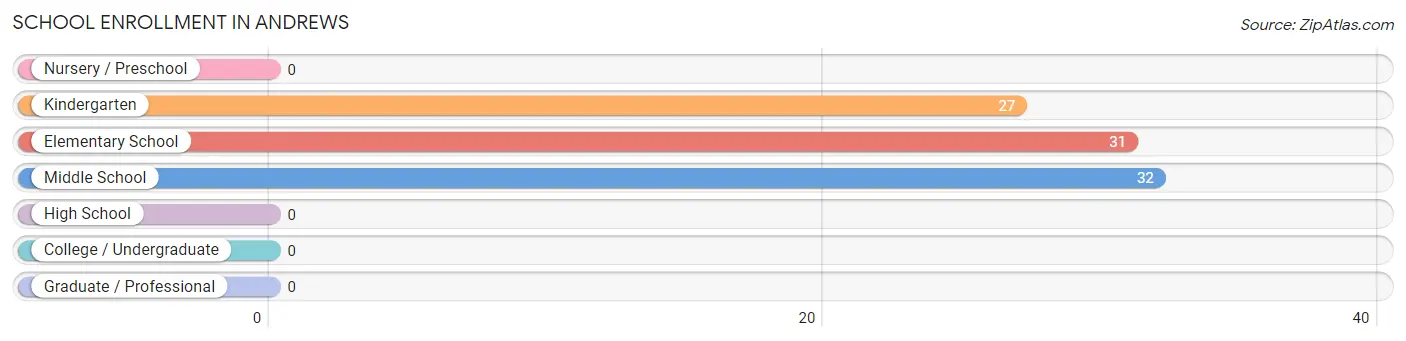
School Enrollment in Andrews
The most common levels of schooling among the 90 students in Andrews are middle school (32 | 35.6%), elementary school (31 | 34.4%), and kindergarten (27 | 30.0%).
| School Level | # Students | % Students |
| Nursery / Preschool | 0 | 0.0% |
| Kindergarten | 27 | 30.0% |
| Elementary School | 31 | 34.4% |
| Middle School | 32 | 35.6% |
| High School | 0 | 0.0% |
| College / Undergraduate | 0 | 0.0% |
| Graduate / Professional | 0 | 0.0% |
| Total | 90 | 100.0% |
School Enrollment by Age by Funding Source in Andrews
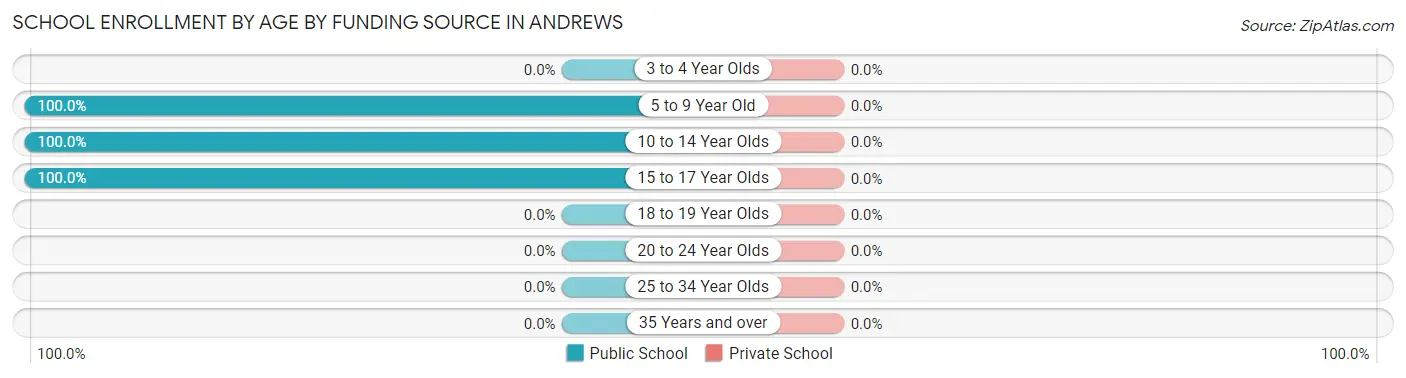
| Age Bracket | Public School | Private School |
| 3 to 4 Year Olds | 0 (0.0%) | 0 (0.0%) |
| 5 to 9 Year Old | 27 (100.0%) | 0 (0.0%) |
| 10 to 14 Year Olds | 31 (100.0%) | 0 (0.0%) |
| 15 to 17 Year Olds | 32 (100.0%) | 0 (0.0%) |
| 18 to 19 Year Olds | 0 (0.0%) | 0 (0.0%) |
| 20 to 24 Year Olds | 0 (0.0%) | 0 (0.0%) |
| 25 to 34 Year Olds | 0 (0.0%) | 0 (0.0%) |
| 35 Years and over | 0 (0.0%) | 0 (0.0%) |
| Total | 90 (100.0%) | 0 (0.0%) |
Educational Attainment by Field of Study in Andrews
, and business (10 | 100.0%) are the most common fields of study among 10 individuals in Andrews who have obtained a bachelor's degree or higher.
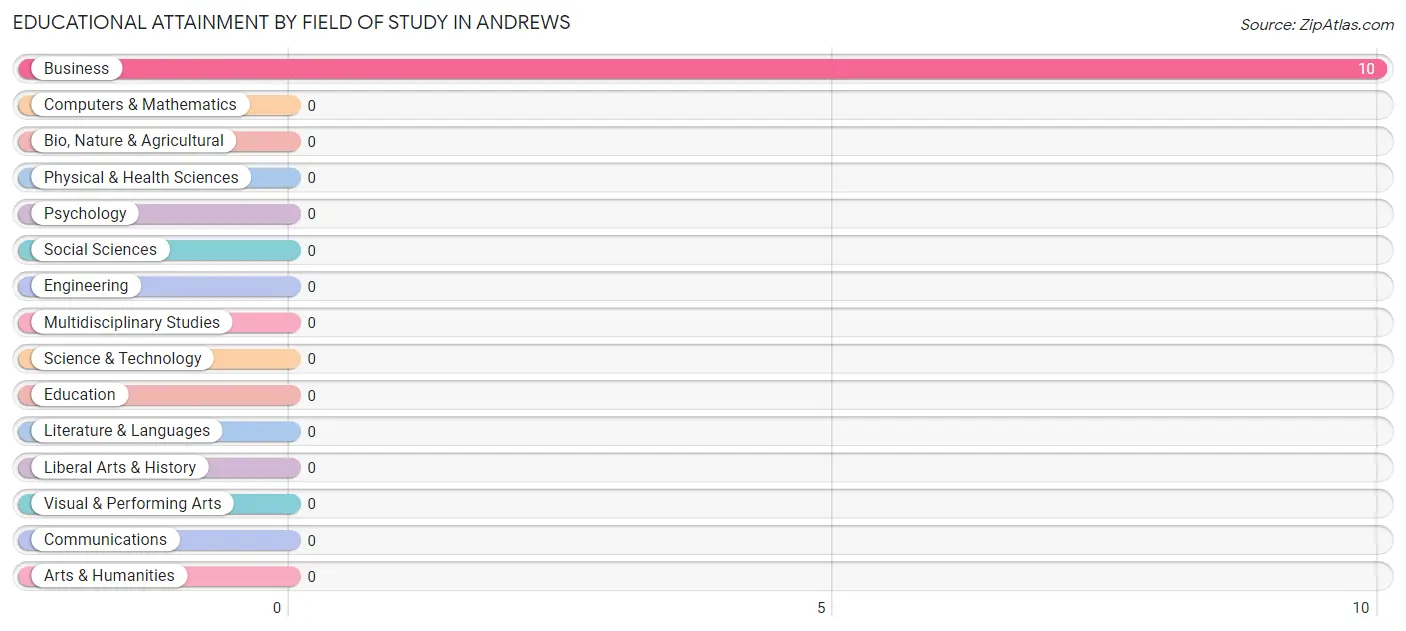
| Field of Study | # Graduates | % Graduates |
| Computers & Mathematics | 0 | 0.0% |
| Bio, Nature & Agricultural | 0 | 0.0% |
| Physical & Health Sciences | 0 | 0.0% |
| Psychology | 0 | 0.0% |
| Social Sciences | 0 | 0.0% |
| Engineering | 0 | 0.0% |
| Multidisciplinary Studies | 0 | 0.0% |
| Science & Technology | 0 | 0.0% |
| Business | 10 | 100.0% |
| Education | 0 | 0.0% |
| Literature & Languages | 0 | 0.0% |
| Liberal Arts & History | 0 | 0.0% |
| Visual & Performing Arts | 0 | 0.0% |
| Communications | 0 | 0.0% |
| Arts & Humanities | 0 | 0.0% |
| Total | 10 | 100.0% |
Transportation & Commute in Andrews
Vehicle Availability by Sex in Andrews
The most prevalent vehicle ownership categories in Andrews are males with 2 vehicles (245, accounting for 81.9%) and females with 2 vehicles (98, making up 111.9%).
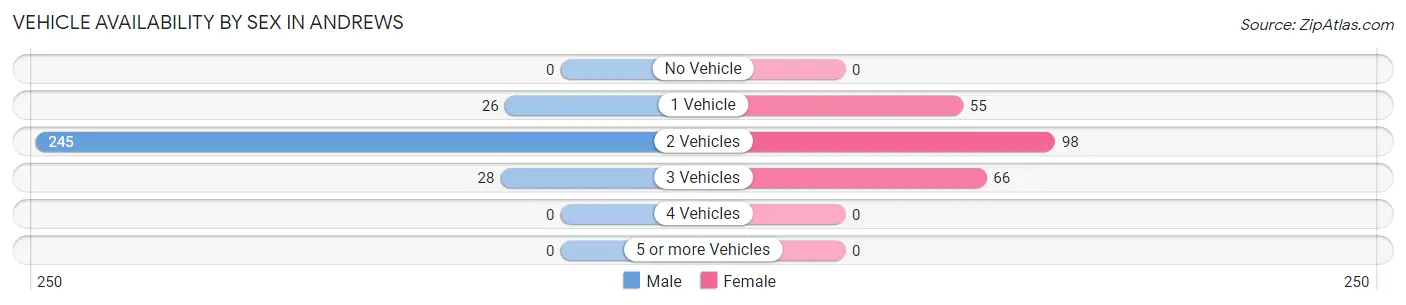
| Vehicles Available | Male | Female |
| No Vehicle | 0 (0.0%) | 0 (0.0%) |
| 1 Vehicle | 26 (8.7%) | 55 (25.1%) |
| 2 Vehicles | 245 (81.9%) | 98 (44.8%) |
| 3 Vehicles | 28 (9.4%) | 66 (30.1%) |
| 4 Vehicles | 0 (0.0%) | 0 (0.0%) |
| 5 or more Vehicles | 0 (0.0%) | 0 (0.0%) |
| Total | 299 (100.0%) | 219 (100.0%) |
Commute Time in Andrews
The most frequently occuring commute durations in Andrews are 40 to 44 minutes (164 commuters, 32.4%), 5 to 9 minutes (80 commuters, 15.8%), and 60 to 89 minutes (69 commuters, 13.6%).
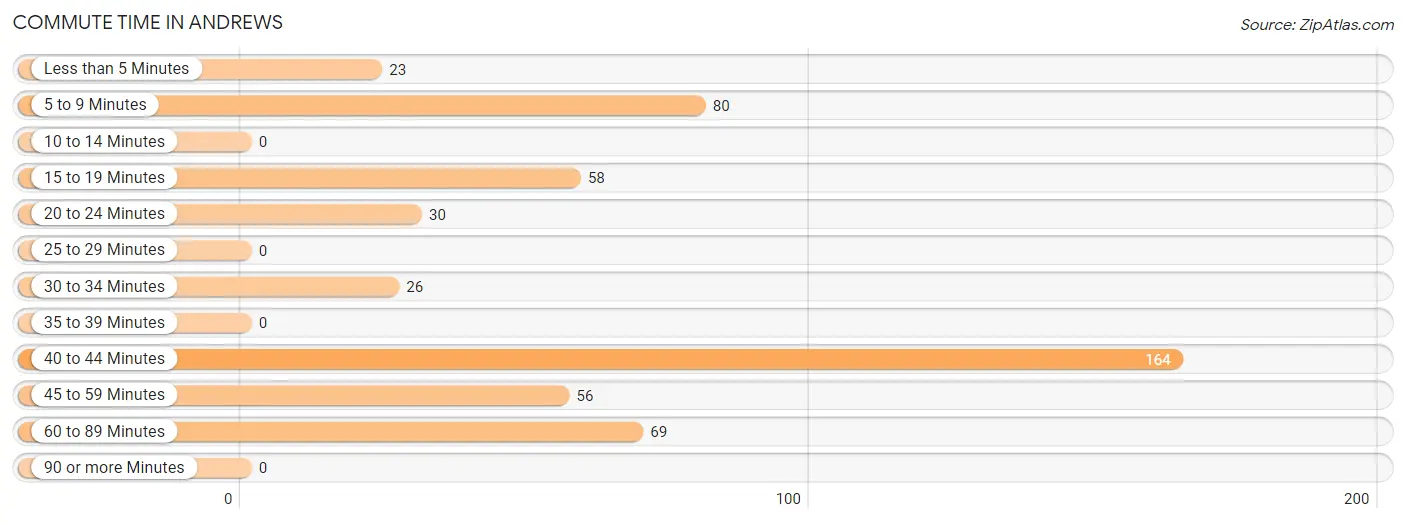
| Commute Time | # Commuters | % Commuters |
| Less than 5 Minutes | 23 | 4.5% |
| 5 to 9 Minutes | 80 | 15.8% |
| 10 to 14 Minutes | 0 | 0.0% |
| 15 to 19 Minutes | 58 | 11.5% |
| 20 to 24 Minutes | 30 | 5.9% |
| 25 to 29 Minutes | 0 | 0.0% |
| 30 to 34 Minutes | 26 | 5.1% |
| 35 to 39 Minutes | 0 | 0.0% |
| 40 to 44 Minutes | 164 | 32.4% |
| 45 to 59 Minutes | 56 | 11.1% |
| 60 to 89 Minutes | 69 | 13.6% |
| 90 or more Minutes | 0 | 0.0% |
Commute Time by Sex in Andrews
The most common commute times in Andrews are 40 to 44 minutes (164 commuters, 54.8%) for males and 45 to 59 minutes (56 commuters, 27.1%) for females.
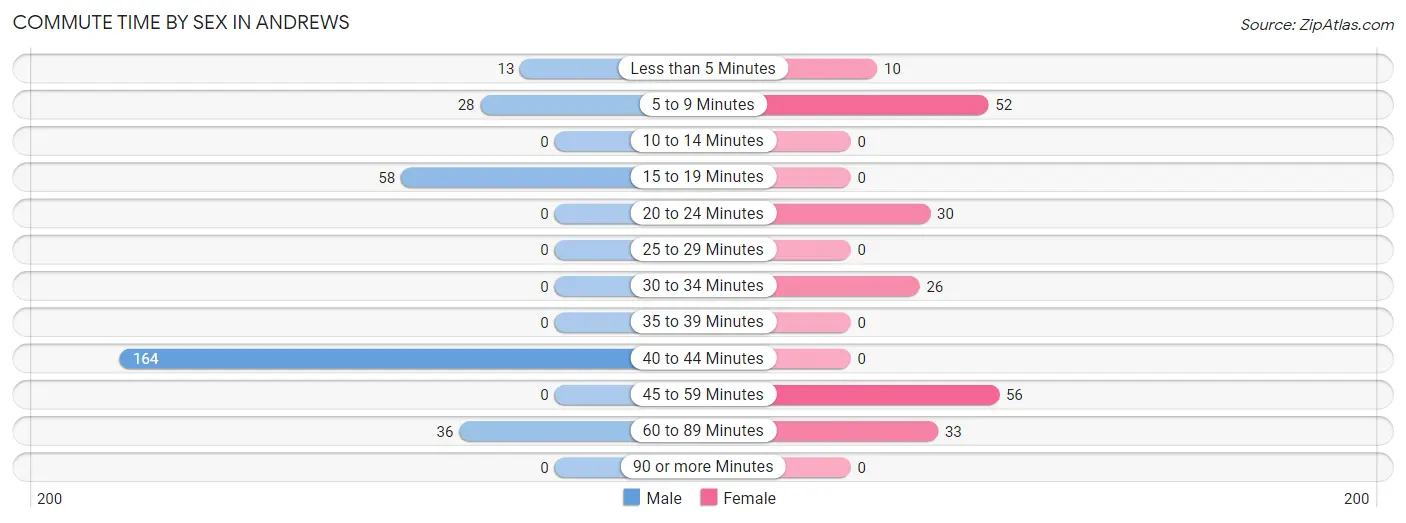
| Commute Time | Male | Female |
| Less than 5 Minutes | 13 (4.3%) | 10 (4.8%) |
| 5 to 9 Minutes | 28 (9.4%) | 52 (25.1%) |
| 10 to 14 Minutes | 0 (0.0%) | 0 (0.0%) |
| 15 to 19 Minutes | 58 (19.4%) | 0 (0.0%) |
| 20 to 24 Minutes | 0 (0.0%) | 30 (14.5%) |
| 25 to 29 Minutes | 0 (0.0%) | 0 (0.0%) |
| 30 to 34 Minutes | 0 (0.0%) | 26 (12.6%) |
| 35 to 39 Minutes | 0 (0.0%) | 0 (0.0%) |
| 40 to 44 Minutes | 164 (54.8%) | 0 (0.0%) |
| 45 to 59 Minutes | 0 (0.0%) | 56 (27.1%) |
| 60 to 89 Minutes | 36 (12.0%) | 33 (15.9%) |
| 90 or more Minutes | 0 (0.0%) | 0 (0.0%) |
Time of Departure to Work by Sex in Andrews
The most frequent times of departure to work in Andrews are 7:00 AM to 7:29 AM (164, 54.8%) for males and 9:00 AM to 9:59 AM (73, 35.3%) for females.
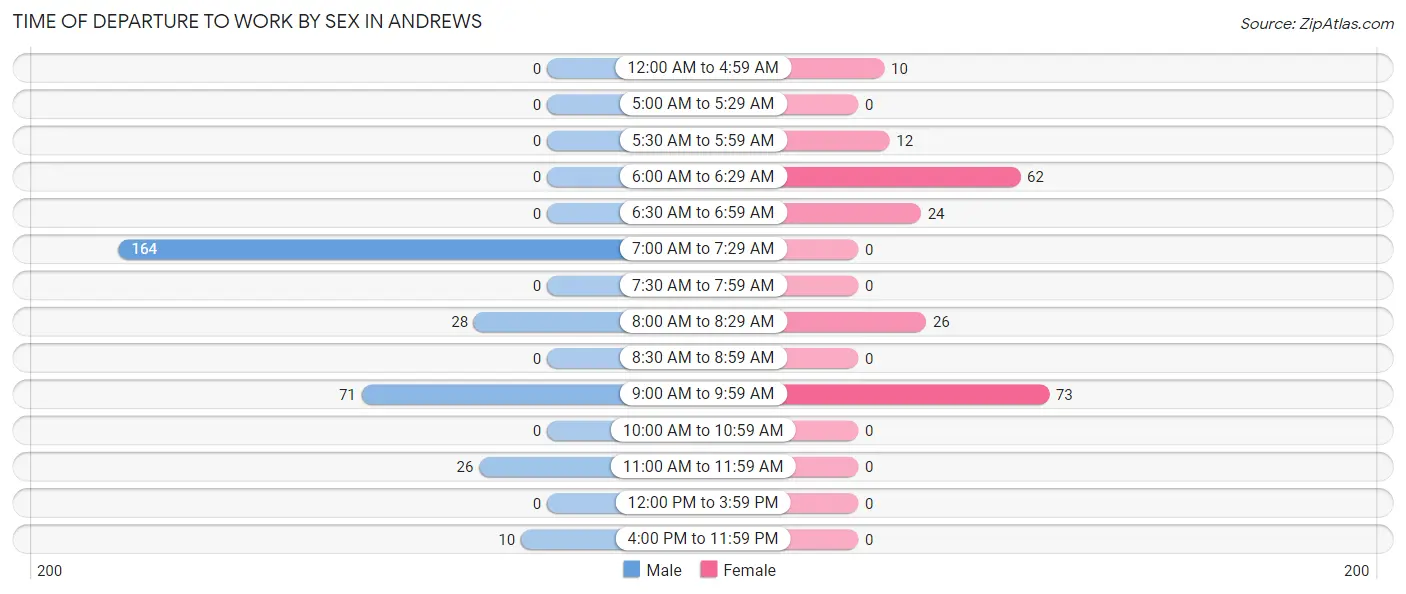
| Time of Departure | Male | Female |
| 12:00 AM to 4:59 AM | 0 (0.0%) | 10 (4.8%) |
| 5:00 AM to 5:29 AM | 0 (0.0%) | 0 (0.0%) |
| 5:30 AM to 5:59 AM | 0 (0.0%) | 12 (5.8%) |
| 6:00 AM to 6:29 AM | 0 (0.0%) | 62 (29.9%) |
| 6:30 AM to 6:59 AM | 0 (0.0%) | 24 (11.6%) |
| 7:00 AM to 7:29 AM | 164 (54.8%) | 0 (0.0%) |
| 7:30 AM to 7:59 AM | 0 (0.0%) | 0 (0.0%) |
| 8:00 AM to 8:29 AM | 28 (9.4%) | 26 (12.6%) |
| 8:30 AM to 8:59 AM | 0 (0.0%) | 0 (0.0%) |
| 9:00 AM to 9:59 AM | 71 (23.7%) | 73 (35.3%) |
| 10:00 AM to 10:59 AM | 0 (0.0%) | 0 (0.0%) |
| 11:00 AM to 11:59 AM | 26 (8.7%) | 0 (0.0%) |
| 12:00 PM to 3:59 PM | 0 (0.0%) | 0 (0.0%) |
| 4:00 PM to 11:59 PM | 10 (3.3%) | 0 (0.0%) |
| Total | 299 (100.0%) | 207 (100.0%) |
Housing Occupancy in Andrews
Occupancy by Ownership in Andrews
Of the total 343 dwellings in Andrews, owner-occupied units account for 266 (77.5%), while renter-occupied units make up 77 (22.5%).
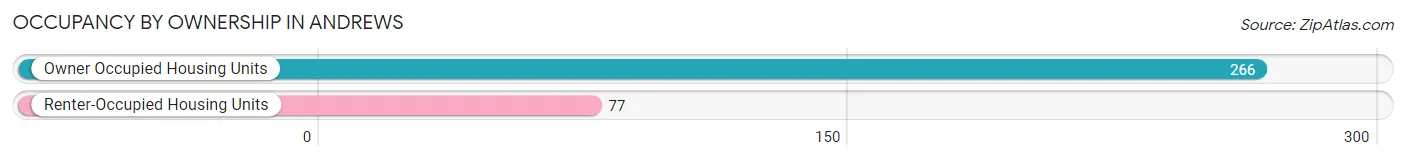
| Occupancy | # Housing Units | % Housing Units |
| Owner Occupied Housing Units | 266 | 77.5% |
| Renter-Occupied Housing Units | 77 | 22.5% |
| Total Occupied Housing Units | 343 | 100.0% |
Occupancy by Household Size in Andrews
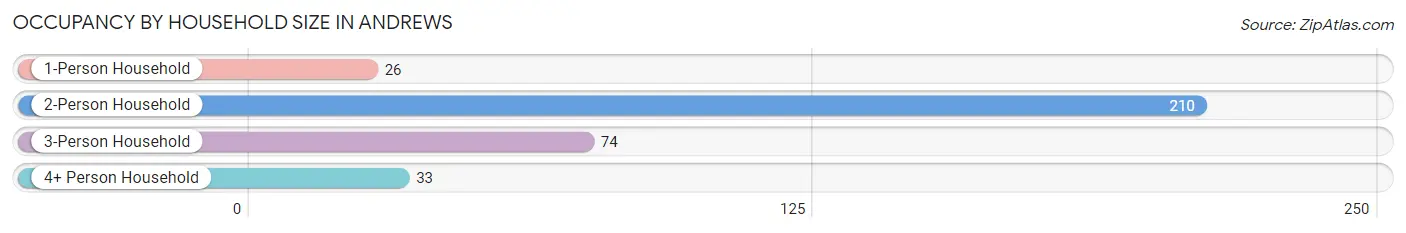
| Household Size | # Housing Units | % Housing Units |
| 1-Person Household | 26 | 7.6% |
| 2-Person Household | 210 | 61.2% |
| 3-Person Household | 74 | 21.6% |
| 4+ Person Household | 33 | 9.6% |
| Total Housing Units | 343 | 100.0% |
Occupancy by Ownership by Household Size in Andrews
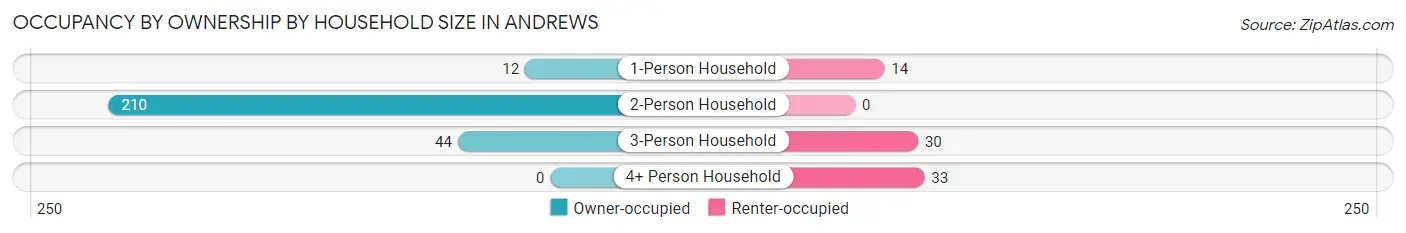
| Household Size | Owner-occupied | Renter-occupied |
| 1-Person Household | 12 (46.2%) | 14 (53.8%) |
| 2-Person Household | 210 (100.0%) | 0 (0.0%) |
| 3-Person Household | 44 (59.5%) | 30 (40.5%) |
| 4+ Person Household | 0 (0.0%) | 33 (100.0%) |
| Total Housing Units | 266 (77.5%) | 77 (22.5%) |
Occupancy by Educational Attainment in Andrews
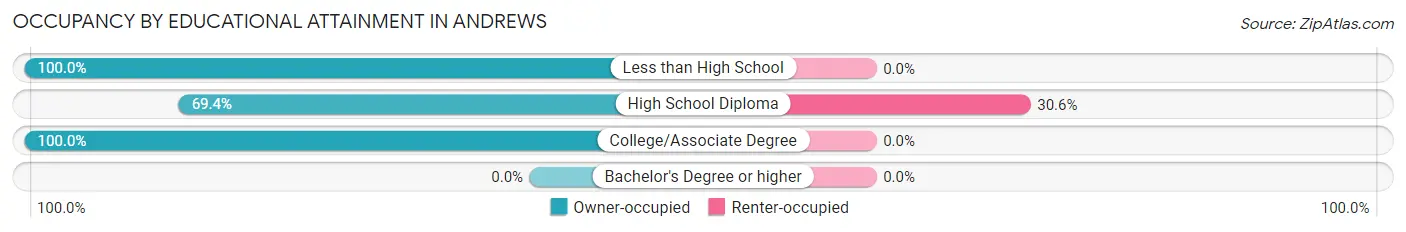
| Household Size | Owner-occupied | Renter-occupied |
| Less than High School | 7 (100.0%) | 0 (0.0%) |
| High School Diploma | 175 (69.4%) | 77 (30.6%) |
| College/Associate Degree | 84 (100.0%) | 0 (0.0%) |
| Bachelor's Degree or higher | 0 (0.0%) | 0 (0.0%) |
Occupancy by Age of Householder in Andrews
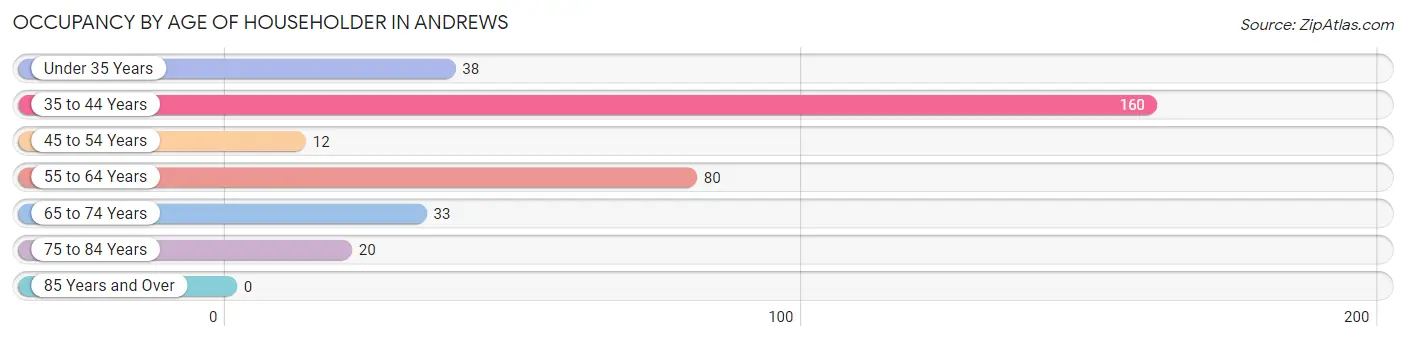
| Age Bracket | # Households | % Households |
| Under 35 Years | 38 | 11.1% |
| 35 to 44 Years | 160 | 46.7% |
| 45 to 54 Years | 12 | 3.5% |
| 55 to 64 Years | 80 | 23.3% |
| 65 to 74 Years | 33 | 9.6% |
| 75 to 84 Years | 20 | 5.8% |
| 85 Years and Over | 0 | 0.0% |
| Total | 343 | 100.0% |
Housing Finances in Andrews
Median Income by Occupancy in Andrews
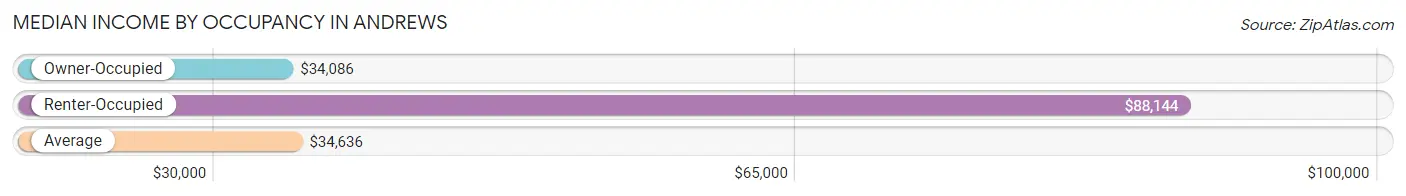
| Occupancy Type | # Households | Median Income |
| Owner-Occupied | 266 (77.5%) | $34,086 |
| Renter-Occupied | 77 (22.5%) | $88,144 |
| Average | 343 (100.0%) | $34,636 |
Occupancy by Householder Income Bracket in Andrews
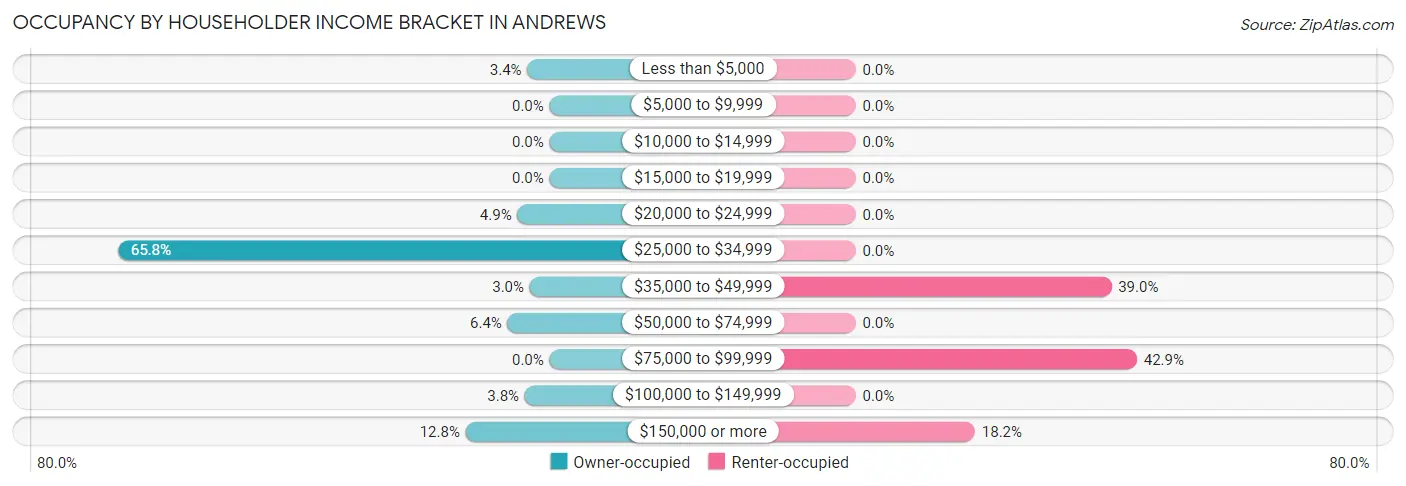
| Income Bracket | Owner-occupied | Renter-occupied |
| Less than $5,000 | 9 (3.4%) | 0 (0.0%) |
| $5,000 to $9,999 | 0 (0.0%) | 0 (0.0%) |
| $10,000 to $14,999 | 0 (0.0%) | 0 (0.0%) |
| $15,000 to $19,999 | 0 (0.0%) | 0 (0.0%) |
| $20,000 to $24,999 | 13 (4.9%) | 0 (0.0%) |
| $25,000 to $34,999 | 175 (65.8%) | 0 (0.0%) |
| $35,000 to $49,999 | 8 (3.0%) | 30 (39.0%) |
| $50,000 to $74,999 | 17 (6.4%) | 0 (0.0%) |
| $75,000 to $99,999 | 0 (0.0%) | 33 (42.9%) |
| $100,000 to $149,999 | 10 (3.8%) | 0 (0.0%) |
| $150,000 or more | 34 (12.8%) | 14 (18.2%) |
| Total | 266 (100.0%) | 77 (100.0%) |
Monthly Housing Cost Tiers in Andrews
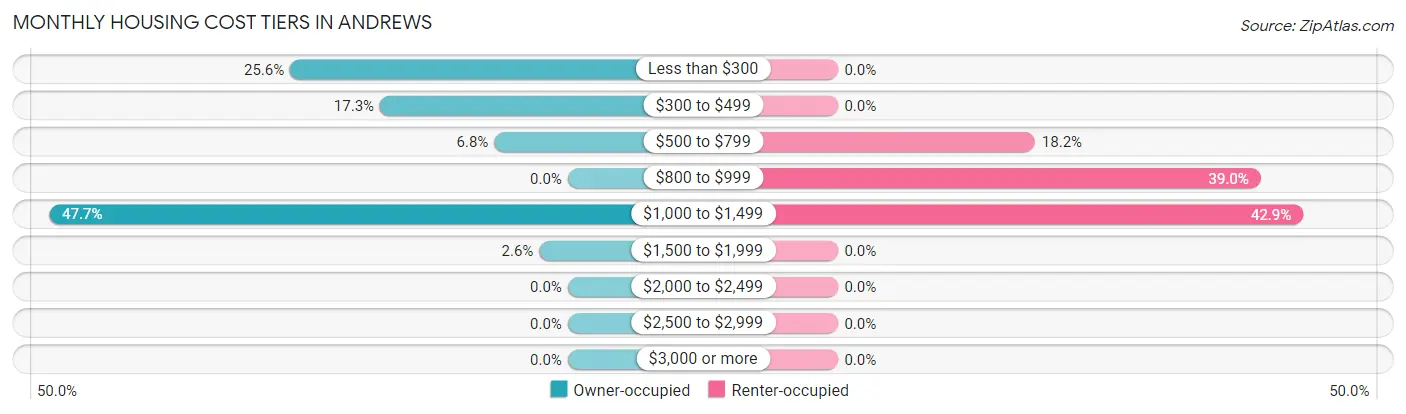
| Monthly Cost | Owner-occupied | Renter-occupied |
| Less than $300 | 68 (25.6%) | 0 (0.0%) |
| $300 to $499 | 46 (17.3%) | 0 (0.0%) |
| $500 to $799 | 18 (6.8%) | 14 (18.2%) |
| $800 to $999 | 0 (0.0%) | 30 (39.0%) |
| $1,000 to $1,499 | 127 (47.7%) | 33 (42.9%) |
| $1,500 to $1,999 | 7 (2.6%) | 0 (0.0%) |
| $2,000 to $2,499 | 0 (0.0%) | 0 (0.0%) |
| $2,500 to $2,999 | 0 (0.0%) | 0 (0.0%) |
| $3,000 or more | 0 (0.0%) | 0 (0.0%) |
| Total | 266 (100.0%) | 77 (100.0%) |
Physical Housing Characteristics in Andrews
Housing Structures in Andrews
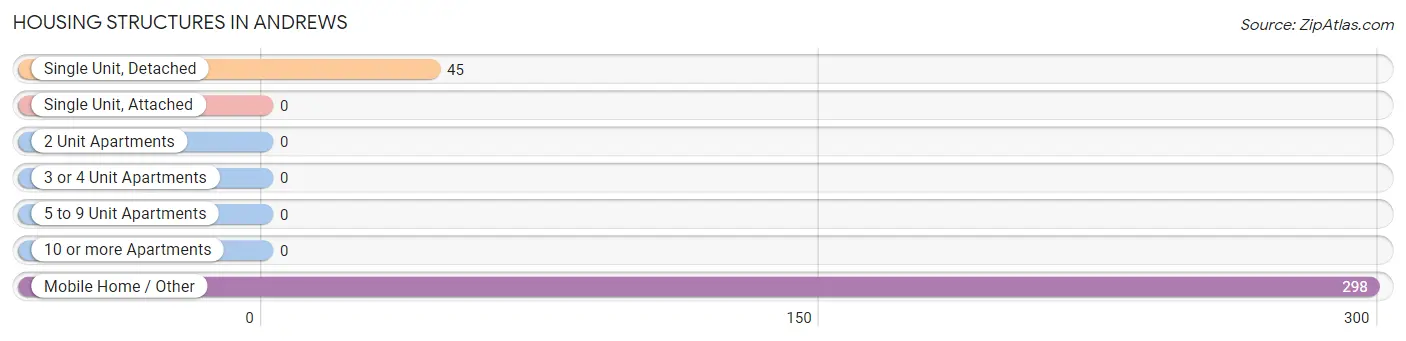
| Structure Type | # Housing Units | % Housing Units |
| Single Unit, Detached | 45 | 13.1% |
| Single Unit, Attached | 0 | 0.0% |
| 2 Unit Apartments | 0 | 0.0% |
| 3 or 4 Unit Apartments | 0 | 0.0% |
| 5 to 9 Unit Apartments | 0 | 0.0% |
| 10 or more Apartments | 0 | 0.0% |
| Mobile Home / Other | 298 | 86.9% |
| Total | 343 | 100.0% |
Housing Structures by Occupancy in Andrews
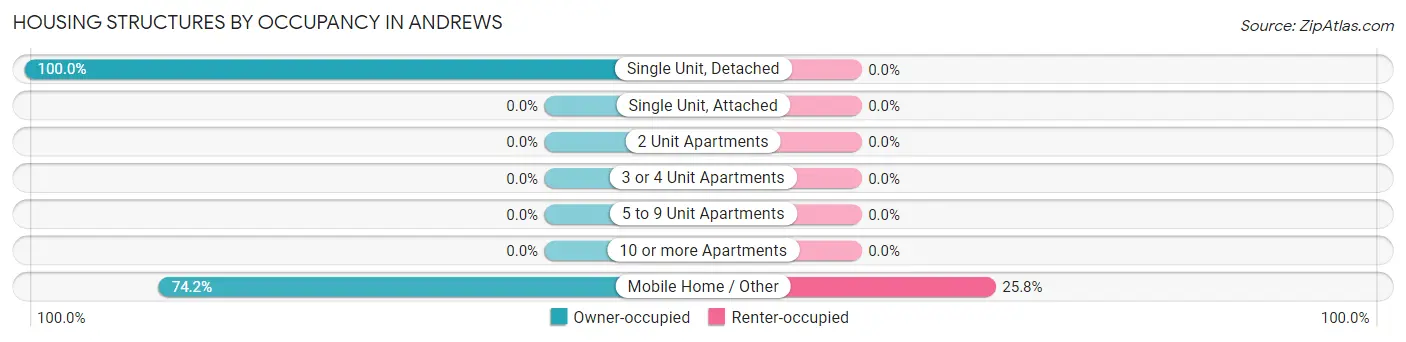
| Structure Type | Owner-occupied | Renter-occupied |
| Single Unit, Detached | 45 (100.0%) | 0 (0.0%) |
| Single Unit, Attached | 0 (0.0%) | 0 (0.0%) |
| 2 Unit Apartments | 0 (0.0%) | 0 (0.0%) |
| 3 or 4 Unit Apartments | 0 (0.0%) | 0 (0.0%) |
| 5 to 9 Unit Apartments | 0 (0.0%) | 0 (0.0%) |
| 10 or more Apartments | 0 (0.0%) | 0 (0.0%) |
| Mobile Home / Other | 221 (74.2%) | 77 (25.8%) |
| Total | 266 (77.5%) | 77 (22.5%) |
Housing Structures by Number of Rooms in Andrews
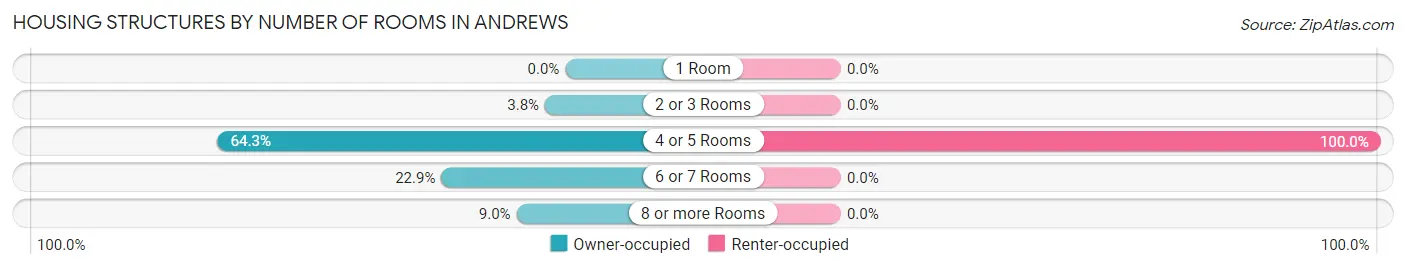
| Number of Rooms | Owner-occupied | Renter-occupied |
| 1 Room | 0 (0.0%) | 0 (0.0%) |
| 2 or 3 Rooms | 10 (3.8%) | 0 (0.0%) |
| 4 or 5 Rooms | 171 (64.3%) | 77 (100.0%) |
| 6 or 7 Rooms | 61 (22.9%) | 0 (0.0%) |
| 8 or more Rooms | 24 (9.0%) | 0 (0.0%) |
| Total | 266 (100.0%) | 77 (100.0%) |
Housing Structure by Heating Type in Andrews
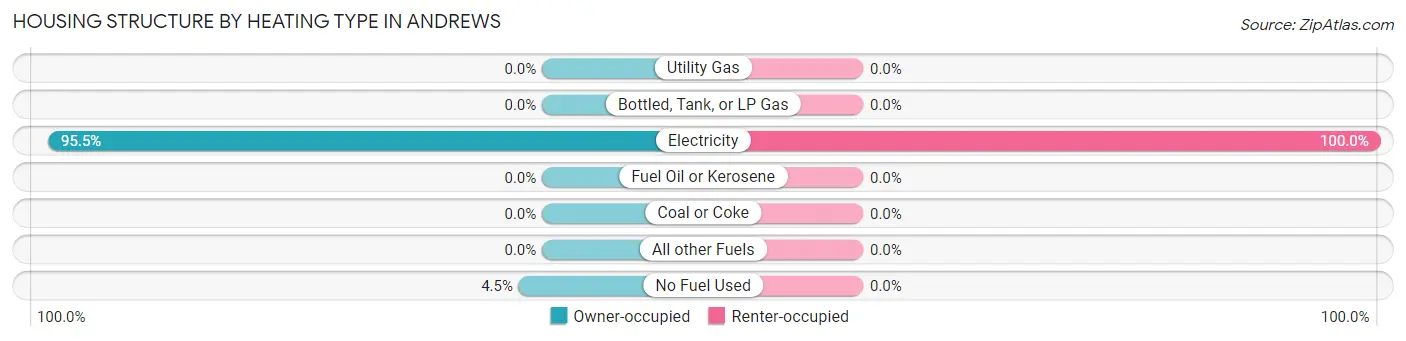
| Heating Type | Owner-occupied | Renter-occupied |
| Utility Gas | 0 (0.0%) | 0 (0.0%) |
| Bottled, Tank, or LP Gas | 0 (0.0%) | 0 (0.0%) |
| Electricity | 254 (95.5%) | 77 (100.0%) |
| Fuel Oil or Kerosene | 0 (0.0%) | 0 (0.0%) |
| Coal or Coke | 0 (0.0%) | 0 (0.0%) |
| All other Fuels | 0 (0.0%) | 0 (0.0%) |
| No Fuel Used | 12 (4.5%) | 0 (0.0%) |
| Total | 266 (100.0%) | 77 (100.0%) |
Household Vehicle Usage in Andrews
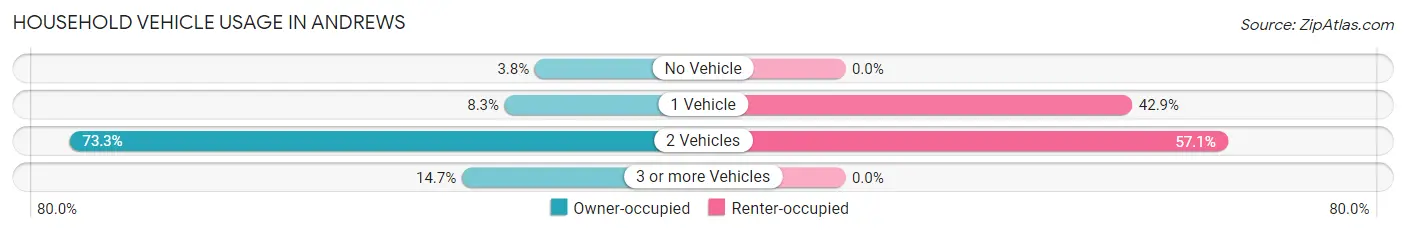
| Vehicles per Household | Owner-occupied | Renter-occupied |
| No Vehicle | 10 (3.8%) | 0 (0.0%) |
| 1 Vehicle | 22 (8.3%) | 33 (42.9%) |
| 2 Vehicles | 195 (73.3%) | 44 (57.1%) |
| 3 or more Vehicles | 39 (14.7%) | 0 (0.0%) |
| Total | 266 (100.0%) | 77 (100.0%) |
Real Estate & Mortgages in Andrews
Real Estate and Mortgage Overview in Andrews
| Characteristic | Without Mortgage | With Mortgage |
| Housing Units | 124 | 142 |
| Median Property Value | $56,300 | $111,800 |
| Median Household Income | - | - |
| Monthly Housing Costs | $275 | $0 |
| Real Estate Taxes | $833 | $8 |
Property Value by Mortgage Status in Andrews
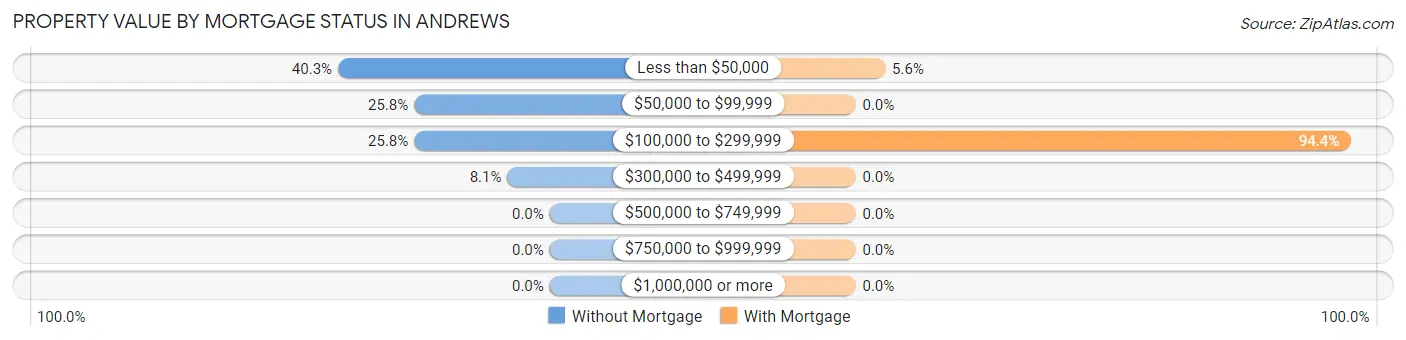
| Property Value | Without Mortgage | With Mortgage |
| Less than $50,000 | 50 (40.3%) | 8 (5.6%) |
| $50,000 to $99,999 | 32 (25.8%) | 0 (0.0%) |
| $100,000 to $299,999 | 32 (25.8%) | 134 (94.4%) |
| $300,000 to $499,999 | 10 (8.1%) | 0 (0.0%) |
| $500,000 to $749,999 | 0 (0.0%) | 0 (0.0%) |
| $750,000 to $999,999 | 0 (0.0%) | 0 (0.0%) |
| $1,000,000 or more | 0 (0.0%) | 0 (0.0%) |
| Total | 124 (100.0%) | 142 (100.0%) |
Household Income by Mortgage Status in Andrews
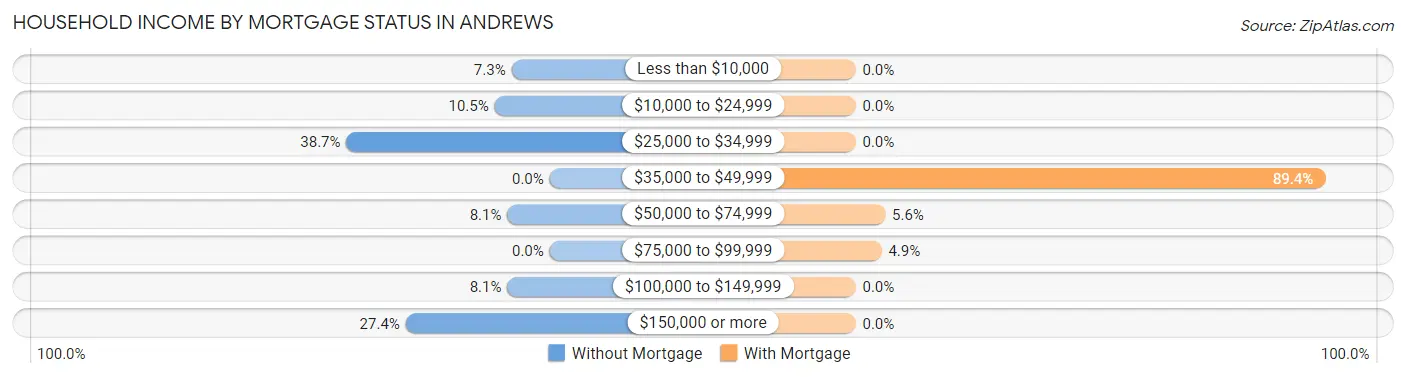
| Household Income | Without Mortgage | With Mortgage |
| Less than $10,000 | 9 (7.3%) | 0 (0.0%) |
| $10,000 to $24,999 | 13 (10.5%) | 0 (0.0%) |
| $25,000 to $34,999 | 48 (38.7%) | 0 (0.0%) |
| $35,000 to $49,999 | 0 (0.0%) | 127 (89.4%) |
| $50,000 to $74,999 | 10 (8.1%) | 8 (5.6%) |
| $75,000 to $99,999 | 0 (0.0%) | 7 (4.9%) |
| $100,000 to $149,999 | 10 (8.1%) | 0 (0.0%) |
| $150,000 or more | 34 (27.4%) | 0 (0.0%) |
| Total | 124 (100.0%) | 142 (100.0%) |
Property Value to Household Income Ratio in Andrews
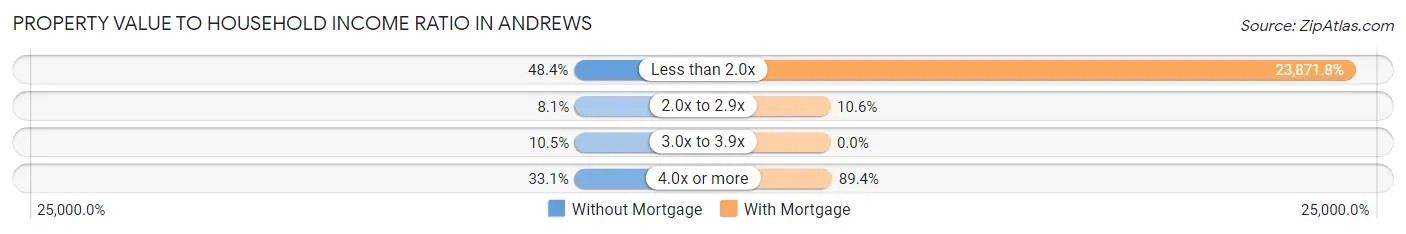
| Value-to-Income Ratio | Without Mortgage | With Mortgage |
| Less than 2.0x | 60 (48.4%) | 33,898 (23,871.8%) |
| 2.0x to 2.9x | 10 (8.1%) | 15 (10.6%) |
| 3.0x to 3.9x | 13 (10.5%) | 0 (0.0%) |
| 4.0x or more | 41 (33.1%) | 127 (89.4%) |
| Total | 124 (100.0%) | 142 (100.0%) |
Real Estate Taxes by Mortgage Status in Andrews
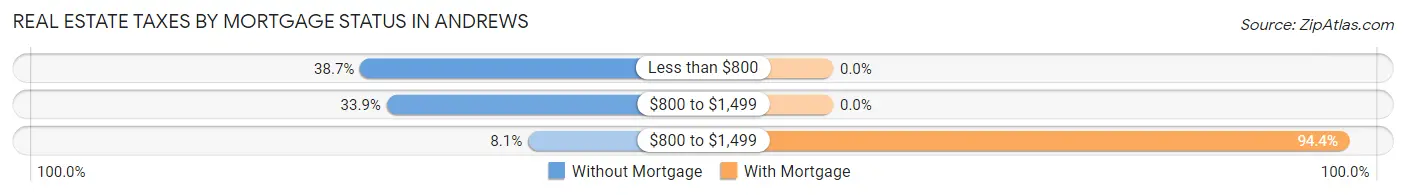
| Property Taxes | Without Mortgage | With Mortgage |
| Less than $800 | 48 (38.7%) | 0 (0.0%) |
| $800 to $1,499 | 42 (33.9%) | 0 (0.0%) |
| $800 to $1,499 | 10 (8.1%) | 134 (94.4%) |
| Total | 124 (100.0%) | 142 (100.0%) |
Health & Disability in Andrews
Health Insurance Coverage by Age in Andrews
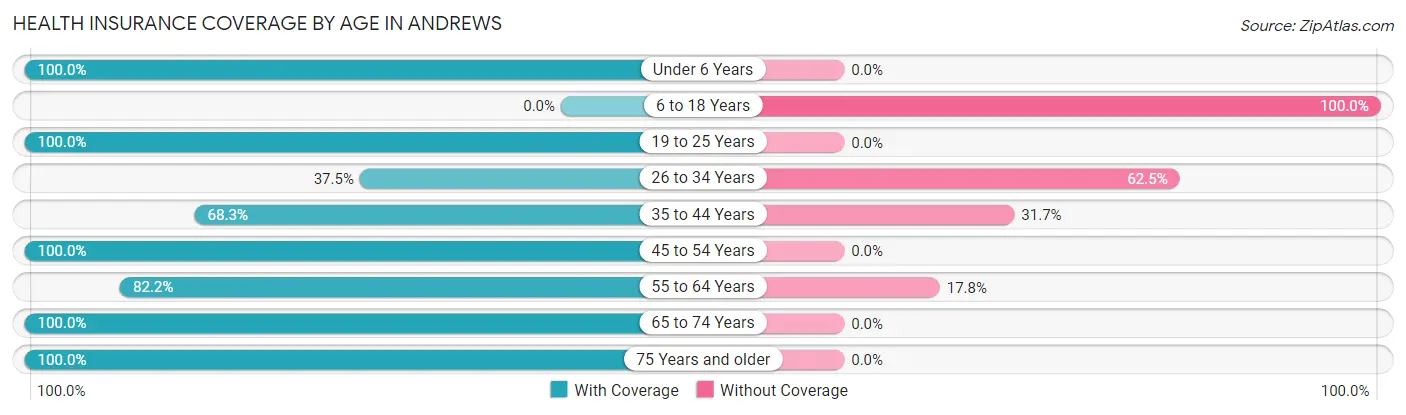
| Age Bracket | With Coverage | Without Coverage |
| Under 6 Years | 28 (100.0%) | 0 (0.0%) |
| 6 to 18 Years | 0 (0.0%) | 90 (100.0%) |
| 19 to 25 Years | 120 (100.0%) | 0 (0.0%) |
| 26 to 34 Years | 18 (37.5%) | 30 (62.5%) |
| 35 to 44 Years | 127 (68.3%) | 59 (31.7%) |
| 45 to 54 Years | 202 (100.0%) | 0 (0.0%) |
| 55 to 64 Years | 120 (82.2%) | 26 (17.8%) |
| 65 to 74 Years | 72 (100.0%) | 0 (0.0%) |
| 75 Years and older | 52 (100.0%) | 0 (0.0%) |
| Total | 739 (78.3%) | 205 (21.7%) |
Health Insurance Coverage by Citizenship Status in Andrews
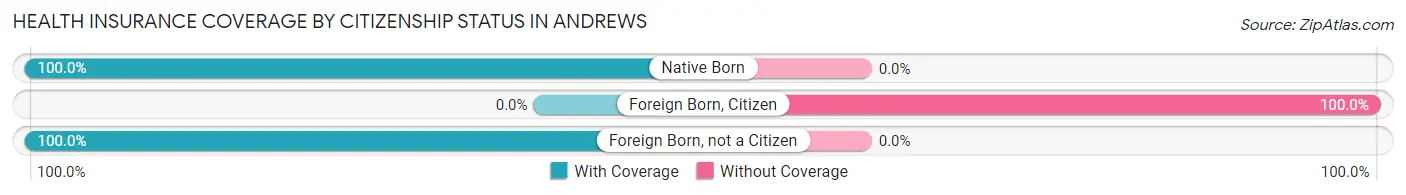
| Citizenship Status | With Coverage | Without Coverage |
| Native Born | 28 (100.0%) | 0 (0.0%) |
| Foreign Born, Citizen | 0 (0.0%) | 90 (100.0%) |
| Foreign Born, not a Citizen | 120 (100.0%) | 0 (0.0%) |
Health Insurance Coverage by Household Income in Andrews
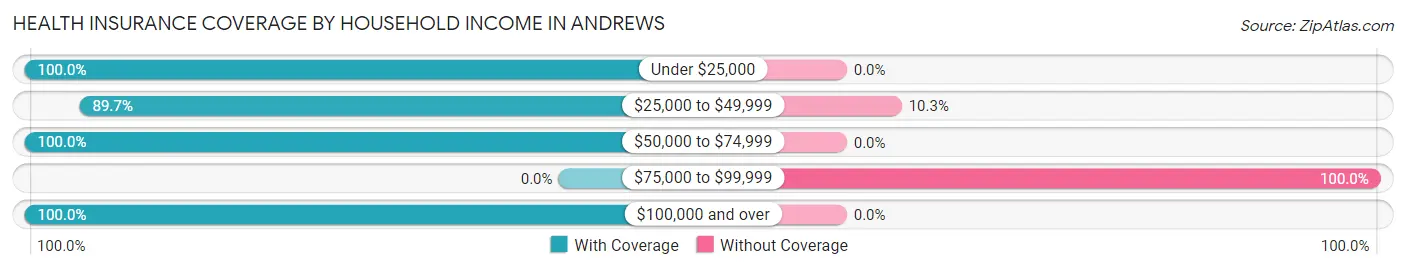
| Household Income | With Coverage | Without Coverage |
| Under $25,000 | 47 (100.0%) | 0 (0.0%) |
| $25,000 to $49,999 | 488 (89.7%) | 56 (10.3%) |
| $50,000 to $74,999 | 55 (100.0%) | 0 (0.0%) |
| $75,000 to $99,999 | 0 (0.0%) | 149 (100.0%) |
| $100,000 and over | 149 (100.0%) | 0 (0.0%) |
Public vs Private Health Insurance Coverage by Age in Andrews
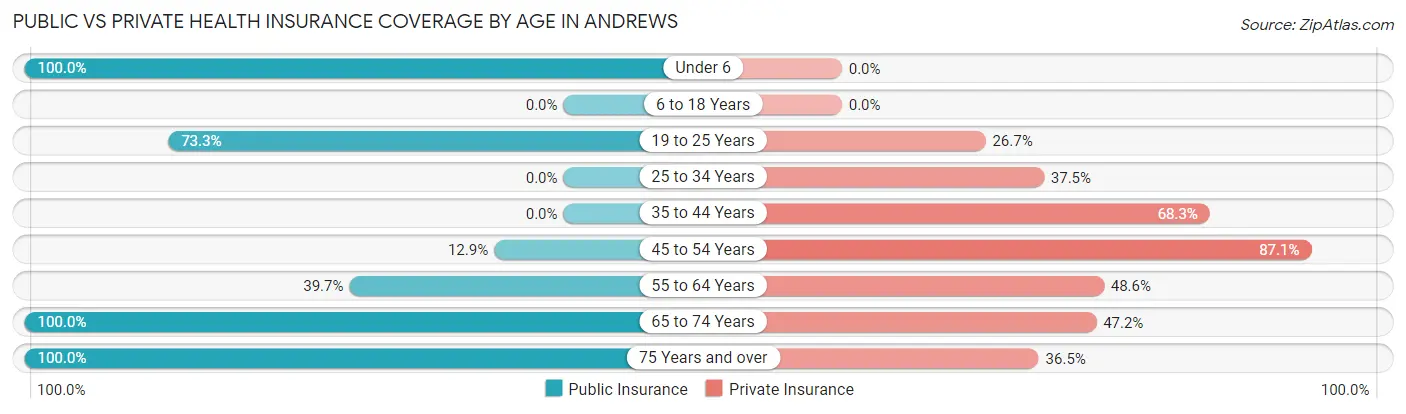
| Age Bracket | Public Insurance | Private Insurance |
| Under 6 | 28 (100.0%) | 0 (0.0%) |
| 6 to 18 Years | 0 (0.0%) | 0 (0.0%) |
| 19 to 25 Years | 88 (73.3%) | 32 (26.7%) |
| 25 to 34 Years | 0 (0.0%) | 18 (37.5%) |
| 35 to 44 Years | 0 (0.0%) | 127 (68.3%) |
| 45 to 54 Years | 26 (12.9%) | 176 (87.1%) |
| 55 to 64 Years | 58 (39.7%) | 71 (48.6%) |
| 65 to 74 Years | 72 (100.0%) | 34 (47.2%) |
| 75 Years and over | 52 (100.0%) | 19 (36.5%) |
| Total | 324 (34.3%) | 477 (50.5%) |
Disability Status by Sex by Age in Andrews
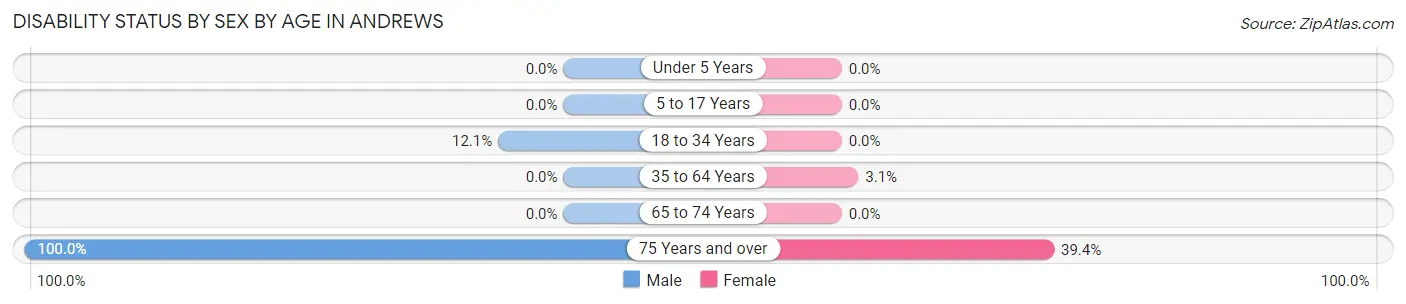
| Age Bracket | Male | Female |
| Under 5 Years | 0 (0.0%) | 0 (0.0%) |
| 5 to 17 Years | 0 (0.0%) | 0 (0.0%) |
| 18 to 34 Years | 8 (12.1%) | 0 (0.0%) |
| 35 to 64 Years | 0 (0.0%) | 9 (3.1%) |
| 65 to 74 Years | 0 (0.0%) | 0 (0.0%) |
| 75 Years and over | 19 (100.0%) | 13 (39.4%) |
Disability Class by Sex by Age in Andrews
Disability Class: Hearing Difficulty
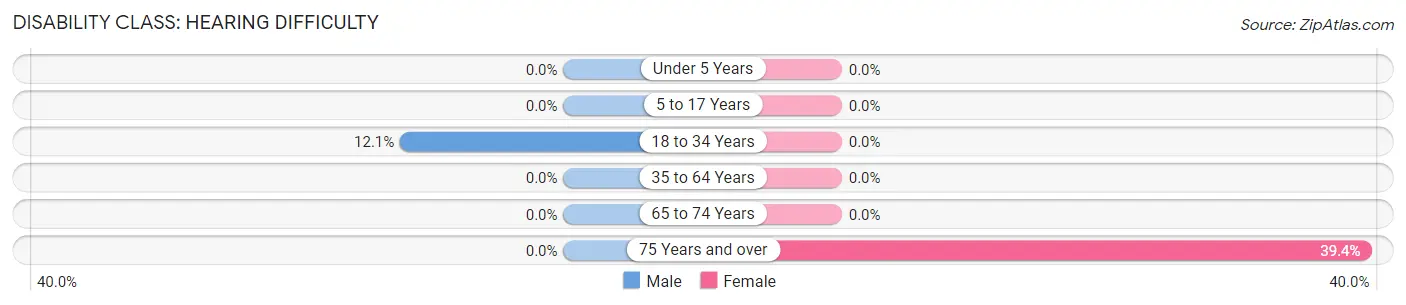
| Age Bracket | Male | Female |
| Under 5 Years | 0 (0.0%) | 0 (0.0%) |
| 5 to 17 Years | 0 (0.0%) | 0 (0.0%) |
| 18 to 34 Years | 8 (12.1%) | 0 (0.0%) |
| 35 to 64 Years | 0 (0.0%) | 0 (0.0%) |
| 65 to 74 Years | 0 (0.0%) | 0 (0.0%) |
| 75 Years and over | 0 (0.0%) | 13 (39.4%) |
Disability Class: Vision Difficulty
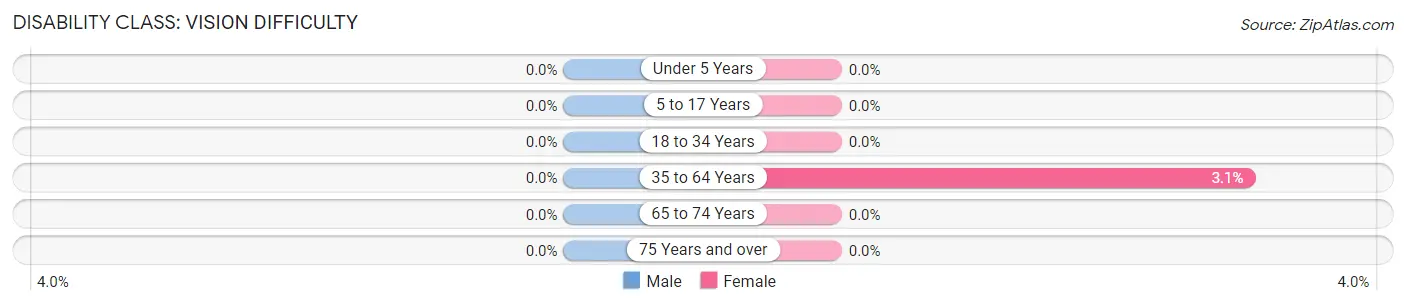
| Age Bracket | Male | Female |
| Under 5 Years | 0 (0.0%) | 0 (0.0%) |
| 5 to 17 Years | 0 (0.0%) | 0 (0.0%) |
| 18 to 34 Years | 0 (0.0%) | 0 (0.0%) |
| 35 to 64 Years | 0 (0.0%) | 9 (3.1%) |
| 65 to 74 Years | 0 (0.0%) | 0 (0.0%) |
| 75 Years and over | 0 (0.0%) | 0 (0.0%) |
Disability Class: Cognitive Difficulty
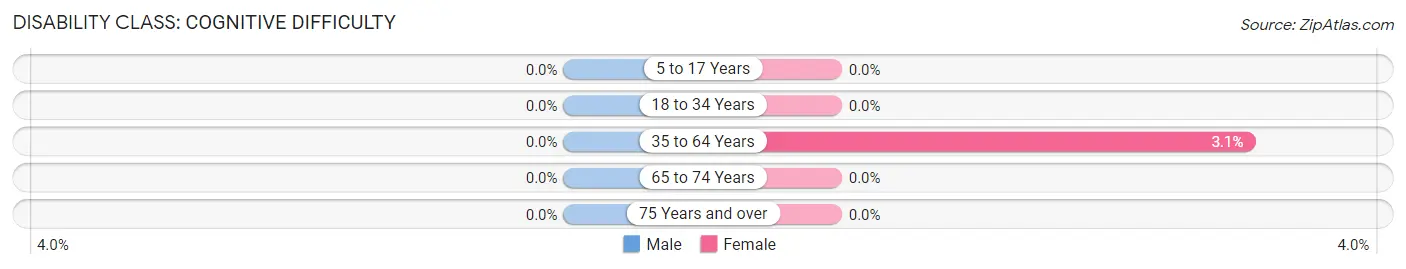
| Age Bracket | Male | Female |
| 5 to 17 Years | 0 (0.0%) | 0 (0.0%) |
| 18 to 34 Years | 0 (0.0%) | 0 (0.0%) |
| 35 to 64 Years | 0 (0.0%) | 9 (3.1%) |
| 65 to 74 Years | 0 (0.0%) | 0 (0.0%) |
| 75 Years and over | 0 (0.0%) | 0 (0.0%) |
Disability Class: Ambulatory Difficulty
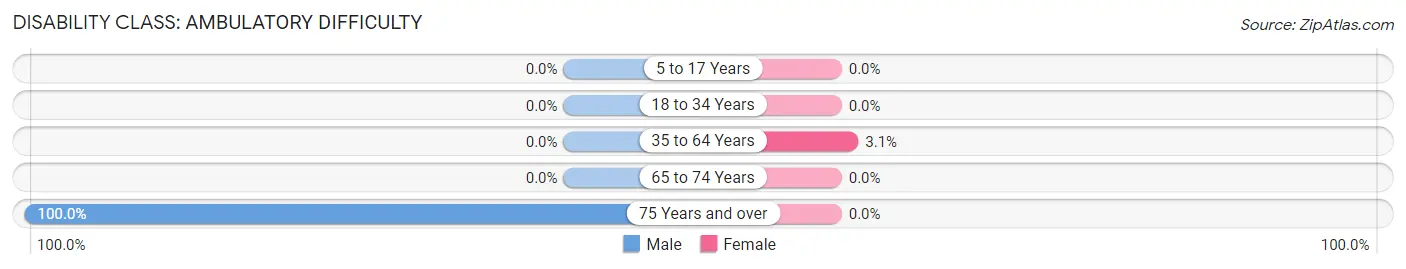
| Age Bracket | Male | Female |
| 5 to 17 Years | 0 (0.0%) | 0 (0.0%) |
| 18 to 34 Years | 0 (0.0%) | 0 (0.0%) |
| 35 to 64 Years | 0 (0.0%) | 9 (3.1%) |
| 65 to 74 Years | 0 (0.0%) | 0 (0.0%) |
| 75 Years and over | 19 (100.0%) | 0 (0.0%) |
Disability Class: Self-Care Difficulty
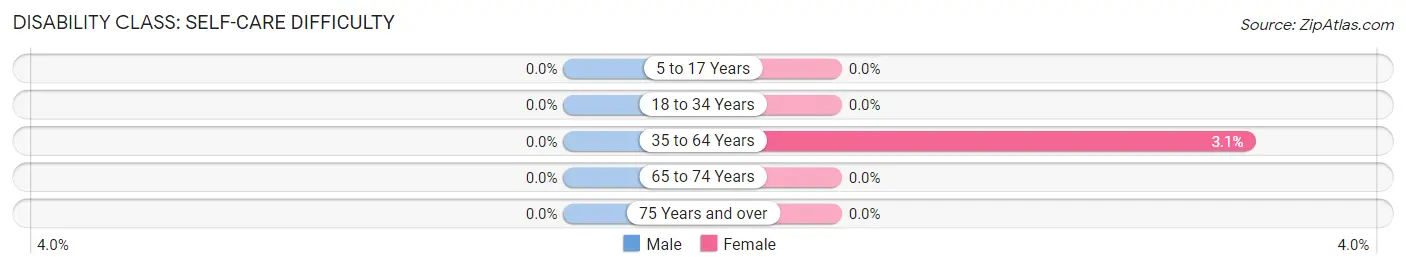
| Age Bracket | Male | Female |
| 5 to 17 Years | 0 (0.0%) | 0 (0.0%) |
| 18 to 34 Years | 0 (0.0%) | 0 (0.0%) |
| 35 to 64 Years | 0 (0.0%) | 9 (3.1%) |
| 65 to 74 Years | 0 (0.0%) | 0 (0.0%) |
| 75 Years and over | 0 (0.0%) | 0 (0.0%) |
Technology Access in Andrews
Computing Device Access in Andrews
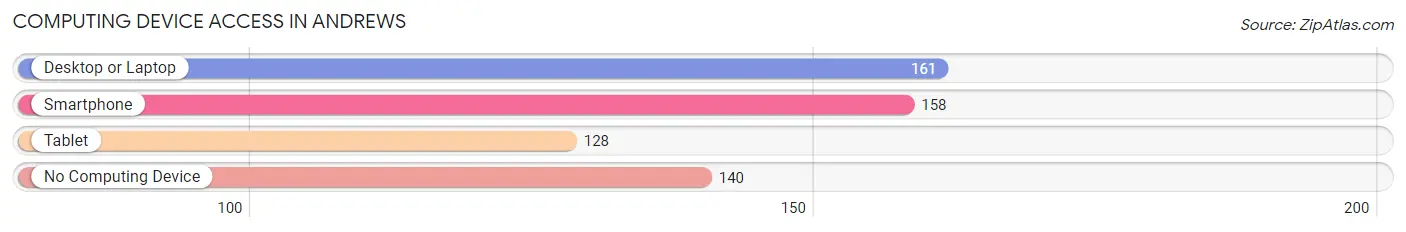
| Device Type | # Households | % Households |
| Desktop or Laptop | 161 | 46.9% |
| Smartphone | 158 | 46.1% |
| Tablet | 128 | 37.3% |
| No Computing Device | 140 | 40.8% |
| Total | 343 | 100.0% |
Internet Access in Andrews
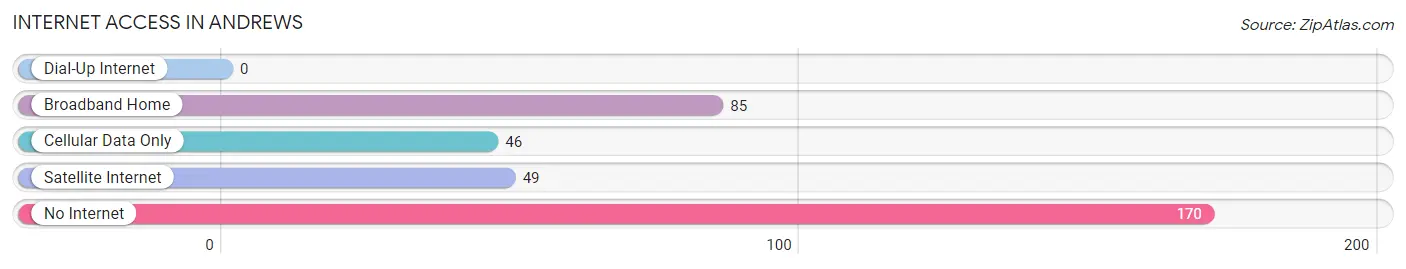
| Internet Type | # Households | % Households |
| Dial-Up Internet | 0 | 0.0% |
| Broadband Home | 85 | 24.8% |
| Cellular Data Only | 46 | 13.4% |
| Satellite Internet | 49 | 14.3% |
| No Internet | 170 | 49.6% |
| Total | 343 | 100.0% |
Andrews Summary
History
Andrews is a small town located in the panhandle of Florida, in the county of Calhoun. It was founded in 1854 by a group of settlers from Georgia, led by William Andrews. The town was named after him, and it was the first settlement in the county.
The town was originally a farming community, and the main crops were cotton, corn, and peanuts. The town also had a sawmill and a gristmill, which were important for the local economy.
In the late 19th century, the town began to grow and develop. The railroad came to Andrews in 1883, and this helped to increase the population and the economy. The town also had a post office, a bank, and a hotel.
In the early 20th century, the town continued to grow and develop. The population increased, and the economy diversified. The town had a number of businesses, including a lumber mill, a cotton gin, and a canning factory.
In the 1950s, the town began to decline. The railroad stopped running, and the population began to decline. The town was also affected by the Great Depression, and many of the businesses closed.
In the late 20th century, the town began to recover. The population began to increase, and the economy began to diversify. The town now has a number of businesses, including a grocery store, a hardware store, and a restaurant.
Geography
Andrews is located in the panhandle of Florida, in the county of Calhoun. The town is situated on the banks of the Apalachicola River, and it is surrounded by forests and wetlands. The town is located about 30 miles from the Gulf of Mexico.
The climate in Andrews is humid subtropical, with hot summers and mild winters. The average temperature in the summer is around 90 degrees Fahrenheit, and the average temperature in the winter is around 60 degrees Fahrenheit.
The town is located in a rural area, and it is surrounded by farms and forests. The town is also located near several state parks, including Apalachicola National Forest and Torreya State Park.
Economy
The economy of Andrews is largely based on agriculture and tourism. The town is home to a number of farms, and the main crops are cotton, corn, and peanuts. The town also has a number of businesses, including a grocery store, a hardware store, and a restaurant.
The town is also a popular tourist destination. The town is located near several state parks, and it is also close to the Gulf of Mexico. The town has a number of attractions, including a museum, a historic district, and a number of parks.
Demographics
As of the 2010 census, the population of Andrews was 1,845. The town has a population density of 5.3 people per square mile. The median age in the town is 44.7 years, and the median household income is $31,250.
The town is predominantly white, with 87.3% of the population being white. The town also has a small Hispanic population, with 8.3% of the population being Hispanic. The town also has a small African American population, with 2.2% of the population being African American.
Conclusion
Andrews is a small town located in the panhandle of Florida, in the county of Calhoun. The town was founded in 1854, and it was originally a farming community. In the late 20th century, the town began to recover, and the population began to increase. The economy of Andrews is largely based on agriculture and tourism, and the town is a popular tourist destination. The population of Andrews is predominantly white, with 87.3% of the population being white.
Common Questions
What is Per Capita Income in Andrews?
Per Capita income in Andrews is $26,139.
What is the Median Family Income in Andrews?
Median Family Income in Andrews is $34,594.
What is the Median Household income in Andrews?
Median Household Income in Andrews is $34,636.
What is Income or Wage Gap in Andrews?
Income or Wage Gap in Andrews is 25.9%.
Women in Andrews earn 74.1 cents for every dollar earned by a man.
What is Inequality or Gini Index in Andrews?
Inequality or Gini Index in Andrews is 0.40.
What is the Total Population of Andrews?
Total Population of Andrews is 944.
What is the Total Male Population of Andrews?
Total Male Population of Andrews is 392.
What is the Total Female Population of Andrews?
Total Female Population of Andrews is 552.
What is the Ratio of Males per 100 Females in Andrews?
There are 71.01 Males per 100 Females in Andrews.
What is the Ratio of Females per 100 Males in Andrews?
There are 140.82 Females per 100 Males in Andrews.
What is the Median Population Age in Andrews?
Median Population Age in Andrews is 44.0 Years.
What is the Average Family Size in Andrews
Average Family Size in Andrews is 2.9 People.
What is the Average Household Size in Andrews
Average Household Size in Andrews is 2.8 People.
How Large is the Labor Force in Andrews?
There are 518 People in the Labor Forcein in Andrews.
What is the Percentage of People in the Labor Force in Andrews?
62.7% of People are in the Labor Force in Andrews.