Everglades, FL Map & Demographics
Everglades Map
Everglades Overview
$46,561
PER CAPITA INCOME
$105,250
AVG FAMILY INCOME
0.43
INEQUALITY / GINI INDEX
143
TOTAL POPULATION
85
MALE POPULATION
58
FEMALE POPULATION
146.55
MALES / 100 FEMALES
68.24
FEMALES / 100 MALES
59.9
MEDIAN AGE
2.3
AVG FAMILY SIZE
2.0
AVG HOUSEHOLD SIZE
76
LABOR FORCE [ PEOPLE ]
59.8%
PERCENT IN LABOR FORCE
Everglades Area Codes
Income in Everglades
Income Overview in Everglades
| Characteristic | Number | Measure |
| Per Capita Income | 143 | $46,561 |
| Median Family Income | 49 | $105,250 |
| Mean Family Income | 49 | $119,637 |
| Median Household Income | 72 | $0 |
| Mean Household Income | 72 | $92,722 |
| Income Deficit | 49 | $0 |
| Wage / Income Gap (%) | 143 | 0.00% |
| Wage / Income Gap ($) | 143 | 100.00¢ per $1 |
| Gini / Inequality Index | 143 | 0.43 |
Earnings by Sex in Everglades
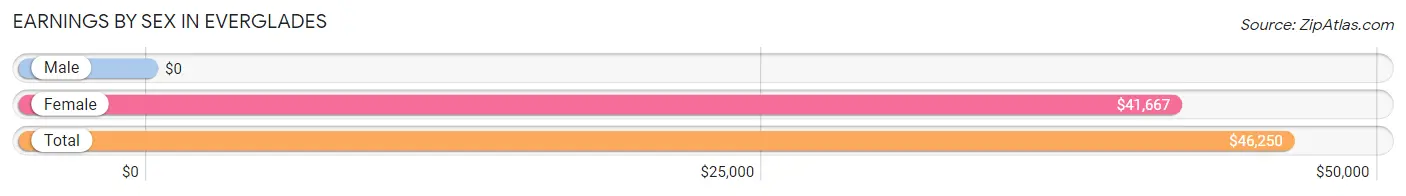
| Sex | Number | Average Earnings |
| Male | 46 (60.5%) | $0 |
| Female | 30 (39.5%) | $41,667 |
| Total | 76 (100.0%) | $46,250 |
Earnings by Sex by Income Bracket in Everglades
The most common earnings brackets in Everglades are $100,000+ for men (17 | 37.0%) and $40,000 to $44,999 for women (10 | 33.3%).
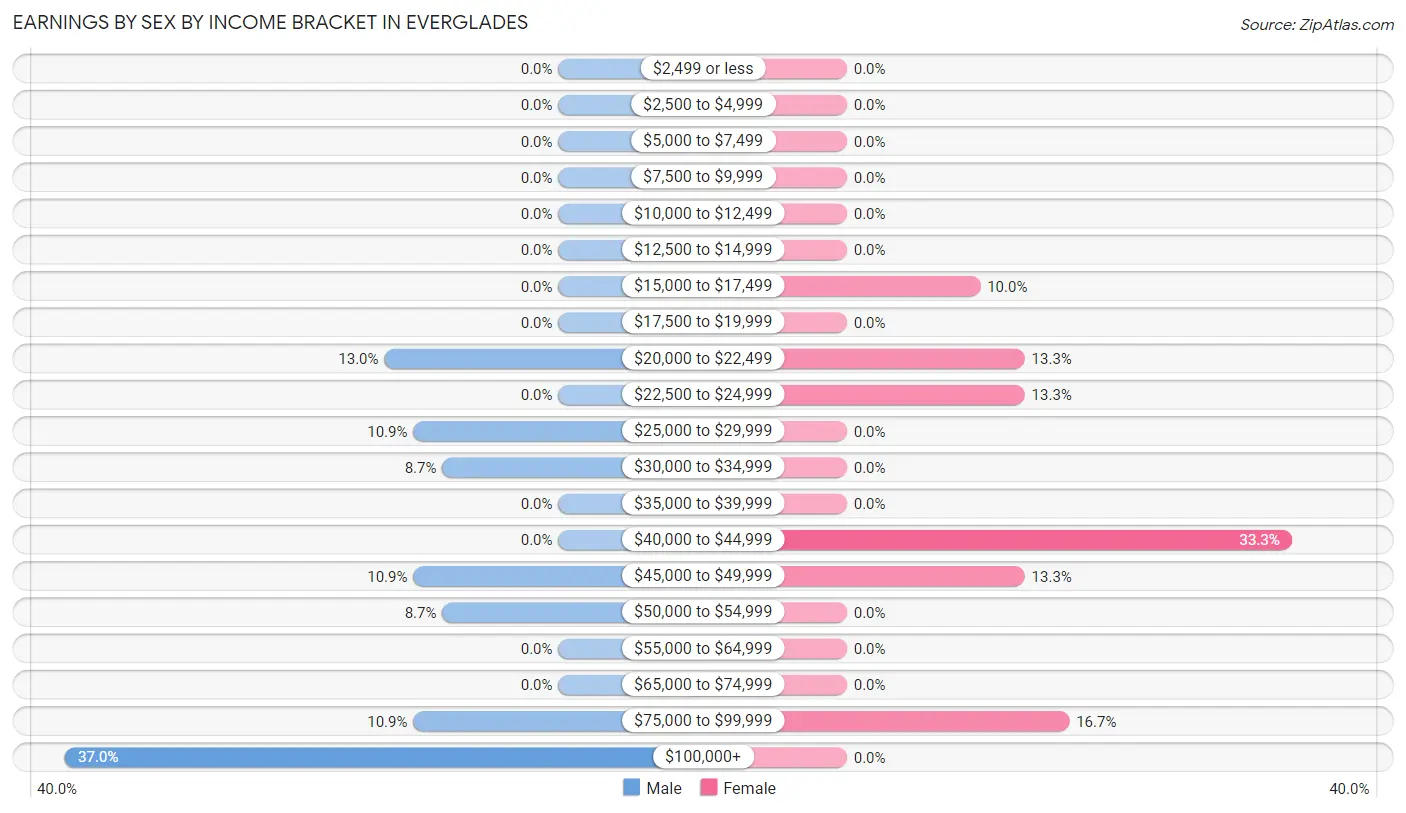
| Income | Male | Female |
| $2,499 or less | 0 (0.0%) | 0 (0.0%) |
| $2,500 to $4,999 | 0 (0.0%) | 0 (0.0%) |
| $5,000 to $7,499 | 0 (0.0%) | 0 (0.0%) |
| $7,500 to $9,999 | 0 (0.0%) | 0 (0.0%) |
| $10,000 to $12,499 | 0 (0.0%) | 0 (0.0%) |
| $12,500 to $14,999 | 0 (0.0%) | 0 (0.0%) |
| $15,000 to $17,499 | 0 (0.0%) | 3 (10.0%) |
| $17,500 to $19,999 | 0 (0.0%) | 0 (0.0%) |
| $20,000 to $22,499 | 6 (13.0%) | 4 (13.3%) |
| $22,500 to $24,999 | 0 (0.0%) | 4 (13.3%) |
| $25,000 to $29,999 | 5 (10.9%) | 0 (0.0%) |
| $30,000 to $34,999 | 4 (8.7%) | 0 (0.0%) |
| $35,000 to $39,999 | 0 (0.0%) | 0 (0.0%) |
| $40,000 to $44,999 | 0 (0.0%) | 10 (33.3%) |
| $45,000 to $49,999 | 5 (10.9%) | 4 (13.3%) |
| $50,000 to $54,999 | 4 (8.7%) | 0 (0.0%) |
| $55,000 to $64,999 | 0 (0.0%) | 0 (0.0%) |
| $65,000 to $74,999 | 0 (0.0%) | 0 (0.0%) |
| $75,000 to $99,999 | 5 (10.9%) | 5 (16.7%) |
| $100,000+ | 17 (37.0%) | 0 (0.0%) |
| Total | 46 (100.0%) | 30 (100.0%) |
Earnings by Sex by Educational Attainment in Everglades
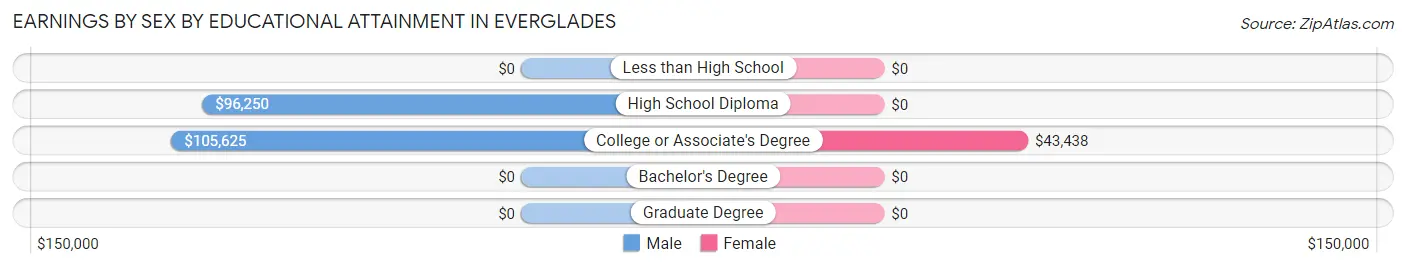
| Educational Attainment | Male Income | Female Income |
| Less than High School | - | - |
| High School Diploma | $96,250 | $0 |
| College or Associate's Degree | $105,625 | $43,438 |
| Bachelor's Degree | - | - |
| Graduate Degree | - | - |
| Total | - | - |
Family Income in Everglades
Family Income Brackets in Everglades
According to the Everglades family income data, there are 11 families falling into the $150,000 to $199,999 income range, which is the most common income bracket and makes up 22.5% of all families.
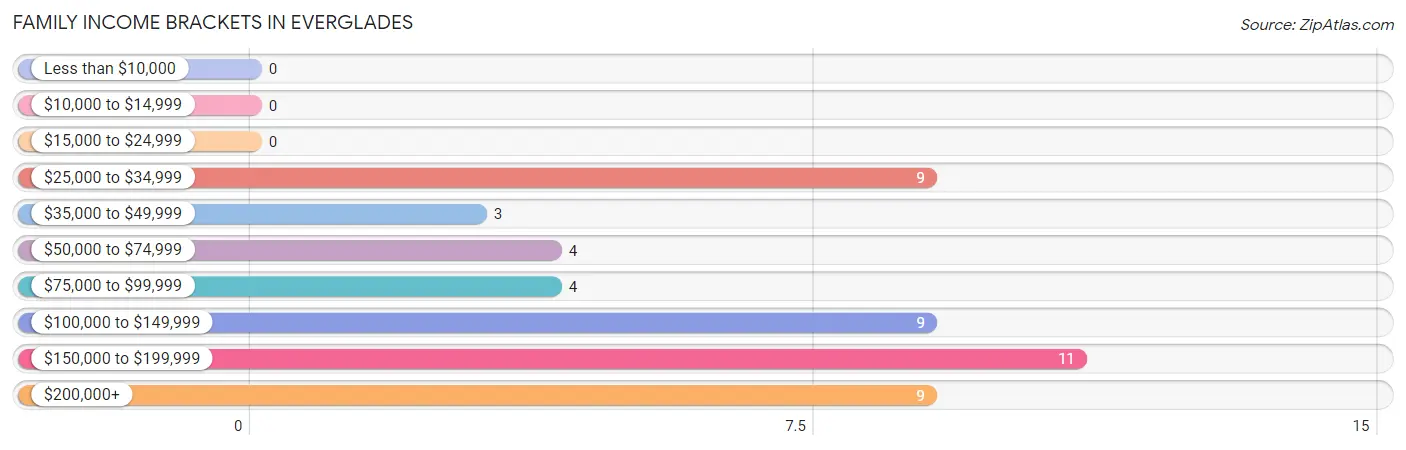
| Income Bracket | # Families | % Families |
| Less than $10,000 | 0 | 0.0% |
| $10,000 to $14,999 | 0 | 0.0% |
| $15,000 to $24,999 | 0 | 0.0% |
| $25,000 to $34,999 | 9 | 18.4% |
| $35,000 to $49,999 | 3 | 6.1% |
| $50,000 to $74,999 | 4 | 8.2% |
| $75,000 to $99,999 | 4 | 8.2% |
| $100,000 to $149,999 | 9 | 18.4% |
| $150,000 to $199,999 | 11 | 22.4% |
| $200,000+ | 9 | 18.4% |
Family Income by Famaliy Size in Everglades
| Income Bracket | # Families | Median Income |
| 2-Person Families | 41 (83.7%) | $0 |
| 3-Person Families | 4 (8.2%) | $0 |
| 4-Person Families | 0 (0.0%) | $0 |
| 5-Person Families | 4 (8.2%) | $0 |
| 6-Person Families | 0 (0.0%) | $0 |
| 7+ Person Families | 0 (0.0%) | $0 |
| Total | 49 (100.0%) | $105,250 |
Family Income by Number of Earners in Everglades
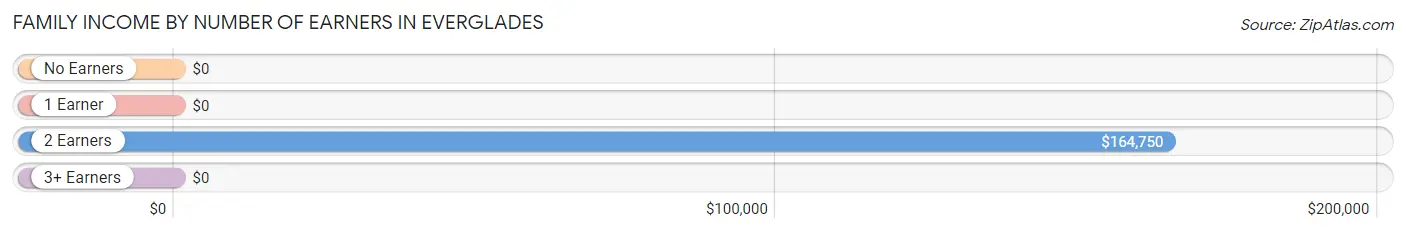
| Number of Earners | # Families | Median Income |
| No Earners | 12 (24.5%) | $0 |
| 1 Earner | 12 (24.5%) | $0 |
| 2 Earners | 25 (51.0%) | $164,750 |
| 3+ Earners | 0 (0.0%) | $0 |
| Total | 49 (100.0%) | $105,250 |
Household Income in Everglades
Household Income Brackets in Everglades
With 19 households falling in the category, the $25,000 to $34,999 income range is the most frequent in Everglades, accounting for 26.4% of all households.
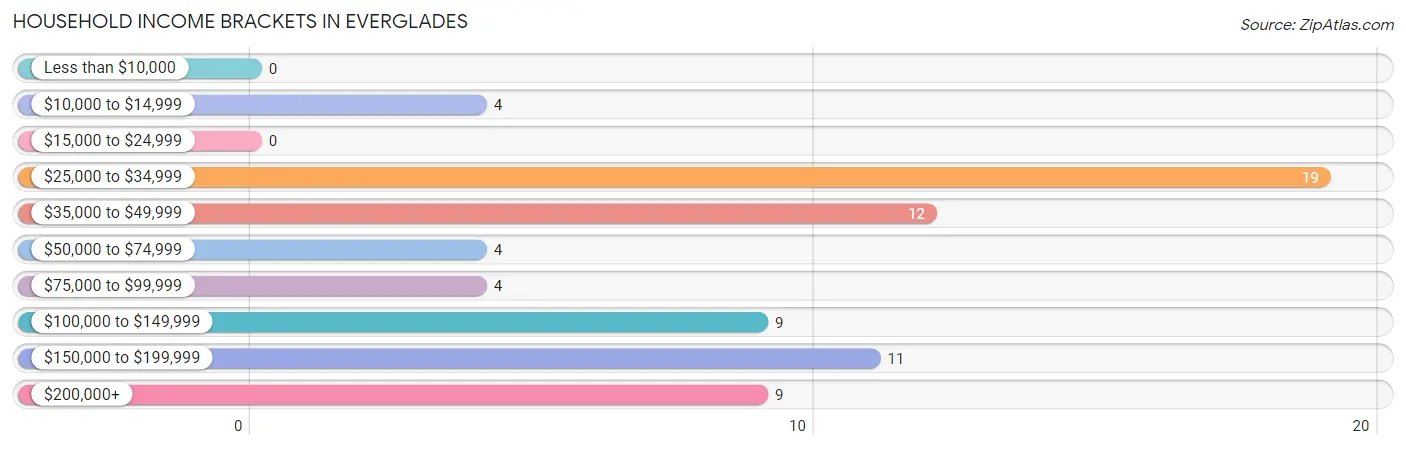
| Income Bracket | # Households | % Households |
| Less than $10,000 | 0 | 0.0% |
| $10,000 to $14,999 | 4 | 5.6% |
| $15,000 to $24,999 | 0 | 0.0% |
| $25,000 to $34,999 | 19 | 26.4% |
| $35,000 to $49,999 | 12 | 16.7% |
| $50,000 to $74,999 | 4 | 5.6% |
| $75,000 to $99,999 | 4 | 5.6% |
| $100,000 to $149,999 | 9 | 12.5% |
| $150,000 to $199,999 | 11 | 15.3% |
| $200,000+ | 9 | 12.5% |
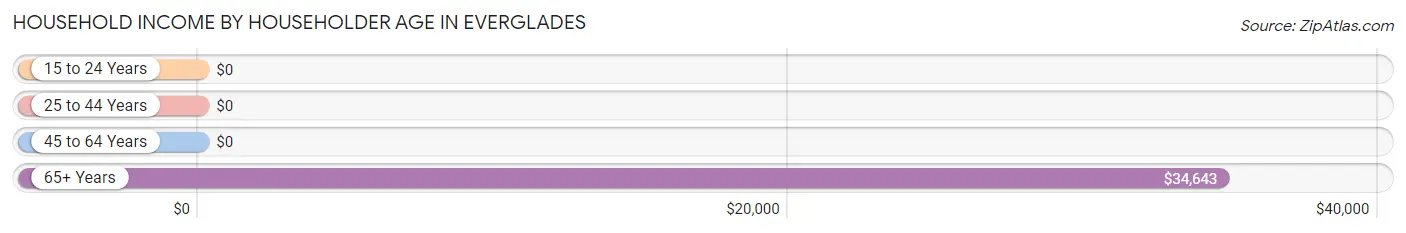
Household Income by Householder Age in Everglades
The median household income in Everglades is $0, with the highest median household income of $34,643 found in the 65+ years age bracket for the primary householder. A total of 34 households (47.2%) fall into this category.
| Income Bracket | # Households | Median Income |
| 15 to 24 Years | 0 (0.0%) | $0 |
| 25 to 44 Years | 9 (12.5%) | $0 |
| 45 to 64 Years | 29 (40.3%) | $0 |
| 65+ Years | 34 (47.2%) | $34,643 |
| Total | 72 (100.0%) | $0 |
Poverty in Everglades
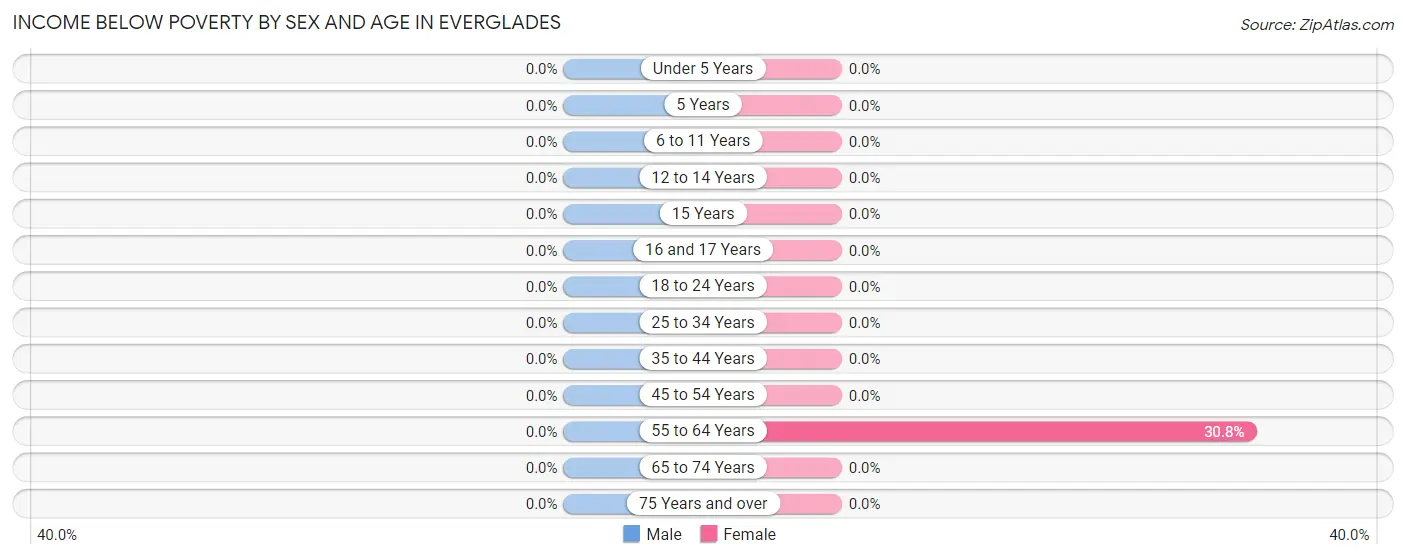
Income Below Poverty by Sex and Age in Everglades
| Age Bracket | Male | Female |
| Under 5 Years | 0 (0.0%) | 0 (0.0%) |
| 5 Years | 0 (0.0%) | 0 (0.0%) |
| 6 to 11 Years | 0 (0.0%) | 0 (0.0%) |
| 12 to 14 Years | 0 (0.0%) | 0 (0.0%) |
| 15 Years | 0 (0.0%) | 0 (0.0%) |
| 16 and 17 Years | 0 (0.0%) | 0 (0.0%) |
| 18 to 24 Years | 0 (0.0%) | 0 (0.0%) |
| 25 to 34 Years | 0 (0.0%) | 0 (0.0%) |
| 35 to 44 Years | 0 (0.0%) | 0 (0.0%) |
| 45 to 54 Years | 0 (0.0%) | 0 (0.0%) |
| 55 to 64 Years | 0 (0.0%) | 4 (30.8%) |
| 65 to 74 Years | 0 (0.0%) | 0 (0.0%) |
| 75 Years and over | 0 (0.0%) | 0 (0.0%) |
| Total | 0 (0.0%) | 4 (6.9%) |
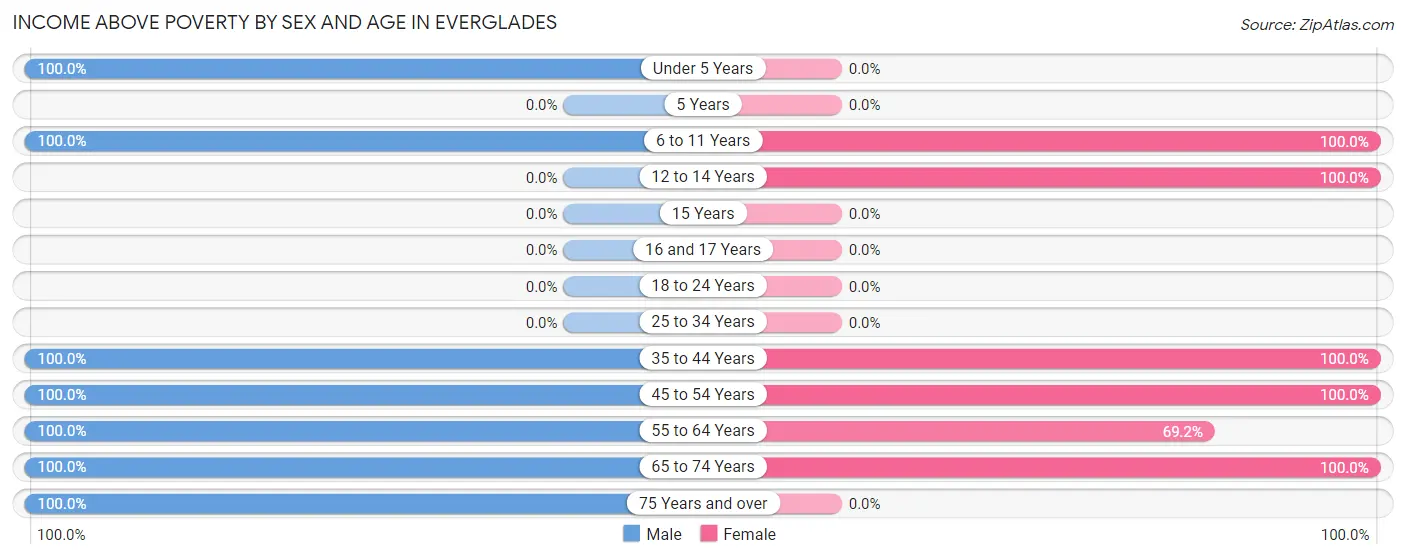
Income Above Poverty by Sex and Age in Everglades
According to the poverty statistics in Everglades, males aged under 5 years and females aged 6 to 11 years are the age groups that are most secure financially, with 100.0% of males and 100.0% of females in these age groups living above the poverty line.
| Age Bracket | Male | Female |
| Under 5 Years | 5 (100.0%) | 0 (0.0%) |
| 5 Years | 0 (0.0%) | 0 (0.0%) |
| 6 to 11 Years | 4 (100.0%) | 3 (100.0%) |
| 12 to 14 Years | 0 (0.0%) | 4 (100.0%) |
| 15 Years | 0 (0.0%) | 0 (0.0%) |
| 16 and 17 Years | 0 (0.0%) | 0 (0.0%) |
| 18 to 24 Years | 0 (0.0%) | 0 (0.0%) |
| 25 to 34 Years | 0 (0.0%) | 0 (0.0%) |
| 35 to 44 Years | 10 (100.0%) | 8 (100.0%) |
| 45 to 54 Years | 16 (100.0%) | 11 (100.0%) |
| 55 to 64 Years | 15 (100.0%) | 9 (69.2%) |
| 65 to 74 Years | 19 (100.0%) | 19 (100.0%) |
| 75 Years and over | 16 (100.0%) | 0 (0.0%) |
| Total | 85 (100.0%) | 54 (93.1%) |
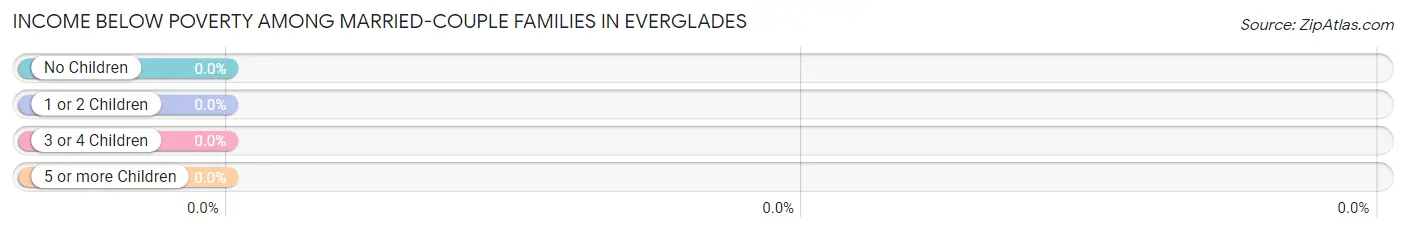
Income Below Poverty Among Married-Couple Families in Everglades
| Children | Above Poverty | Below Poverty |
| No Children | 41 (100.0%) | 0 (0.0%) |
| 1 or 2 Children | 4 (100.0%) | 0 (0.0%) |
| 3 or 4 Children | 4 (100.0%) | 0 (0.0%) |
| 5 or more Children | 0 (0.0%) | 0 (0.0%) |
| Total | 49 (100.0%) | 0 (0.0%) |
Income Below Poverty Among Single-Parent Households in Everglades
| Children | Single Father | Single Mother |
| No Children | 0 (0.0%) | 0 (0.0%) |
| 1 or 2 Children | 0 (0.0%) | 0 (0.0%) |
| 3 or 4 Children | 0 (0.0%) | 0 (0.0%) |
| 5 or more Children | 0 (0.0%) | 0 (0.0%) |
| Total | 0 (0.0%) | 0 (0.0%) |
Income Below Poverty Among Married-Couple vs Single-Parent Households in Everglades
| Children | Married-Couple Families | Single-Parent Households |
| No Children | 0 (0.0%) | 0 (0.0%) |
| 1 or 2 Children | 0 (0.0%) | 0 (0.0%) |
| 3 or 4 Children | 0 (0.0%) | 0 (0.0%) |
| 5 or more Children | 0 (0.0%) | 0 (0.0%) |
| Total | 0 (0.0%) | 0 (0.0%) |
Race in Everglades
The most populous races in Everglades are White / Caucasian (122 | 85.3%), Hispanic or Latino (21 | 14.7%), and Two or more Races (21 | 14.7%).
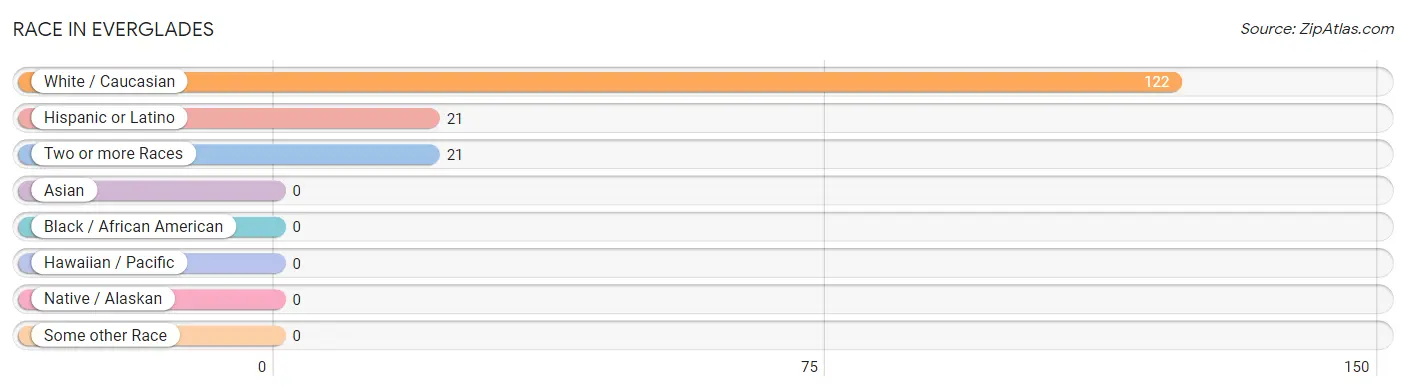
| Race | # Population | % Population |
| Asian | 0 | 0.0% |
| Black / African American | 0 | 0.0% |
| Hawaiian / Pacific | 0 | 0.0% |
| Hispanic or Latino | 21 | 14.7% |
| Native / Alaskan | 0 | 0.0% |
| White / Caucasian | 122 | 85.3% |
| Two or more Races | 21 | 14.7% |
| Some other Race | 0 | 0.0% |
| Total | 143 | 100.0% |
Ancestry in Everglades
The most populous ancestries reported in Everglades are American (69 | 48.2%), Irish (22 | 15.4%), Central American (21 | 14.7%), Salvadoran (21 | 14.7%), and Italian (17 | 11.9%), together accounting for 104.9% of all Everglades residents.
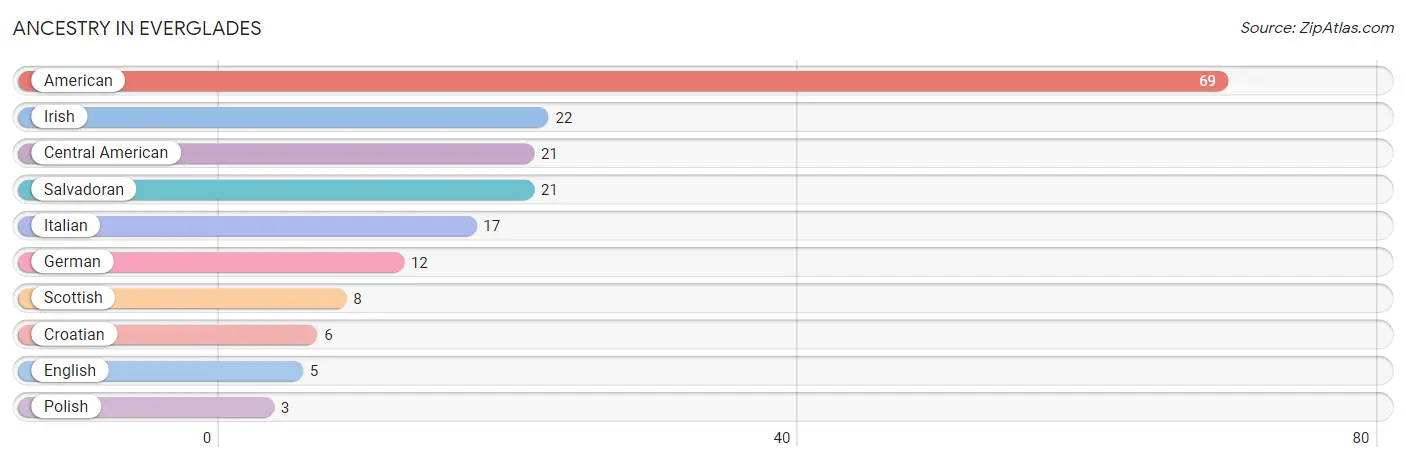
| Ancestry | # Population | % Population |
| American | 69 | 48.2% |
| Central American | 21 | 14.7% |
| Croatian | 6 | 4.2% |
| English | 5 | 3.5% |
| German | 12 | 8.4% |
| Irish | 22 | 15.4% |
| Italian | 17 | 11.9% |
| Polish | 3 | 2.1% |
| Salvadoran | 21 | 14.7% |
| Scottish | 8 | 5.6% | View All 10 Rows |
Immigrants in Everglades
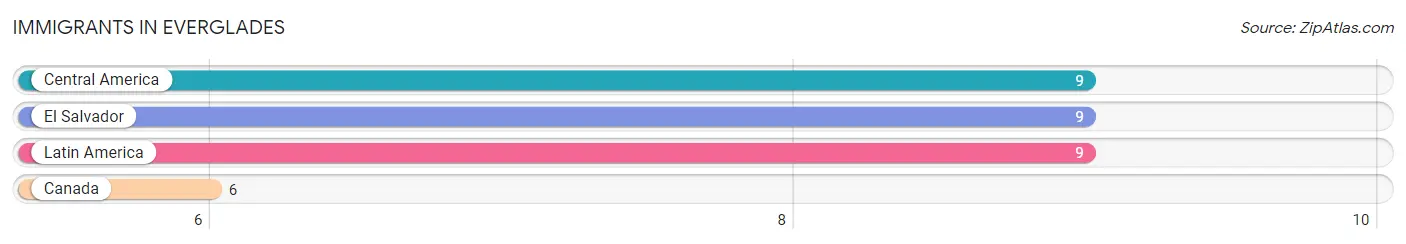
The most numerous immigrant groups reported in Everglades came from Central America (9 | 6.3%), El Salvador (9 | 6.3%), Latin America (9 | 6.3%), and Canada (6 | 4.2%), together accounting for 23.1% of all Everglades residents.
| Immigration Origin | # Population | % Population |
| Canada | 6 | 4.2% |
| Central America | 9 | 6.3% |
| El Salvador | 9 | 6.3% |
| Latin America | 9 | 6.3% | View All 4 Rows |
Sex and Age in Everglades
Sex and Age in Everglades
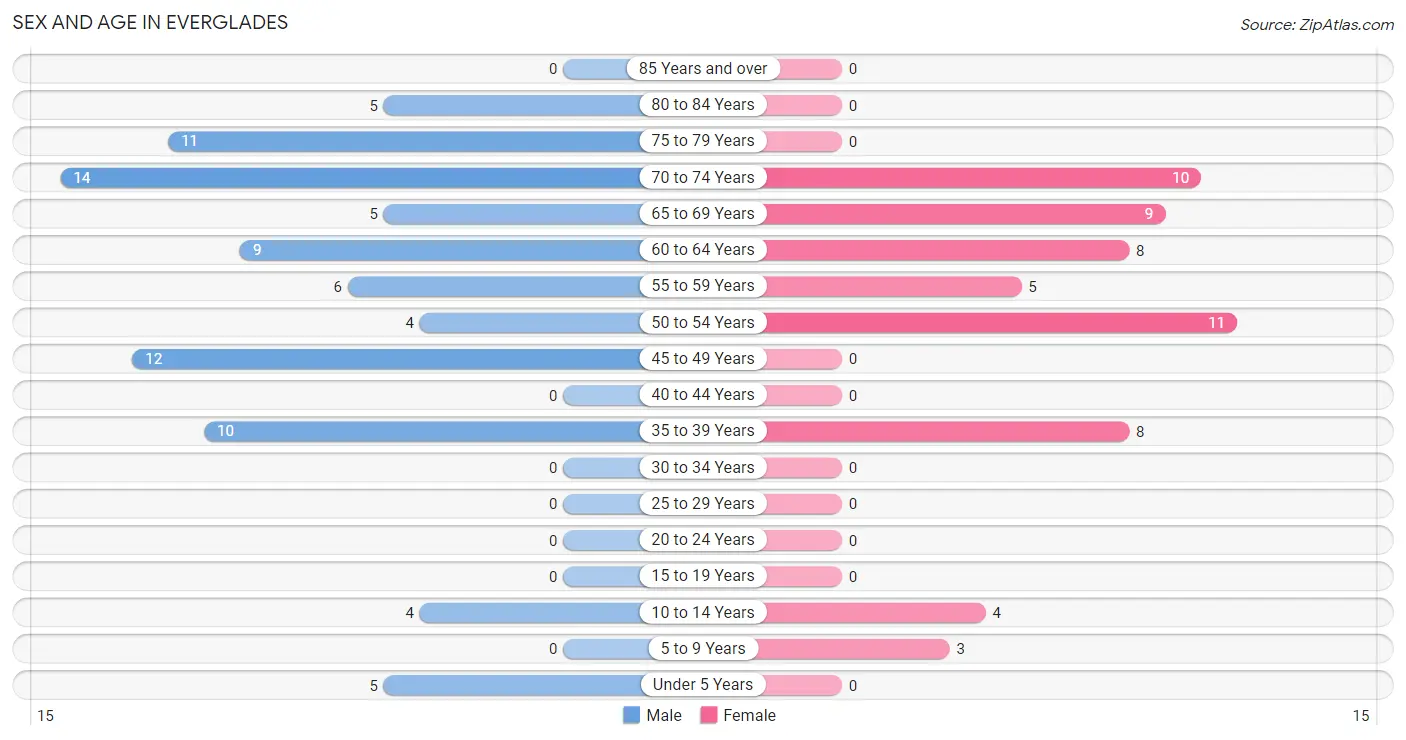
The most populous age groups in Everglades are 70 to 74 Years (14 | 16.5%) for men and 50 to 54 Years (11 | 19.0%) for women.
| Age Bracket | Male | Female |
| Under 5 Years | 5 (5.9%) | 0 (0.0%) |
| 5 to 9 Years | 0 (0.0%) | 3 (5.2%) |
| 10 to 14 Years | 4 (4.7%) | 4 (6.9%) |
| 15 to 19 Years | 0 (0.0%) | 0 (0.0%) |
| 20 to 24 Years | 0 (0.0%) | 0 (0.0%) |
| 25 to 29 Years | 0 (0.0%) | 0 (0.0%) |
| 30 to 34 Years | 0 (0.0%) | 0 (0.0%) |
| 35 to 39 Years | 10 (11.8%) | 8 (13.8%) |
| 40 to 44 Years | 0 (0.0%) | 0 (0.0%) |
| 45 to 49 Years | 12 (14.1%) | 0 (0.0%) |
| 50 to 54 Years | 4 (4.7%) | 11 (19.0%) |
| 55 to 59 Years | 6 (7.1%) | 5 (8.6%) |
| 60 to 64 Years | 9 (10.6%) | 8 (13.8%) |
| 65 to 69 Years | 5 (5.9%) | 9 (15.5%) |
| 70 to 74 Years | 14 (16.5%) | 10 (17.2%) |
| 75 to 79 Years | 11 (12.9%) | 0 (0.0%) |
| 80 to 84 Years | 5 (5.9%) | 0 (0.0%) |
| 85 Years and over | 0 (0.0%) | 0 (0.0%) |
| Total | 85 (100.0%) | 58 (100.0%) |
Families and Households in Everglades
Median Family Size in Everglades
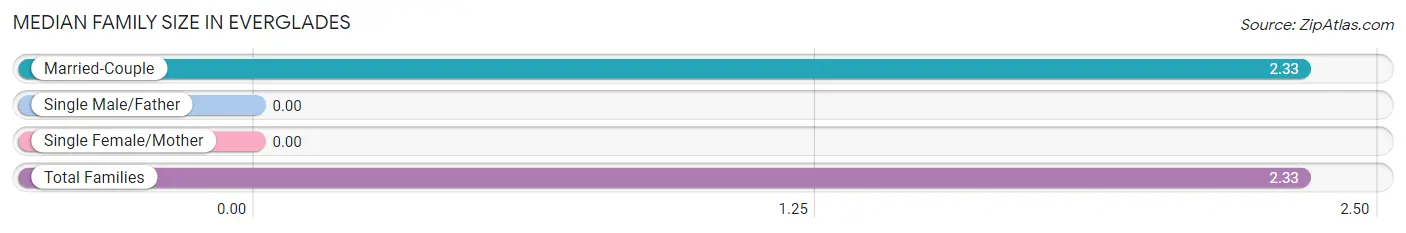
| Family Type | # Families | Family Size |
| Married-Couple | 49 (100.0%) | 2.33 |
| Single Male/Father | 0 (0.0%) | - |
| Single Female/Mother | 0 (0.0%) | - |
| Total Families | 49 (100.0%) | 2.33 |
Median Household Size in Everglades
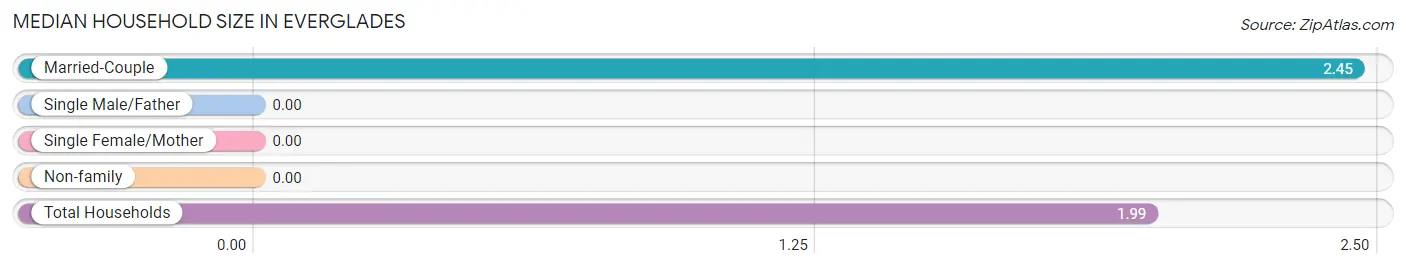
| Household Type | # Households | Household Size |
| Married-Couple | 49 (68.1%) | 2.45 |
| Single Male/Father | 0 (0.0%) | - |
| Single Female/Mother | 0 (0.0%) | - |
| Non-family | 23 (31.9%) | - |
| Total Households | 72 (100.0%) | 1.99 |
Household Size by Marriage Status in Everglades
Out of a total of 72 households in Everglades, 49 (68.1%) are family households, while 23 (31.9%) are nonfamily households. The most numerous type of family households are 2-person households, comprising 38, and the most common type of nonfamily households are 1-person households, comprising 23.
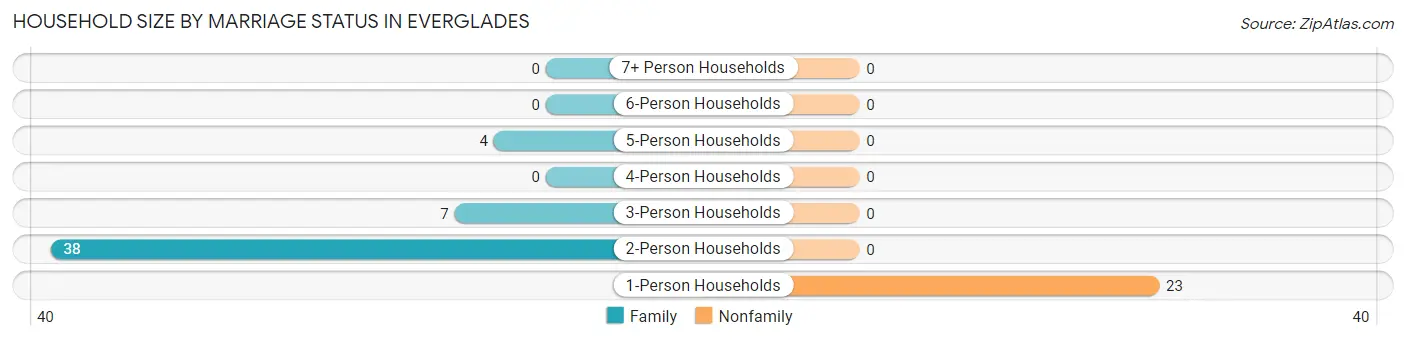
| Household Size | Family Households | Nonfamily Households |
| 1-Person Households | - | 23 (31.9%) |
| 2-Person Households | 38 (52.8%) | 0 (0.0%) |
| 3-Person Households | 7 (9.7%) | 0 (0.0%) |
| 4-Person Households | 0 (0.0%) | 0 (0.0%) |
| 5-Person Households | 4 (5.6%) | 0 (0.0%) |
| 6-Person Households | 0 (0.0%) | 0 (0.0%) |
| 7+ Person Households | 0 (0.0%) | 0 (0.0%) |
| Total | 49 (68.1%) | 23 (31.9%) |
Female Fertility in Everglades
Fertility by Age in Everglades
| Age Bracket | Women with Births | Births / 1,000 Women |
| 15 to 19 years | 0 (0.0%) | 0.0 |
| 20 to 34 years | 0 (0.0%) | 0.0 |
| 35 to 50 years | 0 (0.0%) | 0.0 |
| Total | 0 (0.0%) | 0.0 |
Fertility by Age by Marriage Status in Everglades
| Age Bracket | Married | Unmarried |
| 15 to 19 years | 0 (0.0%) | 0 (0.0%) |
| 20 to 34 years | 0 (0.0%) | 0 (0.0%) |
| 35 to 50 years | 0 (0.0%) | 0 (0.0%) |
| Total | 0 (0.0%) | 0 (0.0%) |
Fertility by Education in Everglades
| Educational Attainment | Women with Births | Births / 1,000 Women |
| Less than High School | 0 (0.0%) | 0.0 |
| High School Diploma | 0 (0.0%) | 0.0 |
| College or Associate's Degree | 0 (0.0%) | 0.0 |
| Bachelor's Degree | 0 (0.0%) | 0.0 |
| Graduate Degree | 0 (0.0%) | 0.0 |
| Total | 0 (0.0%) | 0.0 |
Fertility by Education by Marriage Status in Everglades
| Educational Attainment | Married | Unmarried |
| Less than High School | 0 (0.0%) | 0 (0.0%) |
| High School Diploma | 0 (0.0%) | 0 (0.0%) |
| College or Associate's Degree | 0 (0.0%) | 0 (0.0%) |
| Bachelor's Degree | 0 (0.0%) | 0 (0.0%) |
| Graduate Degree | 0 (0.0%) | 0 (0.0%) |
| Total | 0 (0.0%) | 0 (0.0%) |
Employment Characteristics in Everglades
Employment by Class of Employer in Everglades
Among the 76 employed individuals in Everglades, private company employees (31 | 40.8%), self-employed (not incorporated) (19 | 25.0%), and self-employed (incorporated) (16 | 21.0%) make up the most common classes of employment.
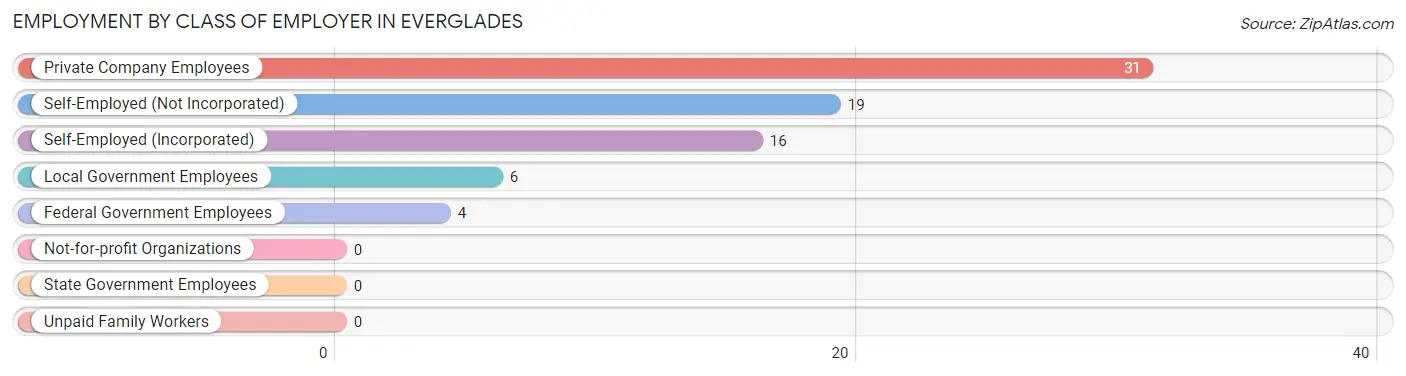
| Employer Class | # Employees | % Employees |
| Private Company Employees | 31 | 40.8% |
| Self-Employed (Incorporated) | 16 | 21.0% |
| Self-Employed (Not Incorporated) | 19 | 25.0% |
| Not-for-profit Organizations | 0 | 0.0% |
| Local Government Employees | 6 | 7.9% |
| State Government Employees | 0 | 0.0% |
| Federal Government Employees | 4 | 5.3% |
| Unpaid Family Workers | 0 | 0.0% |
| Total | 76 | 100.0% |
Employment Status by Age in Everglades
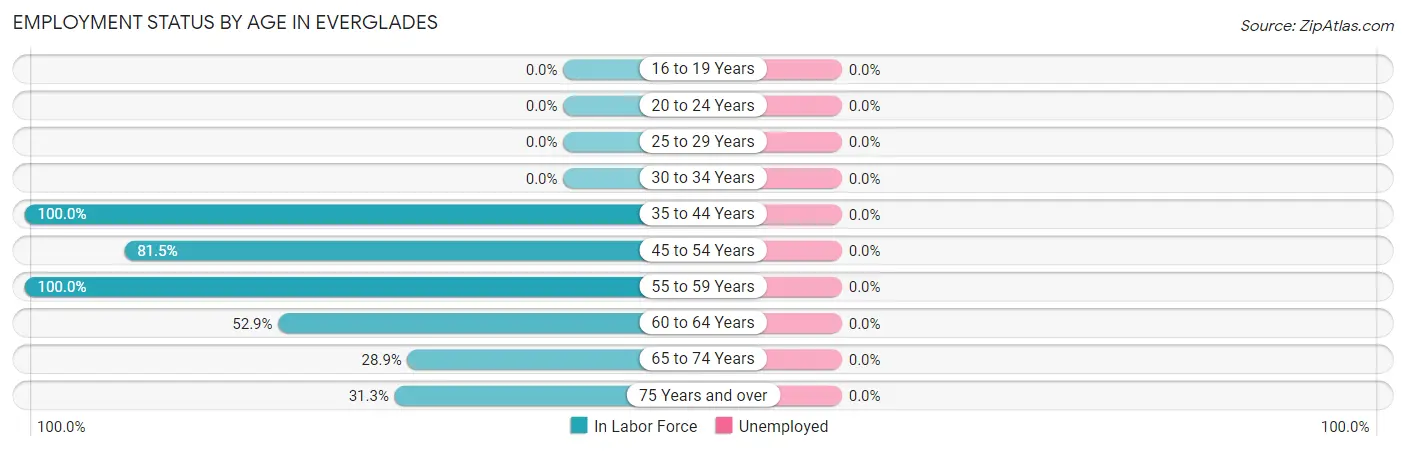
| Age Bracket | In Labor Force | Unemployed |
| 16 to 19 Years | 0 (0.0%) | 0 (0.0%) |
| 20 to 24 Years | 0 (0.0%) | 0 (0.0%) |
| 25 to 29 Years | 0 (0.0%) | 0 (0.0%) |
| 30 to 34 Years | 0 (0.0%) | 0 (0.0%) |
| 35 to 44 Years | 18 (100.0%) | 0 (0.0%) |
| 45 to 54 Years | 22 (81.5%) | 0 (0.0%) |
| 55 to 59 Years | 11 (100.0%) | 0 (0.0%) |
| 60 to 64 Years | 9 (52.9%) | 0 (0.0%) |
| 65 to 74 Years | 11 (28.9%) | 0 (0.0%) |
| 75 Years and over | 5 (31.3%) | 0 (0.0%) |
| Total | 76 (59.8%) | 0 (0.0%) |
Employment Status by Educational Attainment in Everglades
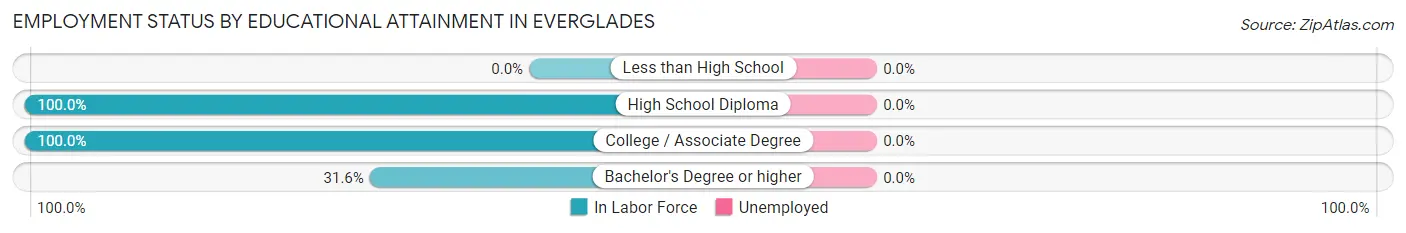
| Educational Attainment | In Labor Force | Unemployed |
| Less than High School | 0 (0.0%) | 0 (0.0%) |
| High School Diploma | 18 (100.0%) | 0 (0.0%) |
| College / Associate Degree | 36 (100.0%) | 0 (0.0%) |
| Bachelor's Degree or higher | 6 (31.6%) | 0 (0.0%) |
| Total | 60 (82.2%) | 0 (0.0%) |
Employment Occupations by Sex in Everglades
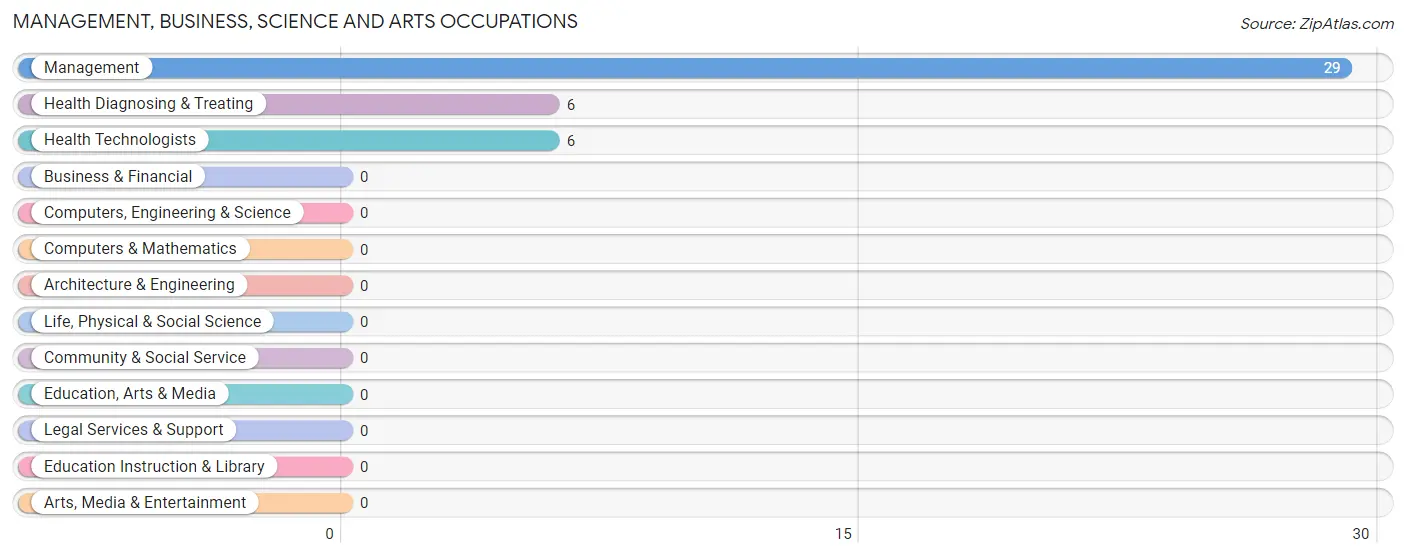
Management, Business, Science and Arts Occupations
The most common Management, Business, Science and Arts occupations in Everglades are Management (29 | 38.2%), Health Diagnosing & Treating (6 | 7.9%), and Health Technologists (6 | 7.9%).
Management, Business, Science and Arts Occupations by Sex
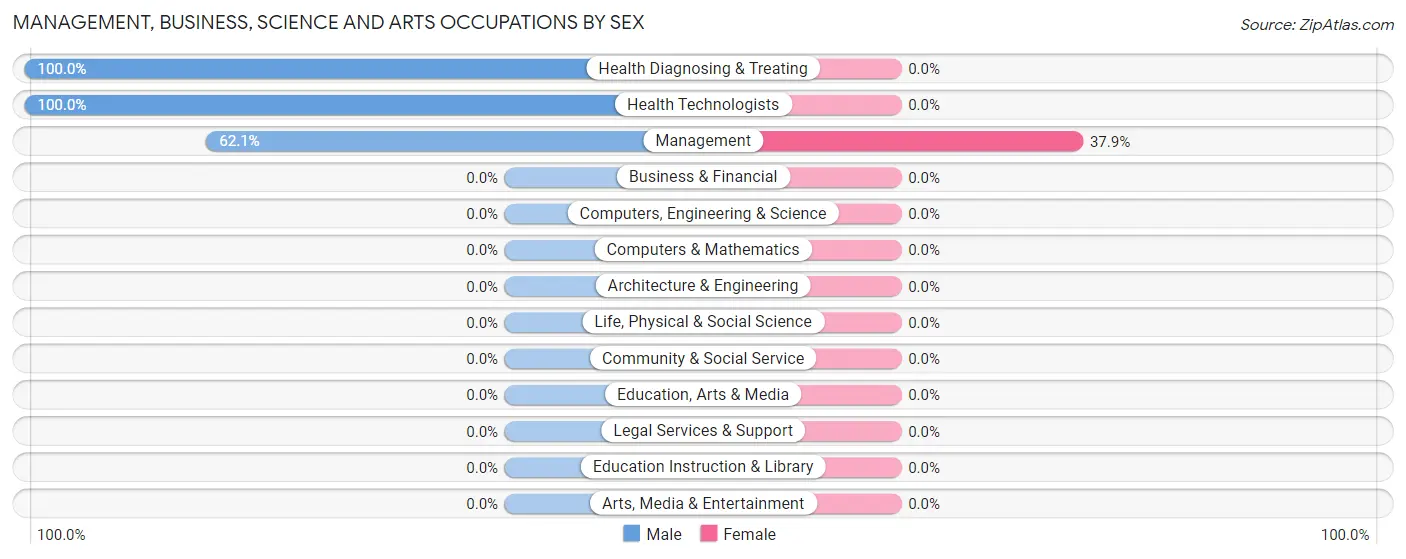
| Occupation | Male | Female |
| Management | 18 (62.1%) | 11 (37.9%) |
| Business & Financial | 0 (0.0%) | 0 (0.0%) |
| Computers, Engineering & Science | 0 (0.0%) | 0 (0.0%) |
| Computers & Mathematics | 0 (0.0%) | 0 (0.0%) |
| Architecture & Engineering | 0 (0.0%) | 0 (0.0%) |
| Life, Physical & Social Science | 0 (0.0%) | 0 (0.0%) |
| Community & Social Service | 0 (0.0%) | 0 (0.0%) |
| Education, Arts & Media | 0 (0.0%) | 0 (0.0%) |
| Legal Services & Support | 0 (0.0%) | 0 (0.0%) |
| Education Instruction & Library | 0 (0.0%) | 0 (0.0%) |
| Arts, Media & Entertainment | 0 (0.0%) | 0 (0.0%) |
| Health Diagnosing & Treating | 6 (100.0%) | 0 (0.0%) |
| Health Technologists | 6 (100.0%) | 0 (0.0%) |
| Total (Category) | 24 (68.6%) | 11 (31.4%) |
| Total (Overall) | 46 (60.5%) | 30 (39.5%) |
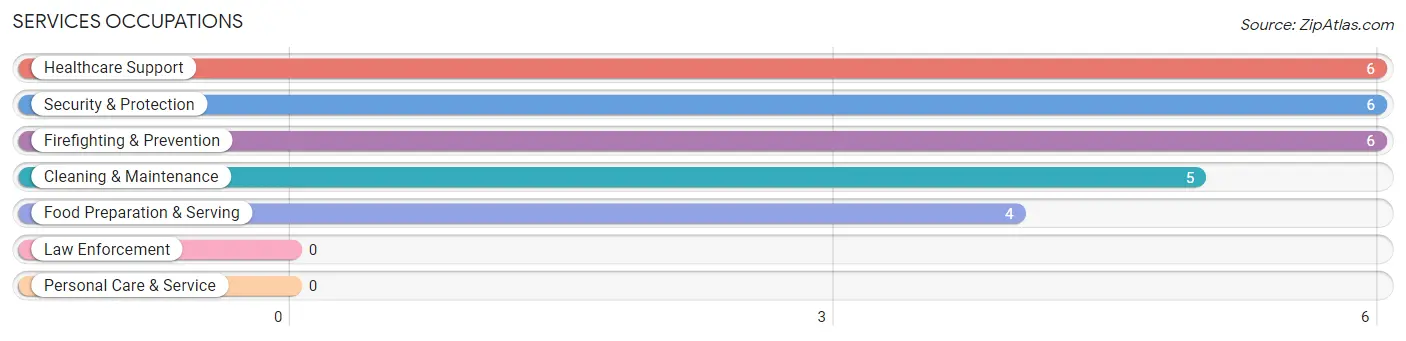
Services Occupations
The most common Services occupations in Everglades are Healthcare Support (6 | 7.9%), Security & Protection (6 | 7.9%), Firefighting & Prevention (6 | 7.9%), Cleaning & Maintenance (5 | 6.6%), and Food Preparation & Serving (4 | 5.3%).
Services Occupations by Sex
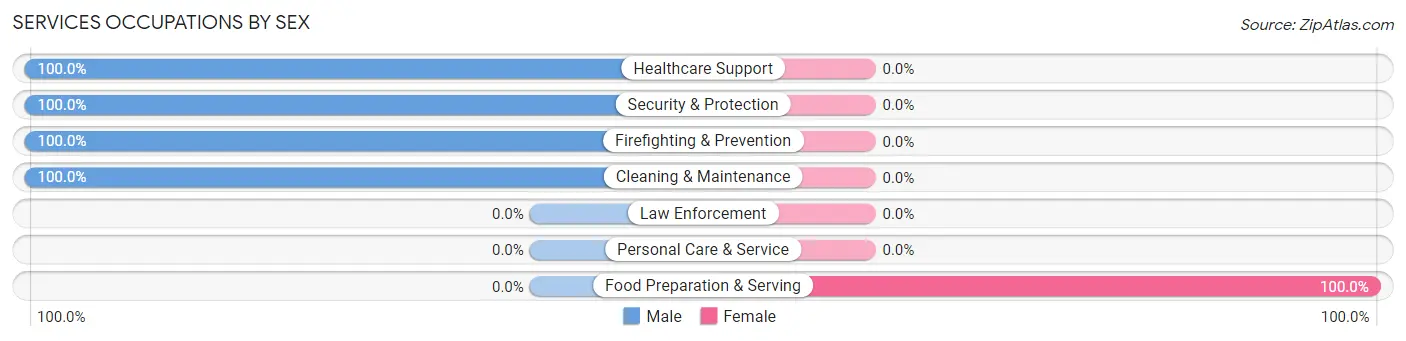
| Occupation | Male | Female |
| Healthcare Support | 6 (100.0%) | 0 (0.0%) |
| Security & Protection | 6 (100.0%) | 0 (0.0%) |
| Firefighting & Prevention | 6 (100.0%) | 0 (0.0%) |
| Law Enforcement | 0 (0.0%) | 0 (0.0%) |
| Food Preparation & Serving | 0 (0.0%) | 4 (100.0%) |
| Cleaning & Maintenance | 5 (100.0%) | 0 (0.0%) |
| Personal Care & Service | 0 (0.0%) | 0 (0.0%) |
| Total (Category) | 17 (80.9%) | 4 (19.1%) |
| Total (Overall) | 46 (60.5%) | 30 (39.5%) |
Sales and Office Occupations
The most common Sales and Office occupations in Everglades are Office & Administration (10 | 13.2%), and Sales & Related (5 | 6.6%).
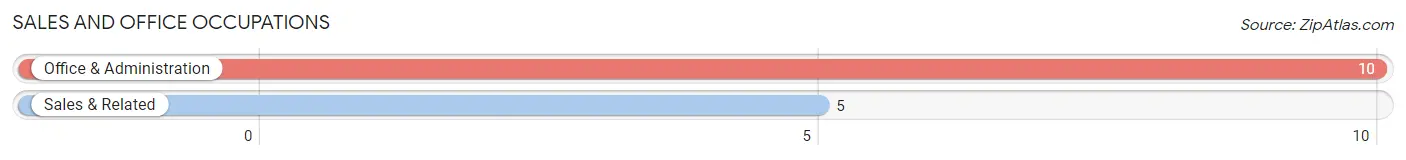
Sales and Office Occupations by Sex
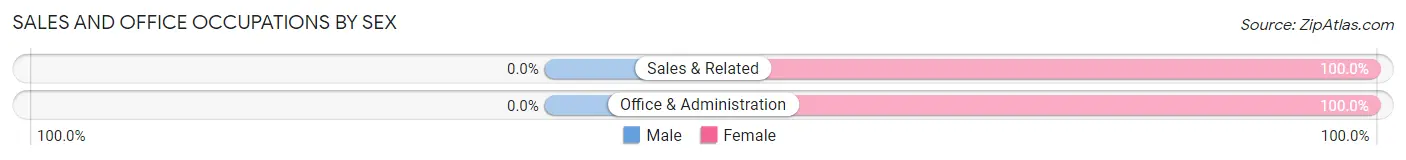
| Occupation | Male | Female |
| Sales & Related | 0 (0.0%) | 5 (100.0%) |
| Office & Administration | 0 (0.0%) | 10 (100.0%) |
| Total (Category) | 0 (0.0%) | 15 (100.0%) |
| Total (Overall) | 46 (60.5%) | 30 (39.5%) |
Natural Resources, Construction and Maintenance Occupations
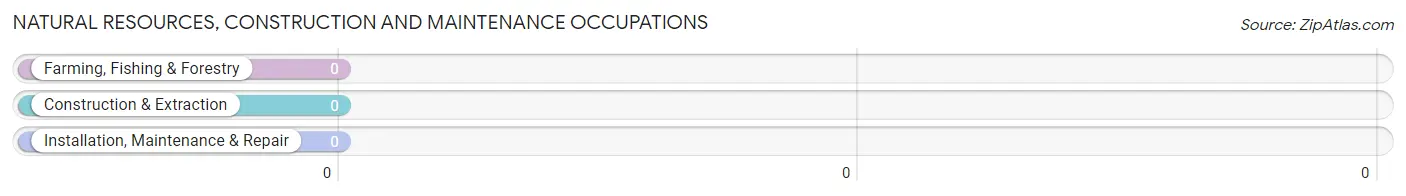
Natural Resources, Construction and Maintenance Occupations by Sex
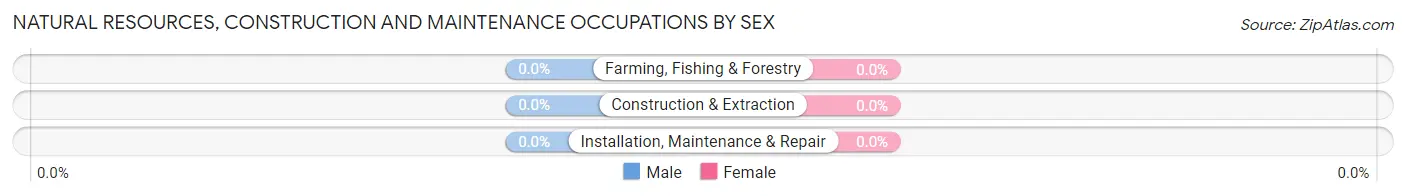
| Occupation | Male | Female |
| Farming, Fishing & Forestry | 0 (0.0%) | 0 (0.0%) |
| Construction & Extraction | 0 (0.0%) | 0 (0.0%) |
| Installation, Maintenance & Repair | 0 (0.0%) | 0 (0.0%) |
| Total (Category) | 0 (0.0%) | 0 (0.0%) |
| Total (Overall) | 46 (60.5%) | 30 (39.5%) |
Production, Transportation and Moving Occupations
The most common Production, Transportation and Moving occupations in Everglades are , and Transportation (5 | 6.6%).
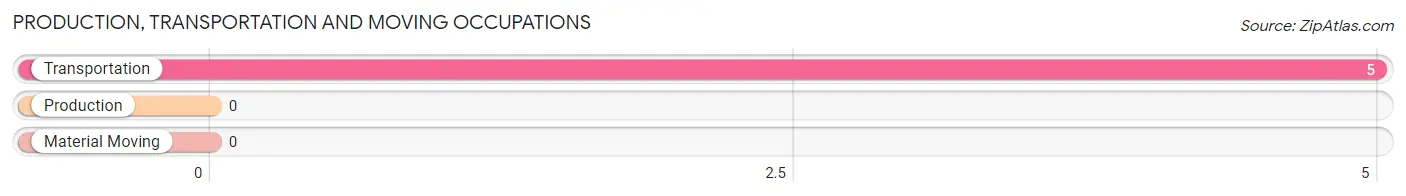
Production, Transportation and Moving Occupations by Sex
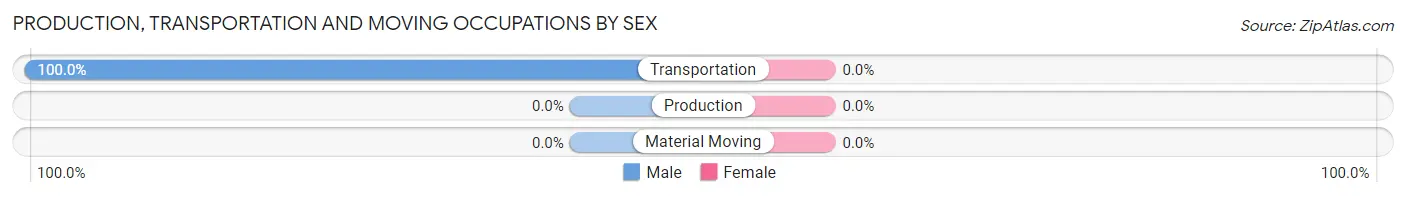
| Occupation | Male | Female |
| Production | 0 (0.0%) | 0 (0.0%) |
| Transportation | 5 (100.0%) | 0 (0.0%) |
| Material Moving | 0 (0.0%) | 0 (0.0%) |
| Total (Category) | 5 (100.0%) | 0 (0.0%) |
| Total (Overall) | 46 (60.5%) | 30 (39.5%) |
Employment Industries by Sex in Everglades
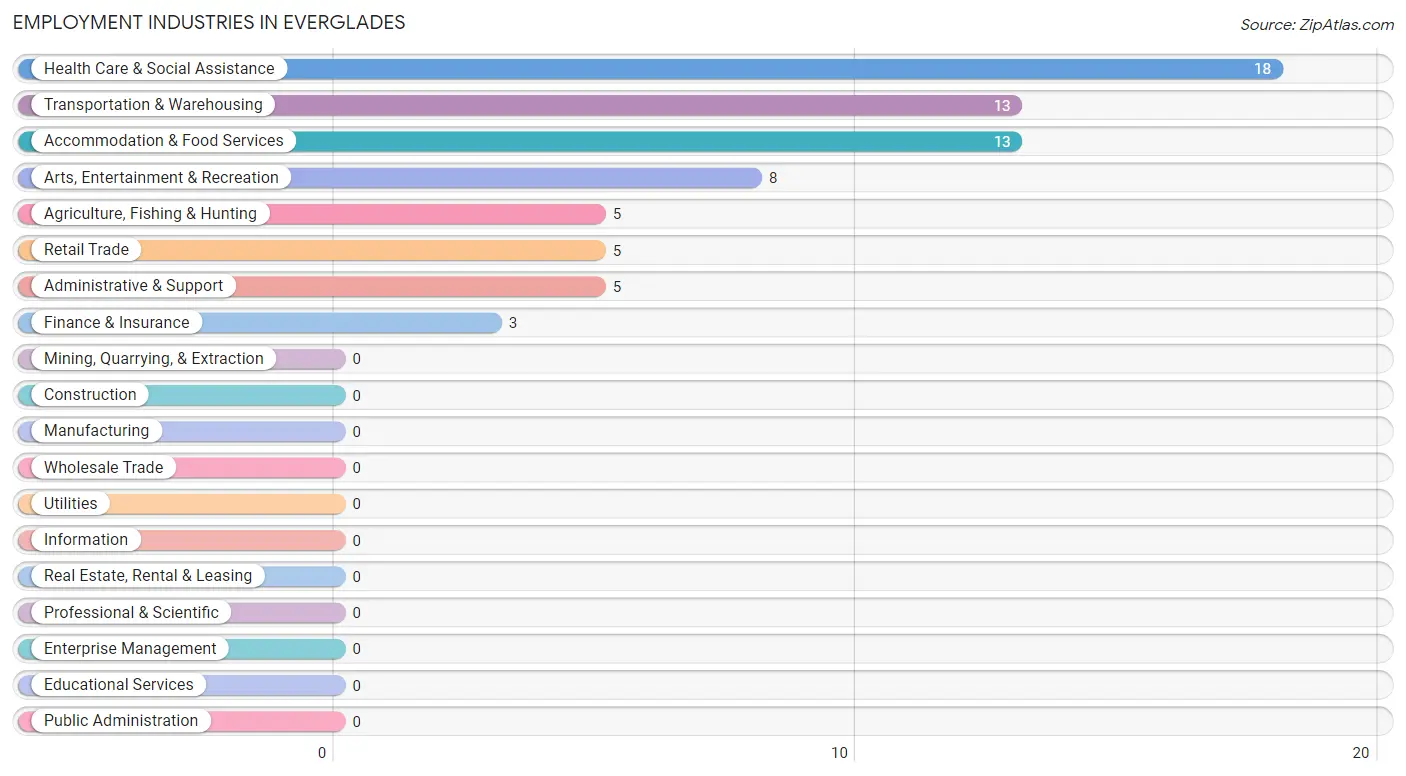
Employment Industries in Everglades
The major employment industries in Everglades include Health Care & Social Assistance (18 | 23.7%), Transportation & Warehousing (13 | 17.1%), Accommodation & Food Services (13 | 17.1%), Arts, Entertainment & Recreation (8 | 10.5%), and Agriculture, Fishing & Hunting (5 | 6.6%).
Employment Industries by Sex in Everglades
The Everglades industries that see more men than women are Agriculture, Fishing & Hunting (100.0%), Administrative & Support (100.0%), and Transportation & Warehousing (69.2%), whereas the industries that tend to have a higher number of women are Retail Trade (100.0%), Finance & Insurance (100.0%), and Accommodation & Food Services (61.5%).
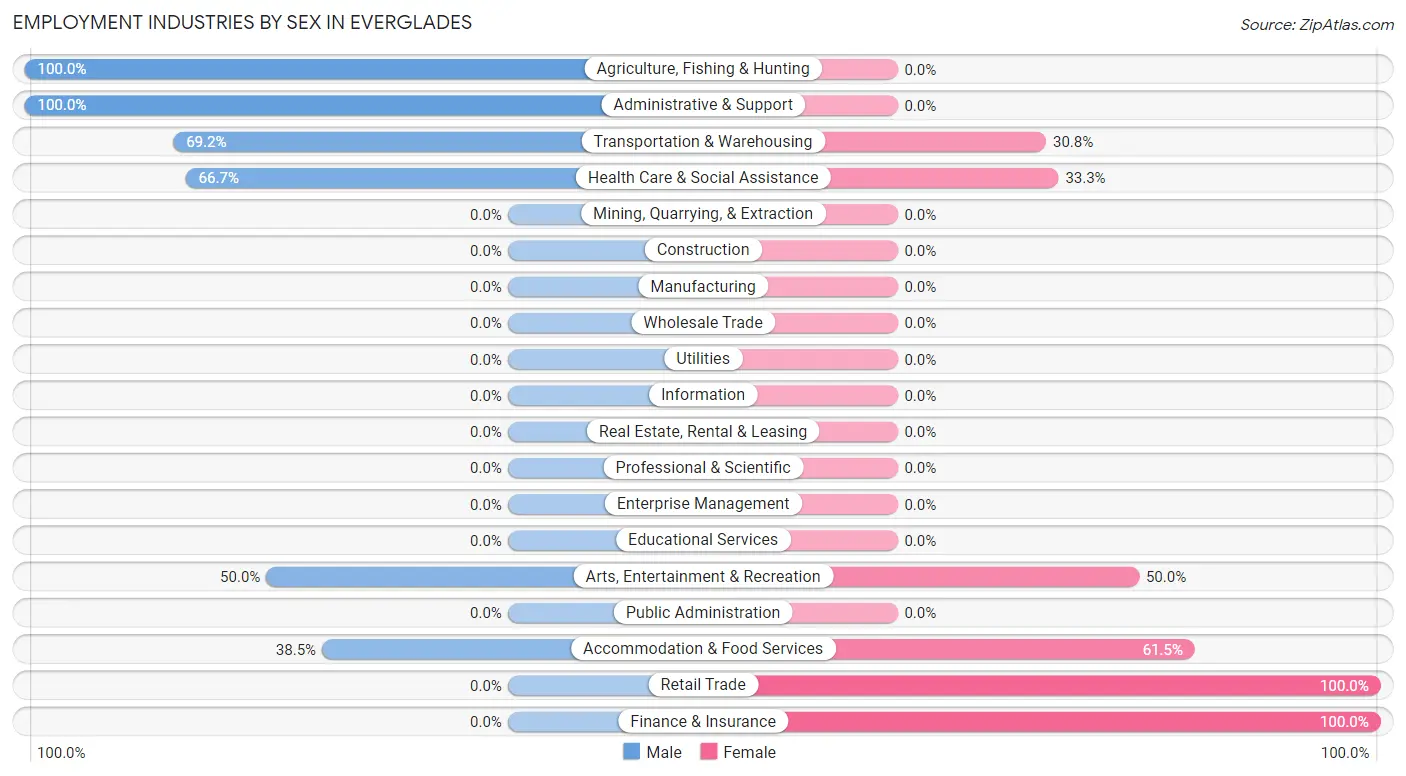
| Industry | Male | Female |
| Agriculture, Fishing & Hunting | 5 (100.0%) | 0 (0.0%) |
| Mining, Quarrying, & Extraction | 0 (0.0%) | 0 (0.0%) |
| Construction | 0 (0.0%) | 0 (0.0%) |
| Manufacturing | 0 (0.0%) | 0 (0.0%) |
| Wholesale Trade | 0 (0.0%) | 0 (0.0%) |
| Retail Trade | 0 (0.0%) | 5 (100.0%) |
| Transportation & Warehousing | 9 (69.2%) | 4 (30.8%) |
| Utilities | 0 (0.0%) | 0 (0.0%) |
| Information | 0 (0.0%) | 0 (0.0%) |
| Finance & Insurance | 0 (0.0%) | 3 (100.0%) |
| Real Estate, Rental & Leasing | 0 (0.0%) | 0 (0.0%) |
| Professional & Scientific | 0 (0.0%) | 0 (0.0%) |
| Enterprise Management | 0 (0.0%) | 0 (0.0%) |
| Administrative & Support | 5 (100.0%) | 0 (0.0%) |
| Educational Services | 0 (0.0%) | 0 (0.0%) |
| Health Care & Social Assistance | 12 (66.7%) | 6 (33.3%) |
| Arts, Entertainment & Recreation | 4 (50.0%) | 4 (50.0%) |
| Accommodation & Food Services | 5 (38.5%) | 8 (61.5%) |
| Public Administration | 0 (0.0%) | 0 (0.0%) |
| Total | 46 (60.5%) | 30 (39.5%) |
Education in Everglades
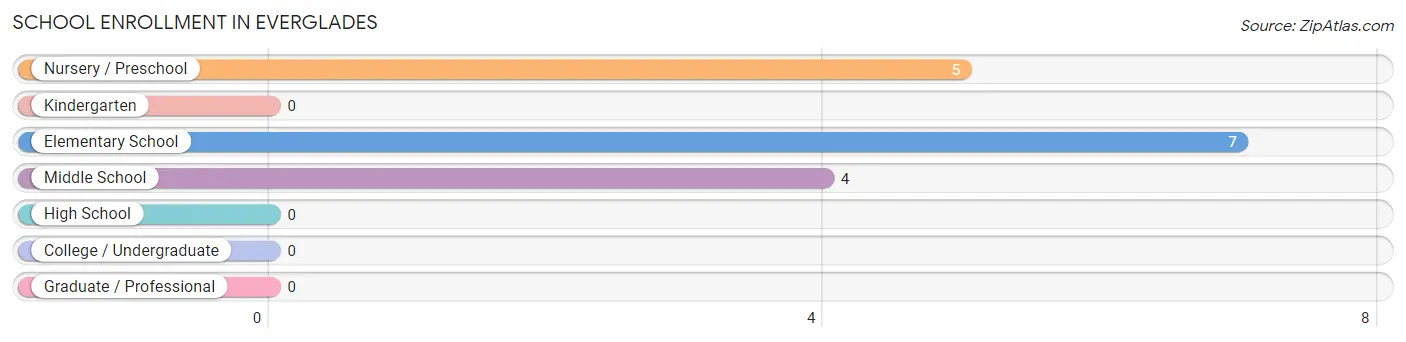
School Enrollment in Everglades
The most common levels of schooling among the 16 students in Everglades are elementary school (7 | 43.8%), nursery / preschool (5 | 31.2%), and middle school (4 | 25.0%).
| School Level | # Students | % Students |
| Nursery / Preschool | 5 | 31.2% |
| Kindergarten | 0 | 0.0% |
| Elementary School | 7 | 43.8% |
| Middle School | 4 | 25.0% |
| High School | 0 | 0.0% |
| College / Undergraduate | 0 | 0.0% |
| Graduate / Professional | 0 | 0.0% |
| Total | 16 | 100.0% |
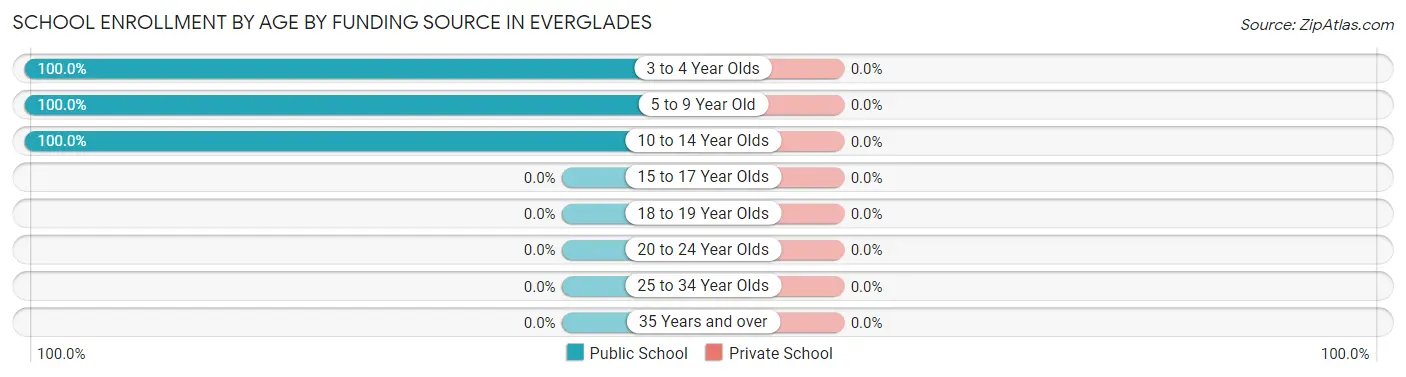
School Enrollment by Age by Funding Source in Everglades
| Age Bracket | Public School | Private School |
| 3 to 4 Year Olds | 5 (100.0%) | 0 (0.0%) |
| 5 to 9 Year Old | 3 (100.0%) | 0 (0.0%) |
| 10 to 14 Year Olds | 8 (100.0%) | 0 (0.0%) |
| 15 to 17 Year Olds | 0 (0.0%) | 0 (0.0%) |
| 18 to 19 Year Olds | 0 (0.0%) | 0 (0.0%) |
| 20 to 24 Year Olds | 0 (0.0%) | 0 (0.0%) |
| 25 to 34 Year Olds | 0 (0.0%) | 0 (0.0%) |
| 35 Years and over | 0 (0.0%) | 0 (0.0%) |
| Total | 16 (100.0%) | 0 (0.0%) |
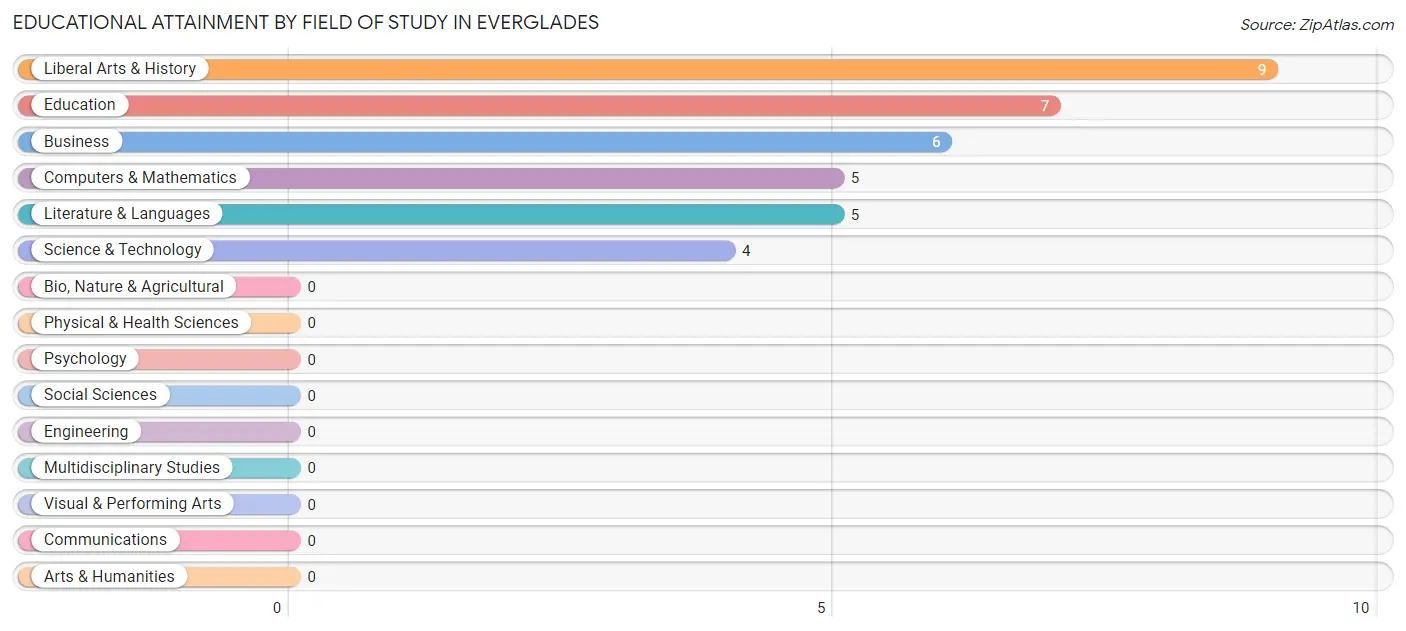
Educational Attainment by Field of Study in Everglades
Liberal arts & history (9 | 25.0%), education (7 | 19.4%), business (6 | 16.7%), computers & mathematics (5 | 13.9%), and literature & languages (5 | 13.9%) are the most common fields of study among 36 individuals in Everglades who have obtained a bachelor's degree or higher.
| Field of Study | # Graduates | % Graduates |
| Computers & Mathematics | 5 | 13.9% |
| Bio, Nature & Agricultural | 0 | 0.0% |
| Physical & Health Sciences | 0 | 0.0% |
| Psychology | 0 | 0.0% |
| Social Sciences | 0 | 0.0% |
| Engineering | 0 | 0.0% |
| Multidisciplinary Studies | 0 | 0.0% |
| Science & Technology | 4 | 11.1% |
| Business | 6 | 16.7% |
| Education | 7 | 19.4% |
| Literature & Languages | 5 | 13.9% |
| Liberal Arts & History | 9 | 25.0% |
| Visual & Performing Arts | 0 | 0.0% |
| Communications | 0 | 0.0% |
| Arts & Humanities | 0 | 0.0% |
| Total | 36 | 100.0% |
Transportation & Commute in Everglades
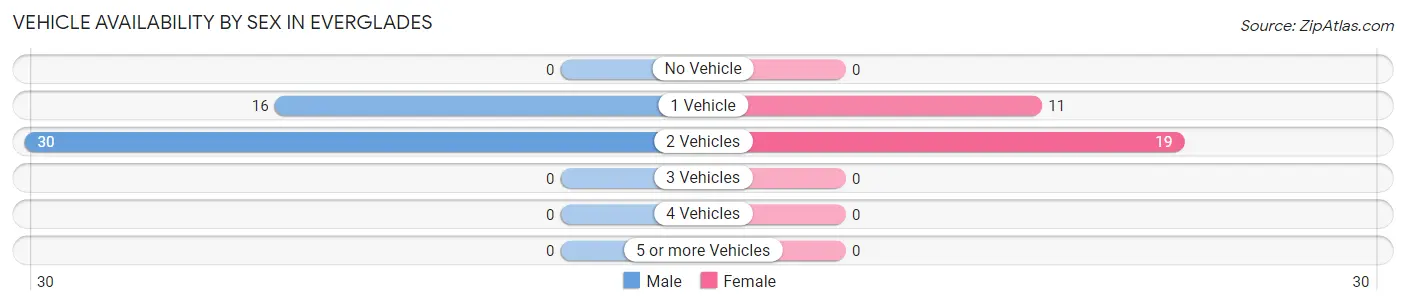
Vehicle Availability by Sex in Everglades
The most prevalent vehicle ownership categories in Everglades are males with 2 vehicles (30, accounting for 65.2%) and females with 2 vehicles (19, making up 100.0%).
| Vehicles Available | Male | Female |
| No Vehicle | 0 (0.0%) | 0 (0.0%) |
| 1 Vehicle | 16 (34.8%) | 11 (36.7%) |
| 2 Vehicles | 30 (65.2%) | 19 (63.3%) |
| 3 Vehicles | 0 (0.0%) | 0 (0.0%) |
| 4 Vehicles | 0 (0.0%) | 0 (0.0%) |
| 5 or more Vehicles | 0 (0.0%) | 0 (0.0%) |
| Total | 46 (100.0%) | 30 (100.0%) |
Commute Time in Everglades
The most frequently occuring commute durations in Everglades are 5 to 9 minutes (23 commuters, 34.3%), 10 to 14 minutes (13 commuters, 19.4%), and 30 to 34 minutes (13 commuters, 19.4%).
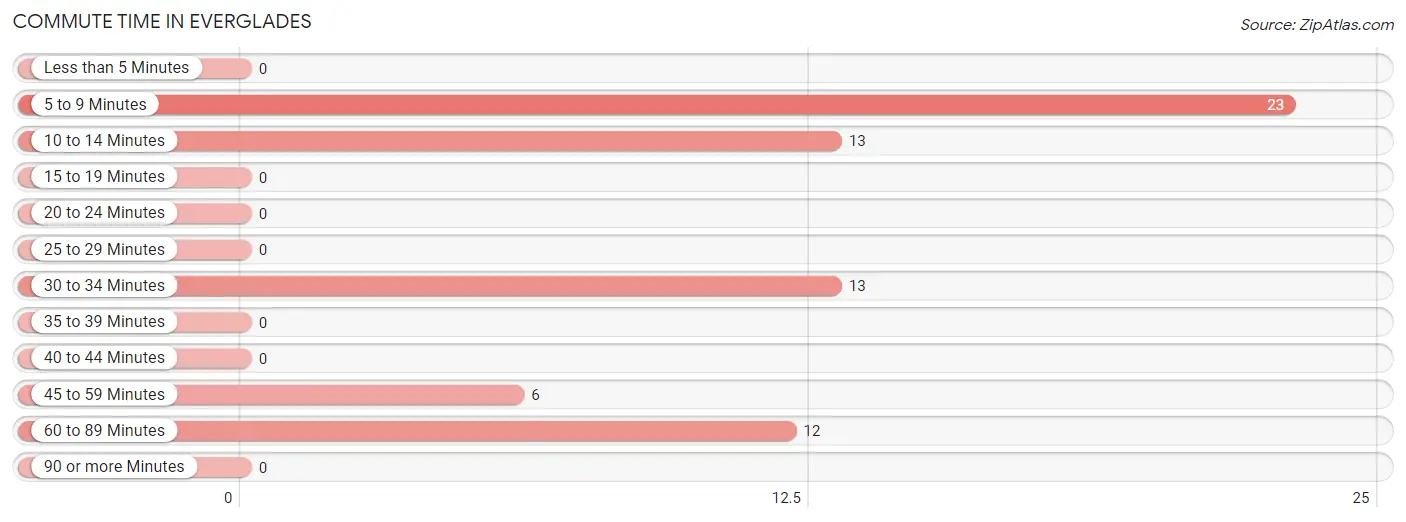
| Commute Time | # Commuters | % Commuters |
| Less than 5 Minutes | 0 | 0.0% |
| 5 to 9 Minutes | 23 | 34.3% |
| 10 to 14 Minutes | 13 | 19.4% |
| 15 to 19 Minutes | 0 | 0.0% |
| 20 to 24 Minutes | 0 | 0.0% |
| 25 to 29 Minutes | 0 | 0.0% |
| 30 to 34 Minutes | 13 | 19.4% |
| 35 to 39 Minutes | 0 | 0.0% |
| 40 to 44 Minutes | 0 | 0.0% |
| 45 to 59 Minutes | 6 | 9.0% |
| 60 to 89 Minutes | 12 | 17.9% |
| 90 or more Minutes | 0 | 0.0% |
Commute Time by Sex in Everglades
The most common commute times in Everglades are 5 to 9 minutes (10 commuters, 25.0%) for males and 5 to 9 minutes (13 commuters, 48.1%) for females.
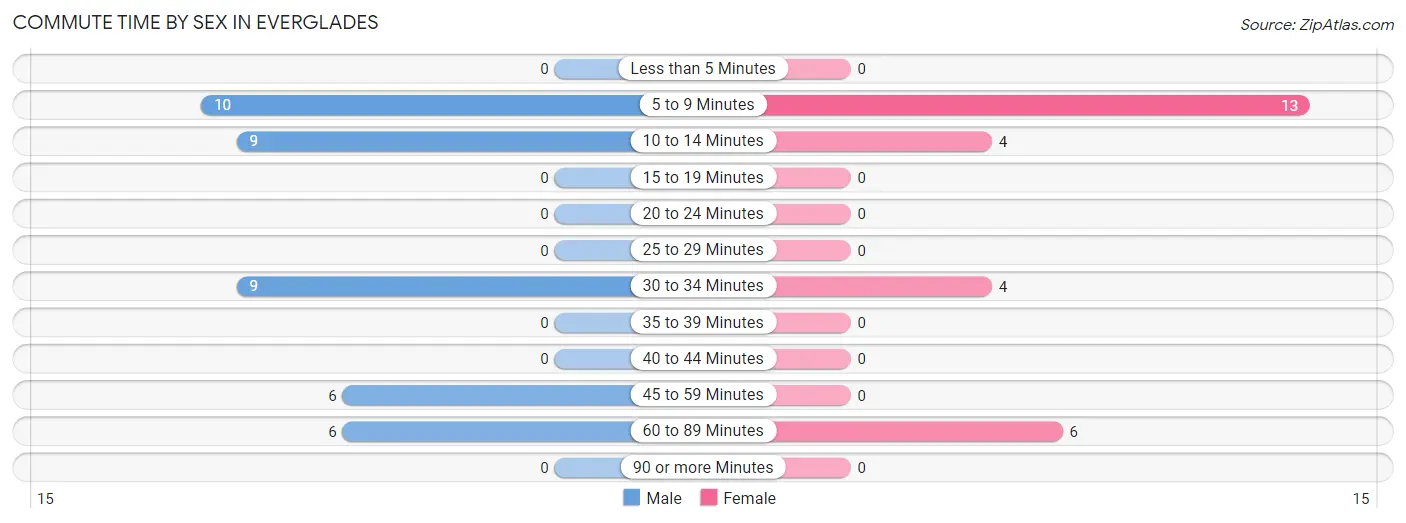
| Commute Time | Male | Female |
| Less than 5 Minutes | 0 (0.0%) | 0 (0.0%) |
| 5 to 9 Minutes | 10 (25.0%) | 13 (48.1%) |
| 10 to 14 Minutes | 9 (22.5%) | 4 (14.8%) |
| 15 to 19 Minutes | 0 (0.0%) | 0 (0.0%) |
| 20 to 24 Minutes | 0 (0.0%) | 0 (0.0%) |
| 25 to 29 Minutes | 0 (0.0%) | 0 (0.0%) |
| 30 to 34 Minutes | 9 (22.5%) | 4 (14.8%) |
| 35 to 39 Minutes | 0 (0.0%) | 0 (0.0%) |
| 40 to 44 Minutes | 0 (0.0%) | 0 (0.0%) |
| 45 to 59 Minutes | 6 (15.0%) | 0 (0.0%) |
| 60 to 89 Minutes | 6 (15.0%) | 6 (22.2%) |
| 90 or more Minutes | 0 (0.0%) | 0 (0.0%) |
Time of Departure to Work by Sex in Everglades
The most frequent times of departure to work in Everglades are 9:00 AM to 9:59 AM (10, 25.0%) for males and 8:00 AM to 8:29 AM (12, 44.4%) for females.
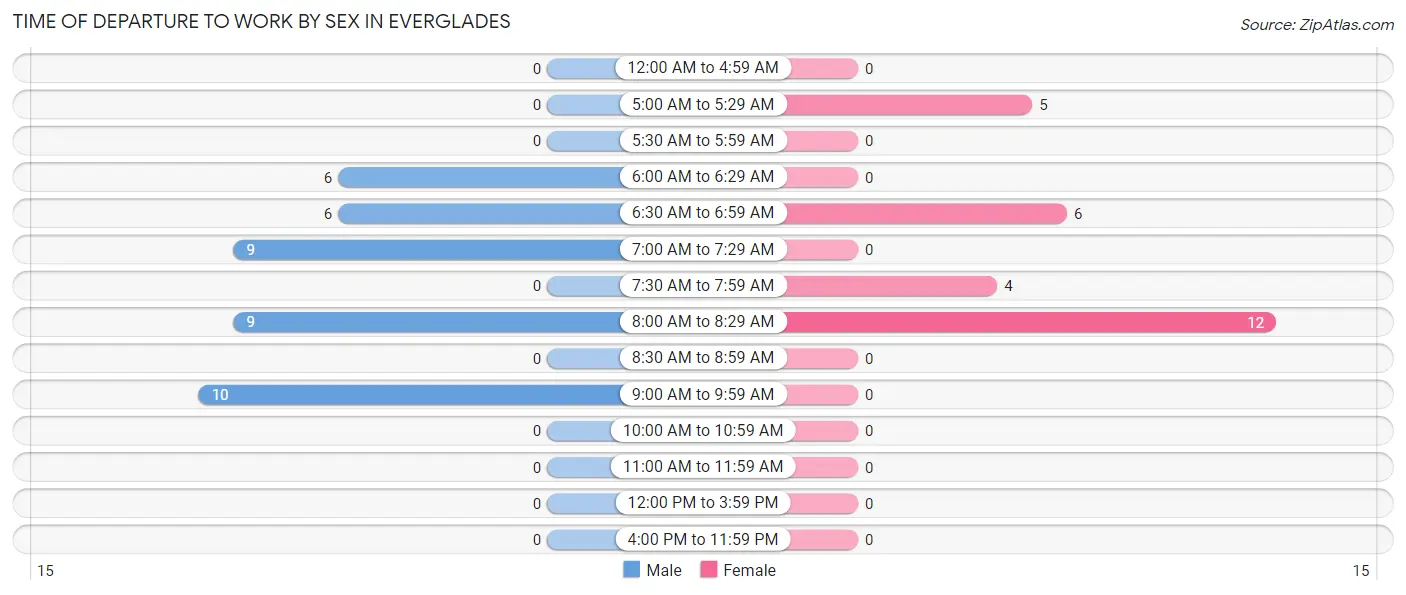
| Time of Departure | Male | Female |
| 12:00 AM to 4:59 AM | 0 (0.0%) | 0 (0.0%) |
| 5:00 AM to 5:29 AM | 0 (0.0%) | 5 (18.5%) |
| 5:30 AM to 5:59 AM | 0 (0.0%) | 0 (0.0%) |
| 6:00 AM to 6:29 AM | 6 (15.0%) | 0 (0.0%) |
| 6:30 AM to 6:59 AM | 6 (15.0%) | 6 (22.2%) |
| 7:00 AM to 7:29 AM | 9 (22.5%) | 0 (0.0%) |
| 7:30 AM to 7:59 AM | 0 (0.0%) | 4 (14.8%) |
| 8:00 AM to 8:29 AM | 9 (22.5%) | 12 (44.4%) |
| 8:30 AM to 8:59 AM | 0 (0.0%) | 0 (0.0%) |
| 9:00 AM to 9:59 AM | 10 (25.0%) | 0 (0.0%) |
| 10:00 AM to 10:59 AM | 0 (0.0%) | 0 (0.0%) |
| 11:00 AM to 11:59 AM | 0 (0.0%) | 0 (0.0%) |
| 12:00 PM to 3:59 PM | 0 (0.0%) | 0 (0.0%) |
| 4:00 PM to 11:59 PM | 0 (0.0%) | 0 (0.0%) |
| Total | 40 (100.0%) | 27 (100.0%) |
Housing Occupancy in Everglades
Occupancy by Ownership in Everglades
Of the total 72 dwellings in Everglades, owner-occupied units account for 68 (94.4%), while renter-occupied units make up 4 (5.6%).
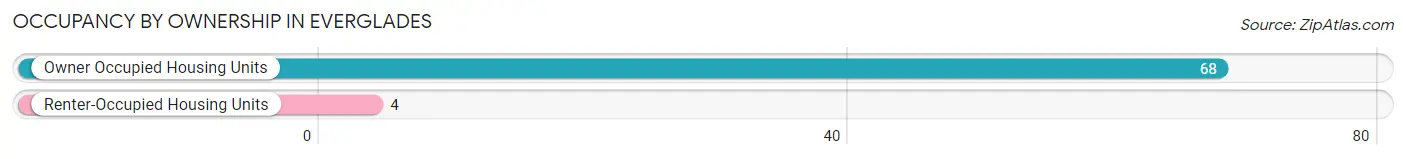
| Occupancy | # Housing Units | % Housing Units |
| Owner Occupied Housing Units | 68 | 94.4% |
| Renter-Occupied Housing Units | 4 | 5.6% |
| Total Occupied Housing Units | 72 | 100.0% |
Occupancy by Household Size in Everglades
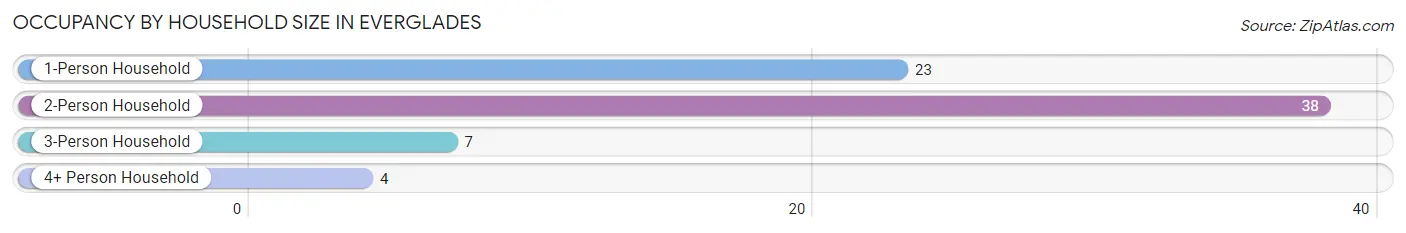
| Household Size | # Housing Units | % Housing Units |
| 1-Person Household | 23 | 31.9% |
| 2-Person Household | 38 | 52.8% |
| 3-Person Household | 7 | 9.7% |
| 4+ Person Household | 4 | 5.6% |
| Total Housing Units | 72 | 100.0% |
Occupancy by Ownership by Household Size in Everglades
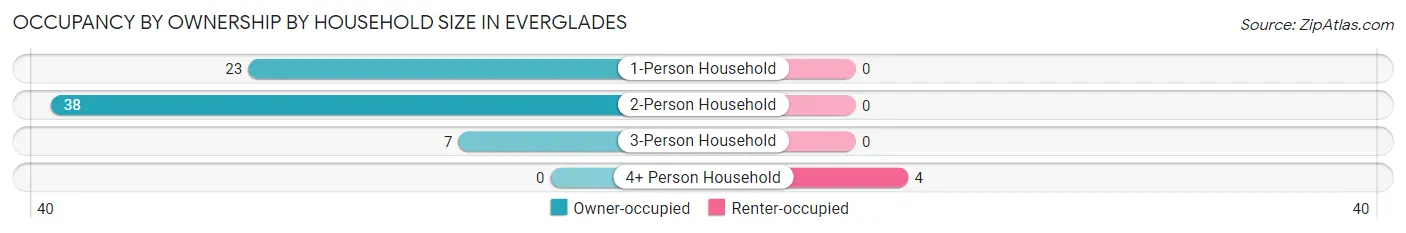
| Household Size | Owner-occupied | Renter-occupied |
| 1-Person Household | 23 (100.0%) | 0 (0.0%) |
| 2-Person Household | 38 (100.0%) | 0 (0.0%) |
| 3-Person Household | 7 (100.0%) | 0 (0.0%) |
| 4+ Person Household | 0 (0.0%) | 4 (100.0%) |
| Total Housing Units | 68 (94.4%) | 4 (5.6%) |
Occupancy by Educational Attainment in Everglades
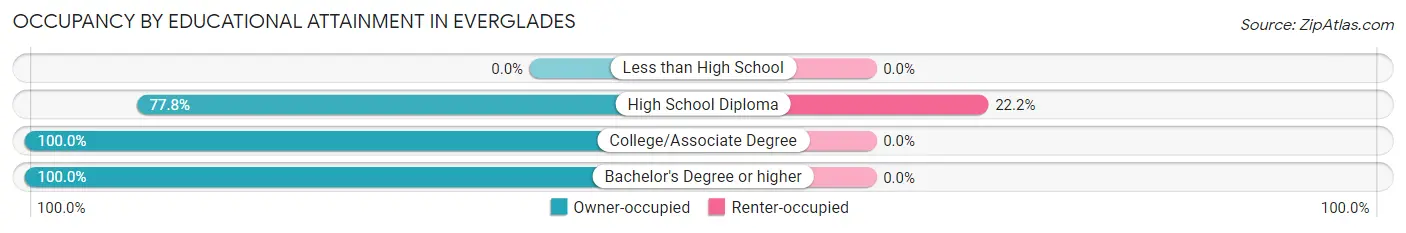
| Household Size | Owner-occupied | Renter-occupied |
| Less than High School | 0 (0.0%) | 0 (0.0%) |
| High School Diploma | 14 (77.8%) | 4 (22.2%) |
| College/Associate Degree | 29 (100.0%) | 0 (0.0%) |
| Bachelor's Degree or higher | 25 (100.0%) | 0 (0.0%) |
Occupancy by Age of Householder in Everglades
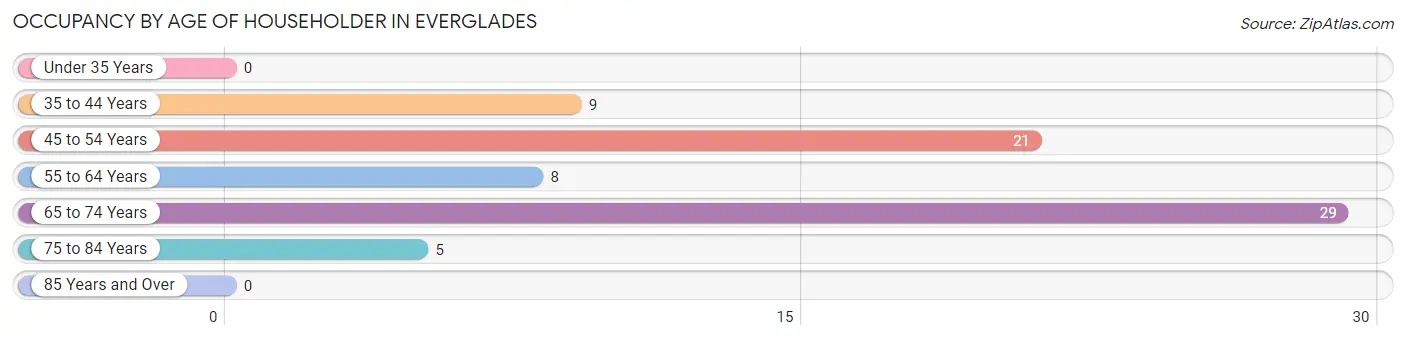
| Age Bracket | # Households | % Households |
| Under 35 Years | 0 | 0.0% |
| 35 to 44 Years | 9 | 12.5% |
| 45 to 54 Years | 21 | 29.2% |
| 55 to 64 Years | 8 | 11.1% |
| 65 to 74 Years | 29 | 40.3% |
| 75 to 84 Years | 5 | 6.9% |
| 85 Years and Over | 0 | 0.0% |
| Total | 72 | 100.0% |
Housing Finances in Everglades
Median Income by Occupancy in Everglades
| Occupancy Type | # Households | Median Income |
| Owner-Occupied | 68 (94.4%) | $0 |
| Renter-Occupied | 4 (5.6%) | $0 |
| Average | 72 (100.0%) | $0 |
Occupancy by Householder Income Bracket in Everglades
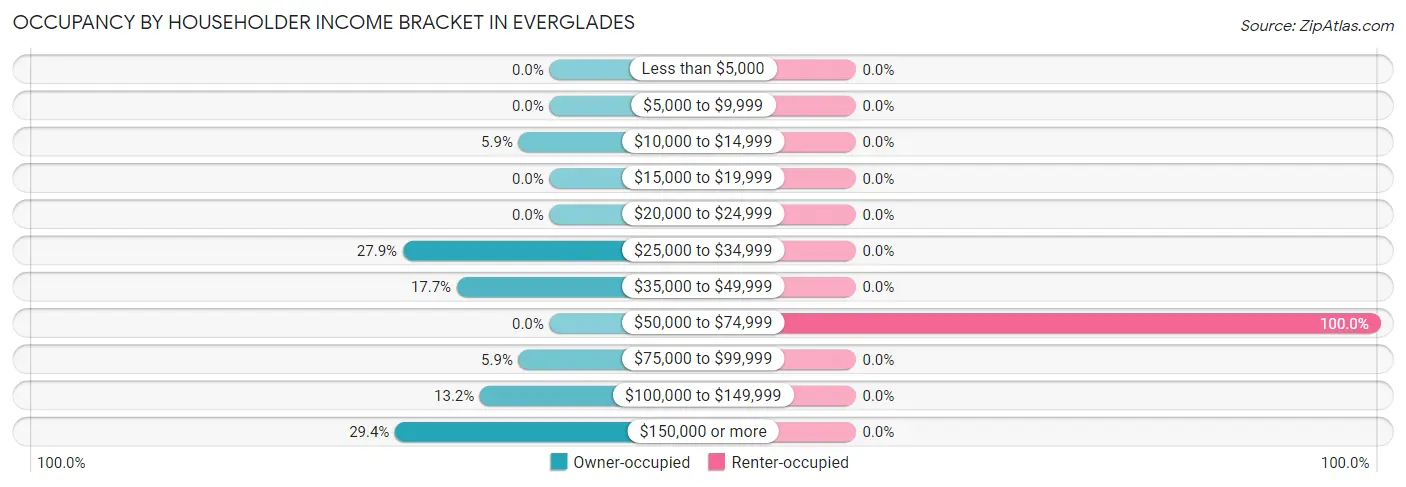
| Income Bracket | Owner-occupied | Renter-occupied |
| Less than $5,000 | 0 (0.0%) | 0 (0.0%) |
| $5,000 to $9,999 | 0 (0.0%) | 0 (0.0%) |
| $10,000 to $14,999 | 4 (5.9%) | 0 (0.0%) |
| $15,000 to $19,999 | 0 (0.0%) | 0 (0.0%) |
| $20,000 to $24,999 | 0 (0.0%) | 0 (0.0%) |
| $25,000 to $34,999 | 19 (27.9%) | 0 (0.0%) |
| $35,000 to $49,999 | 12 (17.6%) | 0 (0.0%) |
| $50,000 to $74,999 | 0 (0.0%) | 4 (100.0%) |
| $75,000 to $99,999 | 4 (5.9%) | 0 (0.0%) |
| $100,000 to $149,999 | 9 (13.2%) | 0 (0.0%) |
| $150,000 or more | 20 (29.4%) | 0 (0.0%) |
| Total | 68 (100.0%) | 4 (100.0%) |
Monthly Housing Cost Tiers in Everglades
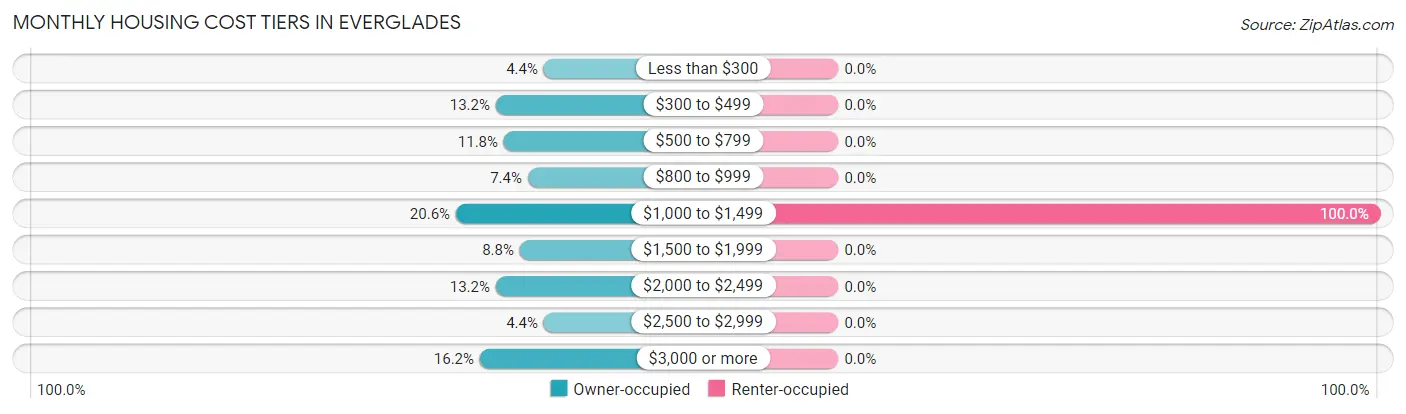
| Monthly Cost | Owner-occupied | Renter-occupied |
| Less than $300 | 3 (4.4%) | 0 (0.0%) |
| $300 to $499 | 9 (13.2%) | 0 (0.0%) |
| $500 to $799 | 8 (11.8%) | 0 (0.0%) |
| $800 to $999 | 5 (7.3%) | 0 (0.0%) |
| $1,000 to $1,499 | 14 (20.6%) | 4 (100.0%) |
| $1,500 to $1,999 | 6 (8.8%) | 0 (0.0%) |
| $2,000 to $2,499 | 9 (13.2%) | 0 (0.0%) |
| $2,500 to $2,999 | 3 (4.4%) | 0 (0.0%) |
| $3,000 or more | 11 (16.2%) | 0 (0.0%) |
| Total | 68 (100.0%) | 4 (100.0%) |
Physical Housing Characteristics in Everglades
Housing Structures in Everglades
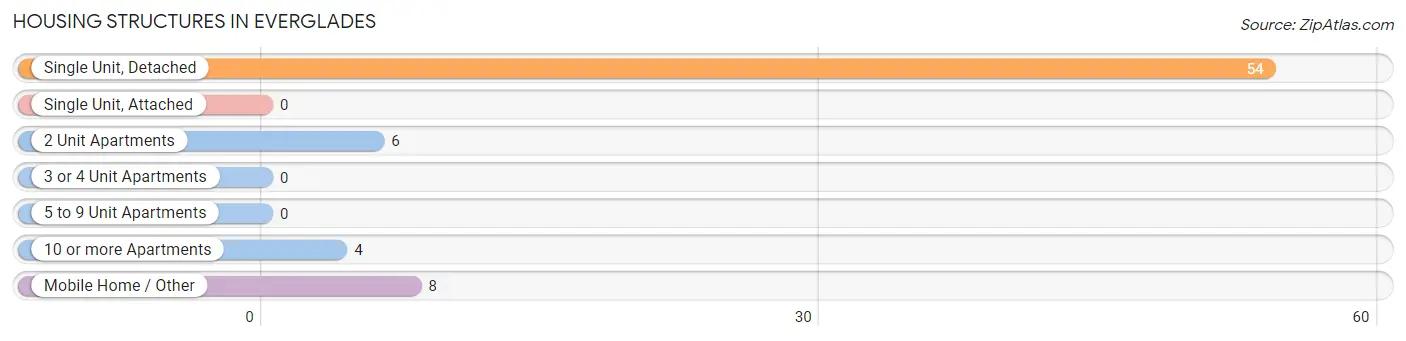
| Structure Type | # Housing Units | % Housing Units |
| Single Unit, Detached | 54 | 75.0% |
| Single Unit, Attached | 0 | 0.0% |
| 2 Unit Apartments | 6 | 8.3% |
| 3 or 4 Unit Apartments | 0 | 0.0% |
| 5 to 9 Unit Apartments | 0 | 0.0% |
| 10 or more Apartments | 4 | 5.6% |
| Mobile Home / Other | 8 | 11.1% |
| Total | 72 | 100.0% |
Housing Structures by Occupancy in Everglades
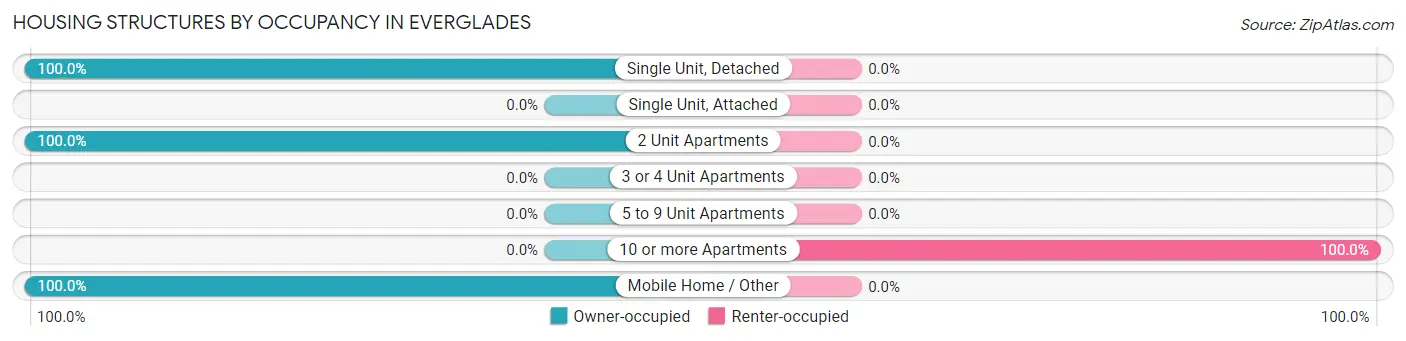
| Structure Type | Owner-occupied | Renter-occupied |
| Single Unit, Detached | 54 (100.0%) | 0 (0.0%) |
| Single Unit, Attached | 0 (0.0%) | 0 (0.0%) |
| 2 Unit Apartments | 6 (100.0%) | 0 (0.0%) |
| 3 or 4 Unit Apartments | 0 (0.0%) | 0 (0.0%) |
| 5 to 9 Unit Apartments | 0 (0.0%) | 0 (0.0%) |
| 10 or more Apartments | 0 (0.0%) | 4 (100.0%) |
| Mobile Home / Other | 8 (100.0%) | 0 (0.0%) |
| Total | 68 (94.4%) | 4 (5.6%) |
Housing Structures by Number of Rooms in Everglades
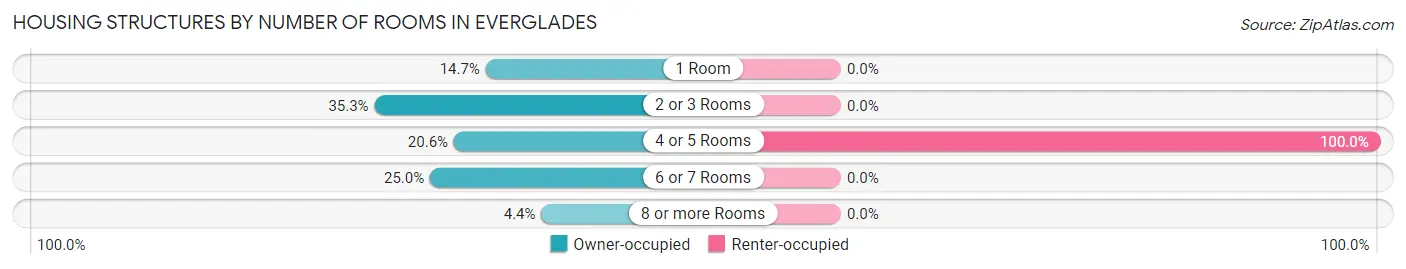
| Number of Rooms | Owner-occupied | Renter-occupied |
| 1 Room | 10 (14.7%) | 0 (0.0%) |
| 2 or 3 Rooms | 24 (35.3%) | 0 (0.0%) |
| 4 or 5 Rooms | 14 (20.6%) | 4 (100.0%) |
| 6 or 7 Rooms | 17 (25.0%) | 0 (0.0%) |
| 8 or more Rooms | 3 (4.4%) | 0 (0.0%) |
| Total | 68 (100.0%) | 4 (100.0%) |
Housing Structure by Heating Type in Everglades
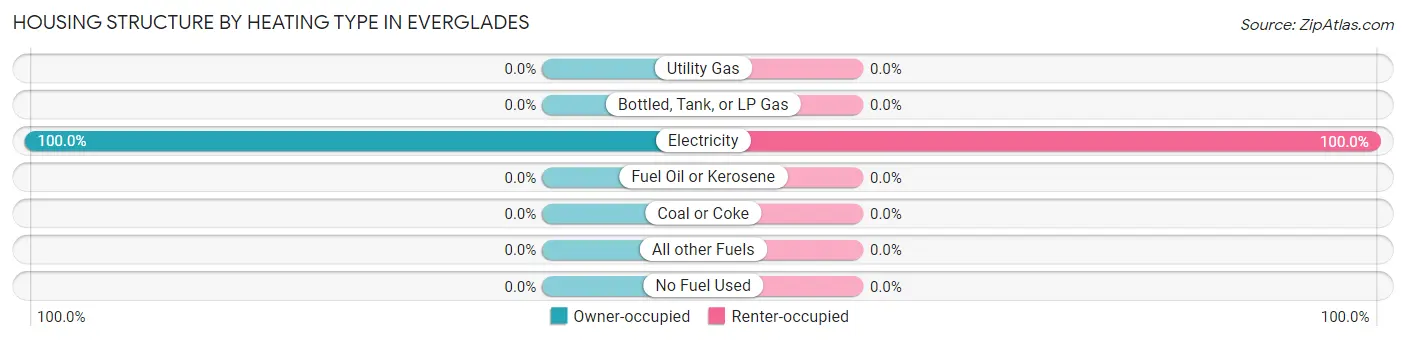
| Heating Type | Owner-occupied | Renter-occupied |
| Utility Gas | 0 (0.0%) | 0 (0.0%) |
| Bottled, Tank, or LP Gas | 0 (0.0%) | 0 (0.0%) |
| Electricity | 68 (100.0%) | 4 (100.0%) |
| Fuel Oil or Kerosene | 0 (0.0%) | 0 (0.0%) |
| Coal or Coke | 0 (0.0%) | 0 (0.0%) |
| All other Fuels | 0 (0.0%) | 0 (0.0%) |
| No Fuel Used | 0 (0.0%) | 0 (0.0%) |
| Total | 68 (100.0%) | 4 (100.0%) |
Household Vehicle Usage in Everglades
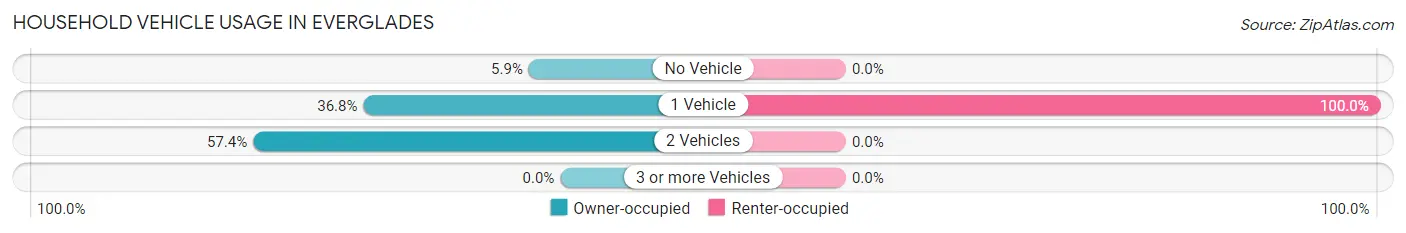
| Vehicles per Household | Owner-occupied | Renter-occupied |
| No Vehicle | 4 (5.9%) | 0 (0.0%) |
| 1 Vehicle | 25 (36.8%) | 4 (100.0%) |
| 2 Vehicles | 39 (57.4%) | 0 (0.0%) |
| 3 or more Vehicles | 0 (0.0%) | 0 (0.0%) |
| Total | 68 (100.0%) | 4 (100.0%) |
Real Estate & Mortgages in Everglades
Real Estate and Mortgage Overview in Everglades
| Characteristic | Without Mortgage | With Mortgage |
| Housing Units | 30 | 38 |
| Median Property Value | $357,100 | $512,500 |
| Median Household Income | $34,464 | $20 |
| Monthly Housing Costs | $675 | $11 |
| Real Estate Taxes | $2,800 | $0 |
Property Value by Mortgage Status in Everglades
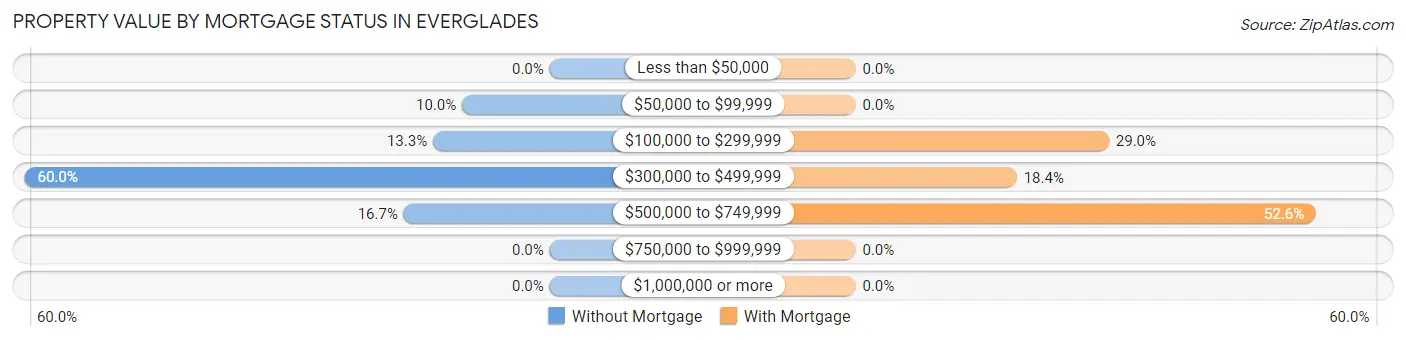
| Property Value | Without Mortgage | With Mortgage |
| Less than $50,000 | 0 (0.0%) | 0 (0.0%) |
| $50,000 to $99,999 | 3 (10.0%) | 0 (0.0%) |
| $100,000 to $299,999 | 4 (13.3%) | 11 (28.9%) |
| $300,000 to $499,999 | 18 (60.0%) | 7 (18.4%) |
| $500,000 to $749,999 | 5 (16.7%) | 20 (52.6%) |
| $750,000 to $999,999 | 0 (0.0%) | 0 (0.0%) |
| $1,000,000 or more | 0 (0.0%) | 0 (0.0%) |
| Total | 30 (100.0%) | 38 (100.0%) |
Household Income by Mortgage Status in Everglades
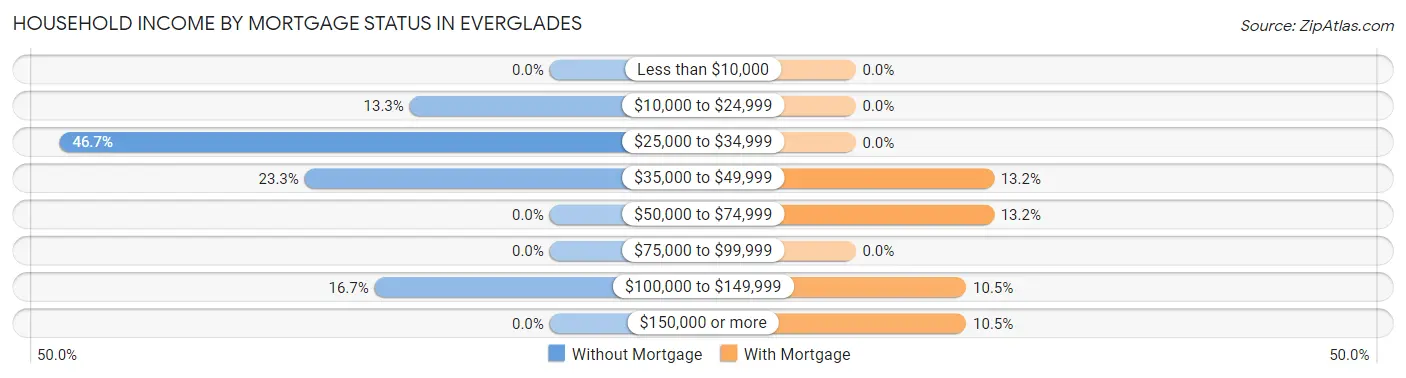
| Household Income | Without Mortgage | With Mortgage |
| Less than $10,000 | 0 (0.0%) | 0 (0.0%) |
| $10,000 to $24,999 | 4 (13.3%) | 0 (0.0%) |
| $25,000 to $34,999 | 14 (46.7%) | 0 (0.0%) |
| $35,000 to $49,999 | 7 (23.3%) | 5 (13.2%) |
| $50,000 to $74,999 | 0 (0.0%) | 5 (13.2%) |
| $75,000 to $99,999 | 0 (0.0%) | 0 (0.0%) |
| $100,000 to $149,999 | 5 (16.7%) | 4 (10.5%) |
| $150,000 or more | 0 (0.0%) | 4 (10.5%) |
| Total | 30 (100.0%) | 38 (100.0%) |
Property Value to Household Income Ratio in Everglades
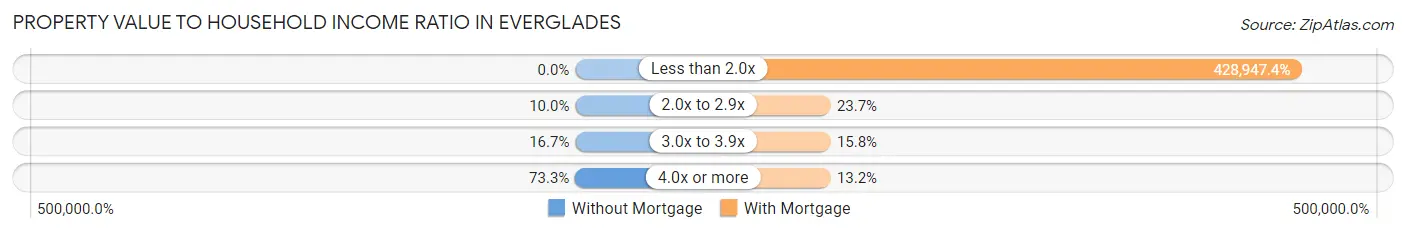
| Value-to-Income Ratio | Without Mortgage | With Mortgage |
| Less than 2.0x | 0 (0.0%) | 163,000 (428,947.4%) |
| 2.0x to 2.9x | 3 (10.0%) | 9 (23.7%) |
| 3.0x to 3.9x | 5 (16.7%) | 6 (15.8%) |
| 4.0x or more | 22 (73.3%) | 5 (13.2%) |
| Total | 30 (100.0%) | 38 (100.0%) |
Real Estate Taxes by Mortgage Status in Everglades
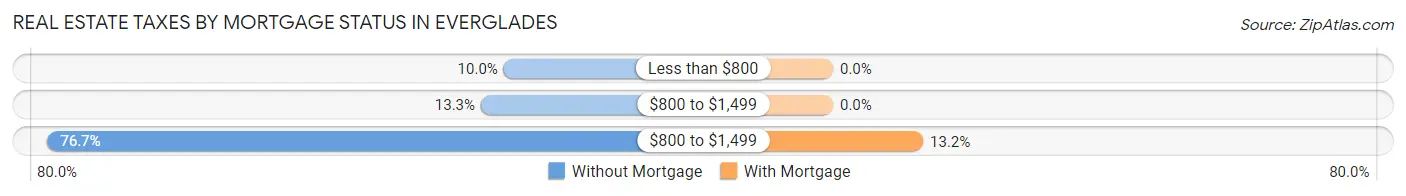
| Property Taxes | Without Mortgage | With Mortgage |
| Less than $800 | 3 (10.0%) | 0 (0.0%) |
| $800 to $1,499 | 4 (13.3%) | 0 (0.0%) |
| $800 to $1,499 | 23 (76.7%) | 5 (13.2%) |
| Total | 30 (100.0%) | 38 (100.0%) |
Health & Disability in Everglades
Health Insurance Coverage by Age in Everglades
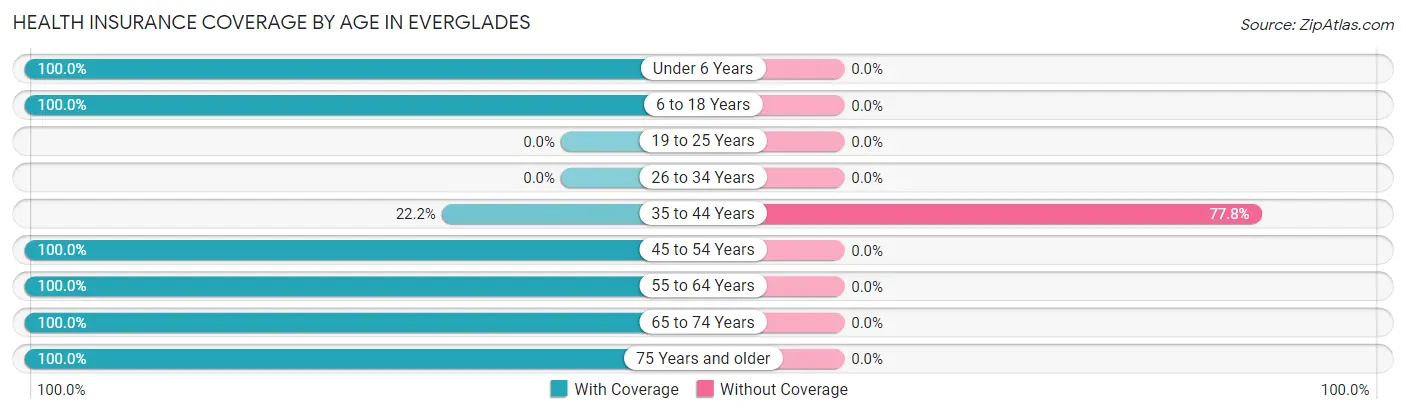
| Age Bracket | With Coverage | Without Coverage |
| Under 6 Years | 5 (100.0%) | 0 (0.0%) |
| 6 to 18 Years | 11 (100.0%) | 0 (0.0%) |
| 19 to 25 Years | 0 (0.0%) | 0 (0.0%) |
| 26 to 34 Years | 0 (0.0%) | 0 (0.0%) |
| 35 to 44 Years | 4 (22.2%) | 14 (77.8%) |
| 45 to 54 Years | 27 (100.0%) | 0 (0.0%) |
| 55 to 64 Years | 28 (100.0%) | 0 (0.0%) |
| 65 to 74 Years | 38 (100.0%) | 0 (0.0%) |
| 75 Years and older | 16 (100.0%) | 0 (0.0%) |
| Total | 129 (90.2%) | 14 (9.8%) |
Health Insurance Coverage by Citizenship Status in Everglades
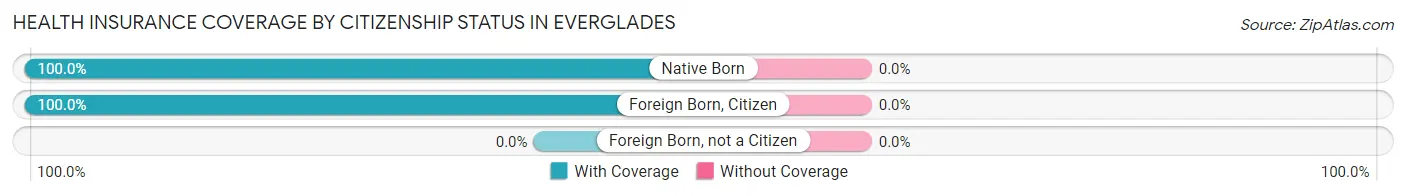
| Citizenship Status | With Coverage | Without Coverage |
| Native Born | 5 (100.0%) | 0 (0.0%) |
| Foreign Born, Citizen | 11 (100.0%) | 0 (0.0%) |
| Foreign Born, not a Citizen | 0 (0.0%) | 0 (0.0%) |
Health Insurance Coverage by Household Income in Everglades
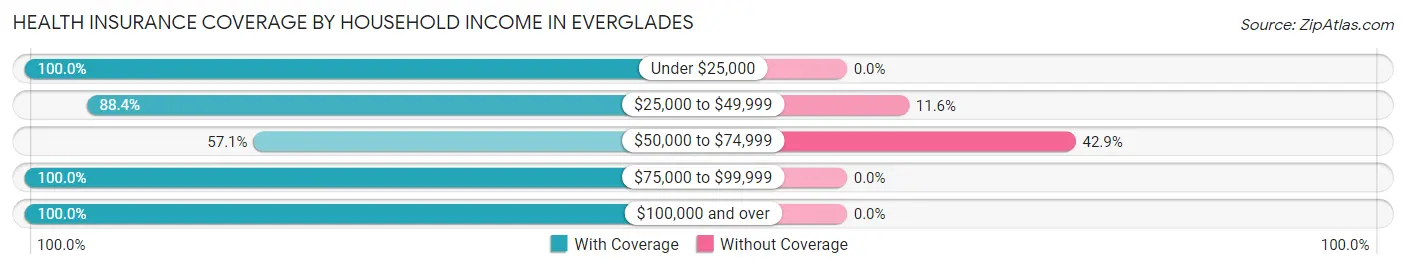
| Household Income | With Coverage | Without Coverage |
| Under $25,000 | 4 (100.0%) | 0 (0.0%) |
| $25,000 to $49,999 | 38 (88.4%) | 5 (11.6%) |
| $50,000 to $74,999 | 12 (57.1%) | 9 (42.9%) |
| $75,000 to $99,999 | 9 (100.0%) | 0 (0.0%) |
| $100,000 and over | 66 (100.0%) | 0 (0.0%) |
Public vs Private Health Insurance Coverage by Age in Everglades
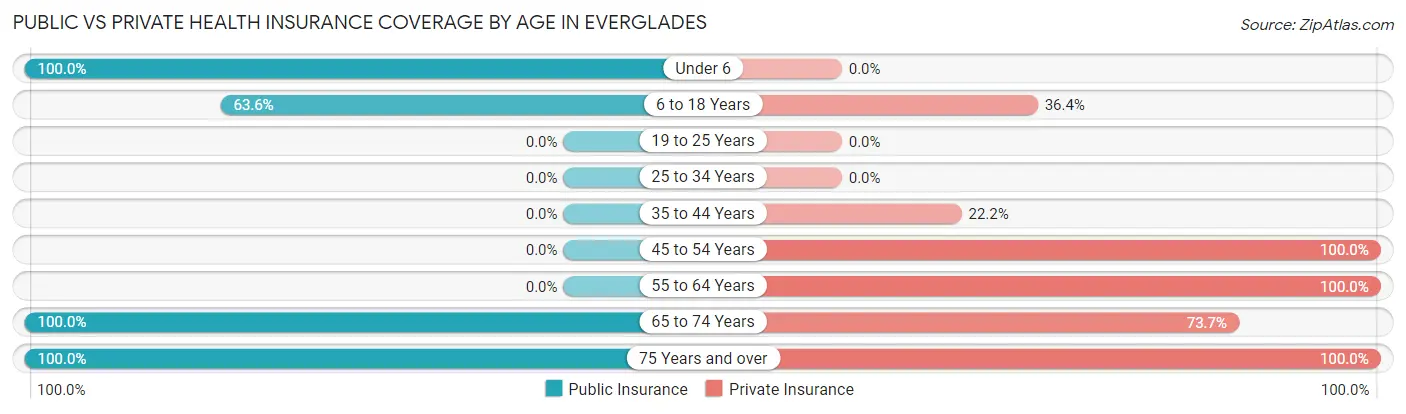
| Age Bracket | Public Insurance | Private Insurance |
| Under 6 | 5 (100.0%) | 0 (0.0%) |
| 6 to 18 Years | 7 (63.6%) | 4 (36.4%) |
| 19 to 25 Years | 0 (0.0%) | 0 (0.0%) |
| 25 to 34 Years | 0 (0.0%) | 0 (0.0%) |
| 35 to 44 Years | 0 (0.0%) | 4 (22.2%) |
| 45 to 54 Years | 0 (0.0%) | 27 (100.0%) |
| 55 to 64 Years | 0 (0.0%) | 28 (100.0%) |
| 65 to 74 Years | 38 (100.0%) | 28 (73.7%) |
| 75 Years and over | 16 (100.0%) | 16 (100.0%) |
| Total | 66 (46.2%) | 107 (74.8%) |
Disability Status by Sex by Age in Everglades
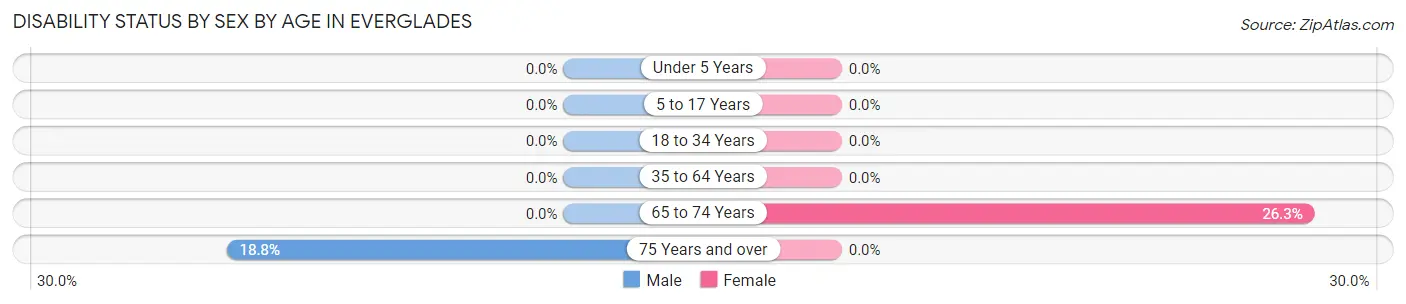
| Age Bracket | Male | Female |
| Under 5 Years | 0 (0.0%) | 0 (0.0%) |
| 5 to 17 Years | 0 (0.0%) | 0 (0.0%) |
| 18 to 34 Years | 0 (0.0%) | 0 (0.0%) |
| 35 to 64 Years | 0 (0.0%) | 0 (0.0%) |
| 65 to 74 Years | 0 (0.0%) | 5 (26.3%) |
| 75 Years and over | 3 (18.8%) | 0 (0.0%) |
Disability Class by Sex by Age in Everglades
Disability Class: Hearing Difficulty
| Age Bracket | Male | Female |
| Under 5 Years | 0 (0.0%) | 0 (0.0%) |
| 5 to 17 Years | 0 (0.0%) | 0 (0.0%) |
| 18 to 34 Years | 0 (0.0%) | 0 (0.0%) |
| 35 to 64 Years | 0 (0.0%) | 0 (0.0%) |
| 65 to 74 Years | 0 (0.0%) | 0 (0.0%) |
| 75 Years and over | 0 (0.0%) | 0 (0.0%) |
Disability Class: Vision Difficulty
| Age Bracket | Male | Female |
| Under 5 Years | 0 (0.0%) | 0 (0.0%) |
| 5 to 17 Years | 0 (0.0%) | 0 (0.0%) |
| 18 to 34 Years | 0 (0.0%) | 0 (0.0%) |
| 35 to 64 Years | 0 (0.0%) | 0 (0.0%) |
| 65 to 74 Years | 0 (0.0%) | 0 (0.0%) |
| 75 Years and over | 0 (0.0%) | 0 (0.0%) |
Disability Class: Cognitive Difficulty

| Age Bracket | Male | Female |
| 5 to 17 Years | 0 (0.0%) | 0 (0.0%) |
| 18 to 34 Years | 0 (0.0%) | 0 (0.0%) |
| 35 to 64 Years | 0 (0.0%) | 0 (0.0%) |
| 65 to 74 Years | 0 (0.0%) | 5 (26.3%) |
| 75 Years and over | 0 (0.0%) | 0 (0.0%) |
Disability Class: Ambulatory Difficulty
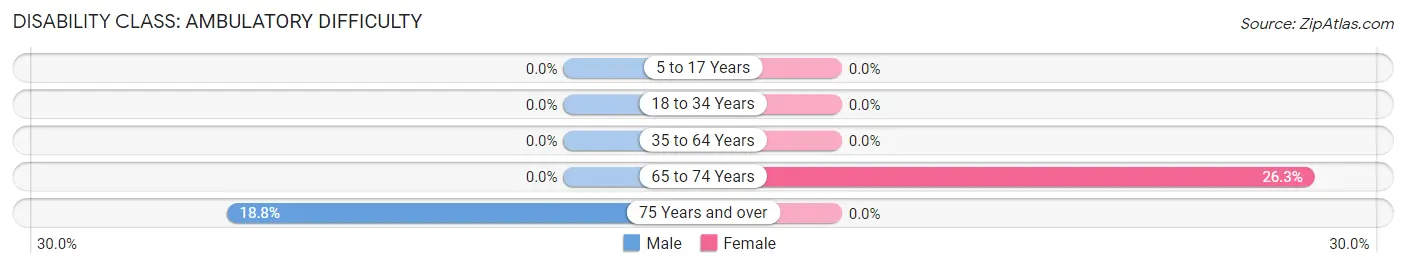
| Age Bracket | Male | Female |
| 5 to 17 Years | 0 (0.0%) | 0 (0.0%) |
| 18 to 34 Years | 0 (0.0%) | 0 (0.0%) |
| 35 to 64 Years | 0 (0.0%) | 0 (0.0%) |
| 65 to 74 Years | 0 (0.0%) | 5 (26.3%) |
| 75 Years and over | 3 (18.8%) | 0 (0.0%) |
Disability Class: Self-Care Difficulty
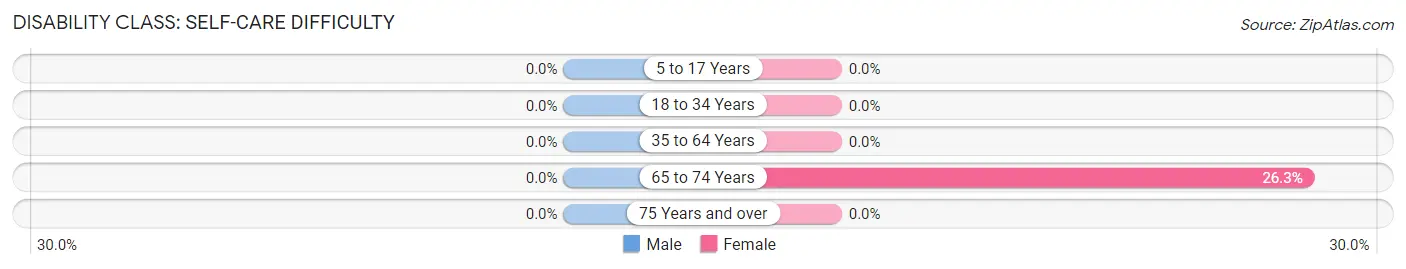
| Age Bracket | Male | Female |
| 5 to 17 Years | 0 (0.0%) | 0 (0.0%) |
| 18 to 34 Years | 0 (0.0%) | 0 (0.0%) |
| 35 to 64 Years | 0 (0.0%) | 0 (0.0%) |
| 65 to 74 Years | 0 (0.0%) | 5 (26.3%) |
| 75 Years and over | 0 (0.0%) | 0 (0.0%) |
Technology Access in Everglades
Computing Device Access in Everglades
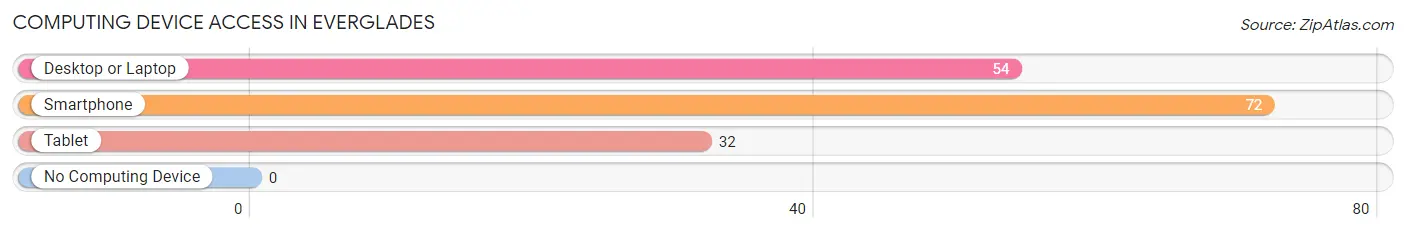
| Device Type | # Households | % Households |
| Desktop or Laptop | 54 | 75.0% |
| Smartphone | 72 | 100.0% |
| Tablet | 32 | 44.4% |
| No Computing Device | 0 | 0.0% |
| Total | 72 | 100.0% |
Internet Access in Everglades
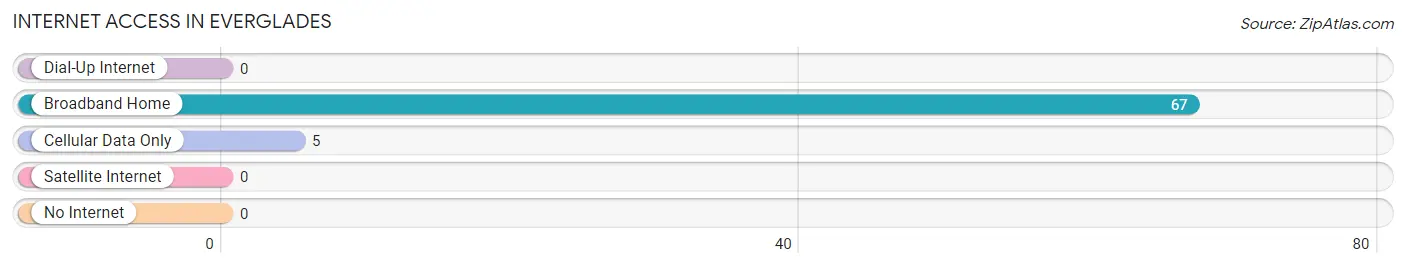
| Internet Type | # Households | % Households |
| Dial-Up Internet | 0 | 0.0% |
| Broadband Home | 67 | 93.1% |
| Cellular Data Only | 5 | 6.9% |
| Satellite Internet | 0 | 0.0% |
| No Internet | 0 | 0.0% |
| Total | 72 | 100.0% |
Everglades Summary
The Everglades is a vast, subtropical wetland located in the southern portion of the U.S. state of Florida. It is the largest subtropical wilderness in the United States and is home to a variety of plant and animal species, including the endangered Florida panther. The Everglades is a unique and fragile ecosystem that has been threatened by human activities for decades.
History
The Everglades has been inhabited by humans for thousands of years. The first known inhabitants were the Calusa Indians, who lived in the area for centuries before the arrival of Europeans. The Calusa were a powerful tribe that controlled much of the area and were known for their elaborate shell mounds and canals.
The first Europeans to explore the Everglades were Spanish explorers in the 16th century. They named the area “Los Glades”, which means “the grassy plains”. The area was largely ignored by Europeans until the 19th century, when settlers began to move into the area.
In the late 19th century, the U.S. government began to drain the Everglades in order to create more land for farming and development. This led to the destruction of much of the natural habitat and the displacement of many of the native species.
In the early 20th century, the Everglades was declared a national park in order to protect the remaining wildlife and habitat. The park was expanded in 1947 and again in 1989. Today, the Everglades National Park covers more than 2,400 square miles and is home to a variety of plant and animal species.
Geography
The Everglades is located in the southern portion of the U.S. state of Florida. It covers more than 2,400 square miles and is bordered by the Gulf of Mexico to the west, Lake Okeechobee to the north, and the Atlantic Ocean to the east. The Everglades is divided into three distinct regions: the northern Everglades, the central Everglades, and the southern Everglades.
The northern Everglades is a freshwater marshland that is home to a variety of plant and animal species. The central Everglades is a vast sawgrass marsh that is home to the endangered Florida panther. The southern Everglades is a mangrove swamp that is home to a variety of birds and other wildlife.
Economy
The Everglades is an important economic resource for the state of Florida. The area is home to a variety of industries, including tourism, fishing, hunting, and agriculture. Tourism is the largest industry in the Everglades, with millions of visitors each year. Fishing and hunting are also popular activities in the area, and the Everglades is home to a variety of fish and game species.
Agriculture is also an important part of the Everglades economy. The area is home to a variety of crops, including sugarcane, tomatoes, and citrus fruits. The Everglades is also home to a variety of livestock, including cattle, horses, and hogs.
Demographics
The Everglades is home to a variety of ethnic and racial groups. The largest group is the Seminole Indians, who have lived in the area for centuries. Other groups include African Americans, Hispanics, and whites.
The population of the Everglades is estimated to be around 1.5 million people. The majority of the population is concentrated in the cities of Miami, Fort Lauderdale, and West Palm Beach. The population of the Everglades is growing rapidly, due to the influx of people from other parts of the United States and other countries.
Conclusion
The Everglades is a unique and fragile ecosystem that has been threatened by human activities for decades. It is home to a variety of plant and animal species, including the endangered Florida panther. The area is an important economic resource for the state of Florida, with millions of visitors each year and a variety of industries. The population of the Everglades is estimated to be around 1.5 million people, with the majority of the population concentrated in the cities of Miami, Fort Lauderdale, and West Palm Beach.
Common Questions
What is Per Capita Income in Everglades?
Per Capita income in Everglades is $46,561.
What is the Median Family Income in Everglades?
Median Family Income in Everglades is $105,250.
What is Inequality or Gini Index in Everglades?
Inequality or Gini Index in Everglades is 0.43.
What is the Total Population of Everglades?
Total Population of Everglades is 143.
What is the Total Male Population of Everglades?
Total Male Population of Everglades is 85.
What is the Total Female Population of Everglades?
Total Female Population of Everglades is 58.
What is the Ratio of Males per 100 Females in Everglades?
There are 146.55 Males per 100 Females in Everglades.
What is the Ratio of Females per 100 Males in Everglades?
There are 68.24 Females per 100 Males in Everglades.
What is the Median Population Age in Everglades?
Median Population Age in Everglades is 59.9 Years.
What is the Average Family Size in Everglades
Average Family Size in Everglades is 2.3 People.
What is the Average Household Size in Everglades
Average Household Size in Everglades is 2.0 People.
How Large is the Labor Force in Everglades?
There are 76 People in the Labor Forcein in Everglades.
What is the Percentage of People in the Labor Force in Everglades?
59.8% of People are in the Labor Force in Everglades.