Paradise Heights, FL Map & Demographics
Paradise Heights Map
Paradise Heights Overview
$44,642
PER CAPITA INCOME
$126,250
AVG FAMILY INCOME
0.46
INEQUALITY / GINI INDEX
808
TOTAL POPULATION
468
MALE POPULATION
340
FEMALE POPULATION
137.65
MALES / 100 FEMALES
72.65
FEMALES / 100 MALES
56.0
MEDIAN AGE
2.3
AVG FAMILY SIZE
1.6
AVG HOUSEHOLD SIZE
561
LABOR FORCE [ PEOPLE ]
75.3%
PERCENT IN LABOR FORCE
Income in Paradise Heights
Income Overview in Paradise Heights
| Characteristic | Number | Measure |
| Per Capita Income | 808 | $44,642 |
| Median Family Income | 176 | $126,250 |
| Mean Family Income | 176 | $144,570 |
| Median Household Income | 492 | $0 |
| Mean Household Income | 492 | $74,102 |
| Income Deficit | 176 | $0 |
| Wage / Income Gap (%) | 808 | 0.00% |
| Wage / Income Gap ($) | 808 | 100.00¢ per $1 |
| Gini / Inequality Index | 808 | 0.46 |
Earnings by Sex in Paradise Heights
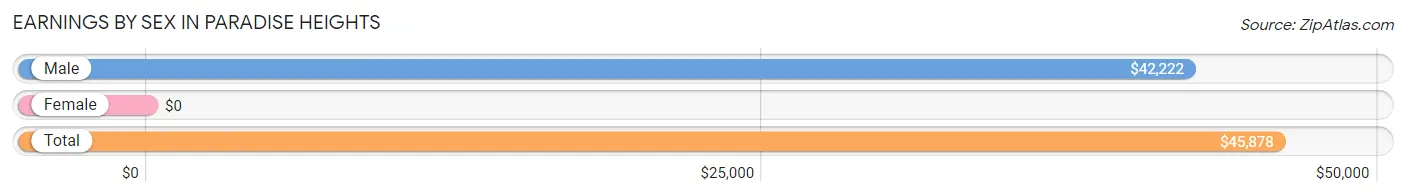
| Sex | Number | Average Earnings |
| Male | 342 (61.0%) | $42,222 |
| Female | 219 (39.0%) | $0 |
| Total | 561 (100.0%) | $45,878 |
Earnings by Sex by Income Bracket in Paradise Heights
The most common earnings brackets in Paradise Heights are $20,000 to $22,499 for men (104 | 30.4%) and $2,499 or less for women (63 | 28.8%).
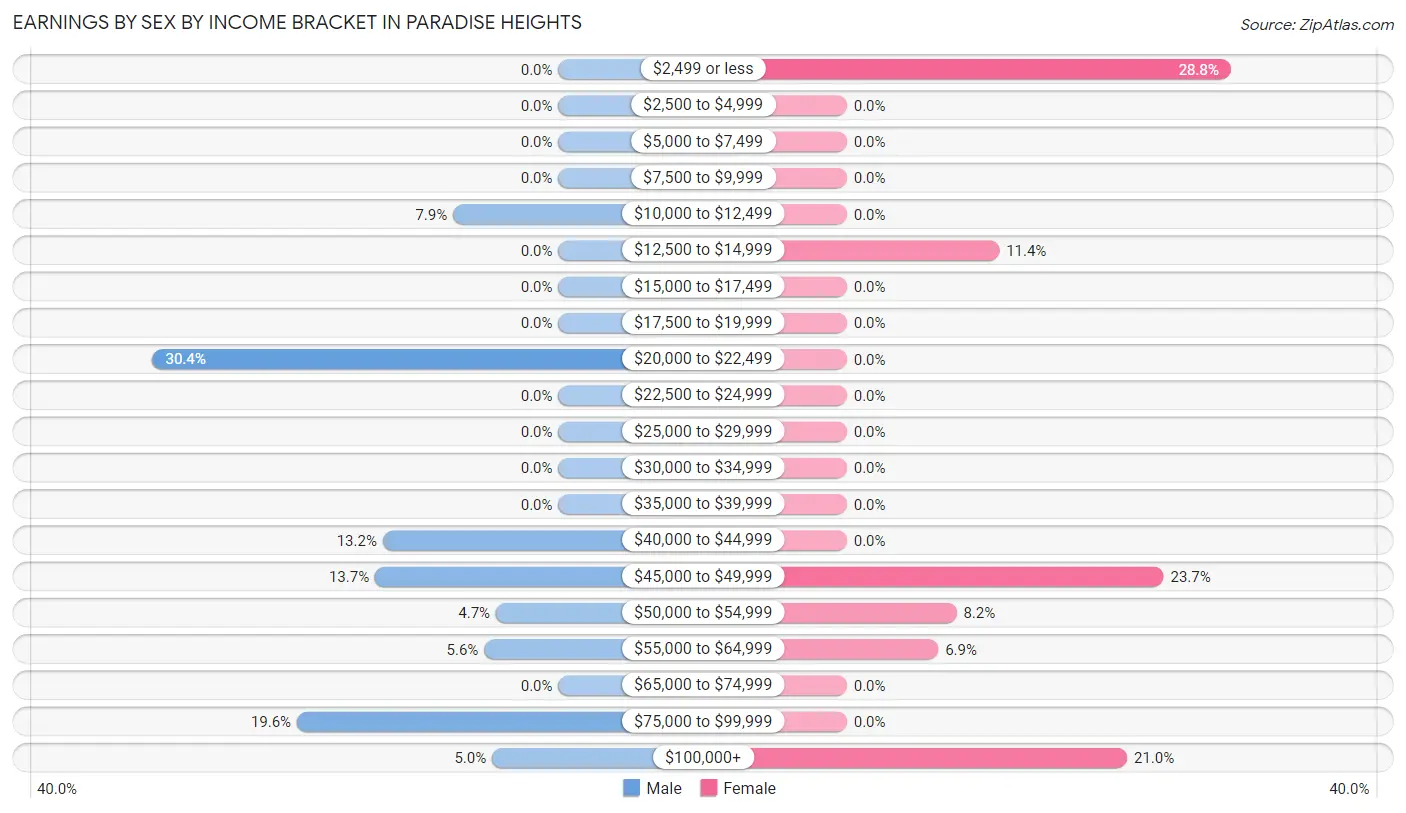
| Income | Male | Female |
| $2,499 or less | 0 (0.0%) | 63 (28.8%) |
| $2,500 to $4,999 | 0 (0.0%) | 0 (0.0%) |
| $5,000 to $7,499 | 0 (0.0%) | 0 (0.0%) |
| $7,500 to $9,999 | 0 (0.0%) | 0 (0.0%) |
| $10,000 to $12,499 | 27 (7.9%) | 0 (0.0%) |
| $12,500 to $14,999 | 0 (0.0%) | 25 (11.4%) |
| $15,000 to $17,499 | 0 (0.0%) | 0 (0.0%) |
| $17,500 to $19,999 | 0 (0.0%) | 0 (0.0%) |
| $20,000 to $22,499 | 104 (30.4%) | 0 (0.0%) |
| $22,500 to $24,999 | 0 (0.0%) | 0 (0.0%) |
| $25,000 to $29,999 | 0 (0.0%) | 0 (0.0%) |
| $30,000 to $34,999 | 0 (0.0%) | 0 (0.0%) |
| $35,000 to $39,999 | 0 (0.0%) | 0 (0.0%) |
| $40,000 to $44,999 | 45 (13.2%) | 0 (0.0%) |
| $45,000 to $49,999 | 47 (13.7%) | 52 (23.7%) |
| $50,000 to $54,999 | 16 (4.7%) | 18 (8.2%) |
| $55,000 to $64,999 | 19 (5.6%) | 15 (6.9%) |
| $65,000 to $74,999 | 0 (0.0%) | 0 (0.0%) |
| $75,000 to $99,999 | 67 (19.6%) | 0 (0.0%) |
| $100,000+ | 17 (5.0%) | 46 (21.0%) |
| Total | 342 (100.0%) | 219 (100.0%) |
Earnings by Sex by Educational Attainment in Paradise Heights
| Educational Attainment | Male Income | Female Income |
| Less than High School | - | - |
| High School Diploma | - | - |
| College or Associate's Degree | - | - |
| Bachelor's Degree | - | - |
| Graduate Degree | - | - |
| Total | $42,222 | $0 |
Family Income in Paradise Heights
Family Income Brackets in Paradise Heights
According to the Paradise Heights family income data, there are 71 families falling into the $100,000 to $149,999 income range, which is the most common income bracket and makes up 40.3% of all families.
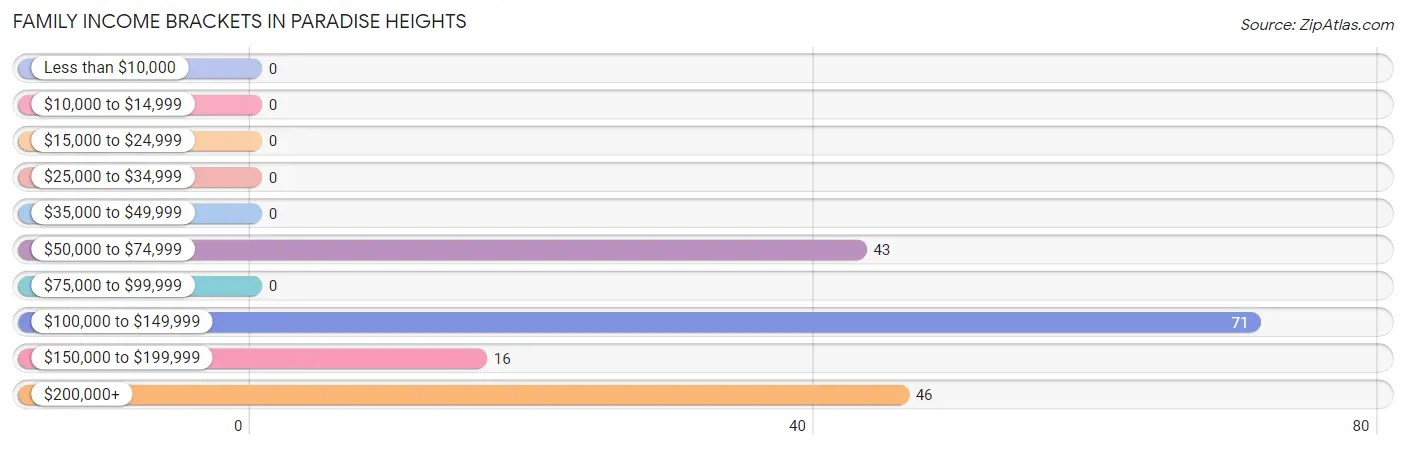
| Income Bracket | # Families | % Families |
| Less than $10,000 | 0 | 0.0% |
| $10,000 to $14,999 | 0 | 0.0% |
| $15,000 to $24,999 | 0 | 0.0% |
| $25,000 to $34,999 | 0 | 0.0% |
| $35,000 to $49,999 | 0 | 0.0% |
| $50,000 to $74,999 | 43 | 24.4% |
| $75,000 to $99,999 | 0 | 0.0% |
| $100,000 to $149,999 | 71 | 40.3% |
| $150,000 to $199,999 | 16 | 9.1% |
| $200,000+ | 46 | 26.1% |
Family Income by Famaliy Size in Paradise Heights
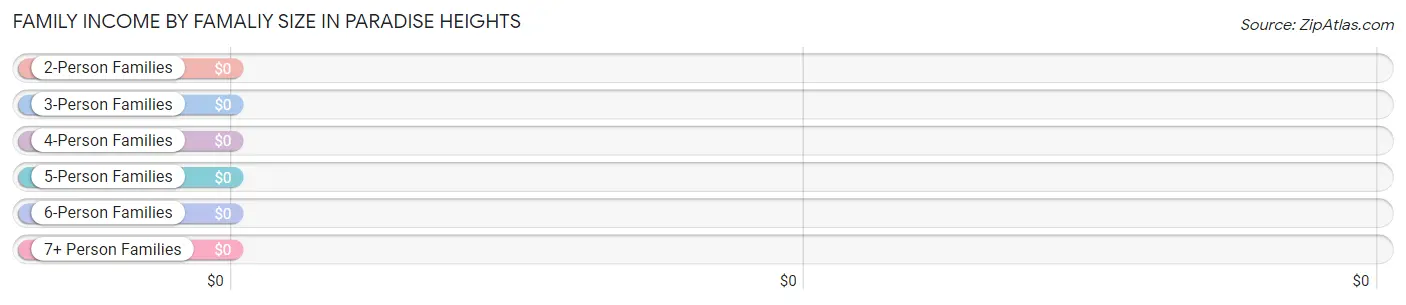
| Income Bracket | # Families | Median Income |
| 2-Person Families | 124 (70.5%) | $0 |
| 3-Person Families | 52 (29.5%) | $0 |
| 4-Person Families | 0 (0.0%) | $0 |
| 5-Person Families | 0 (0.0%) | $0 |
| 6-Person Families | 0 (0.0%) | $0 |
| 7+ Person Families | 0 (0.0%) | $0 |
| Total | 176 (100.0%) | $126,250 |
Family Income by Number of Earners in Paradise Heights
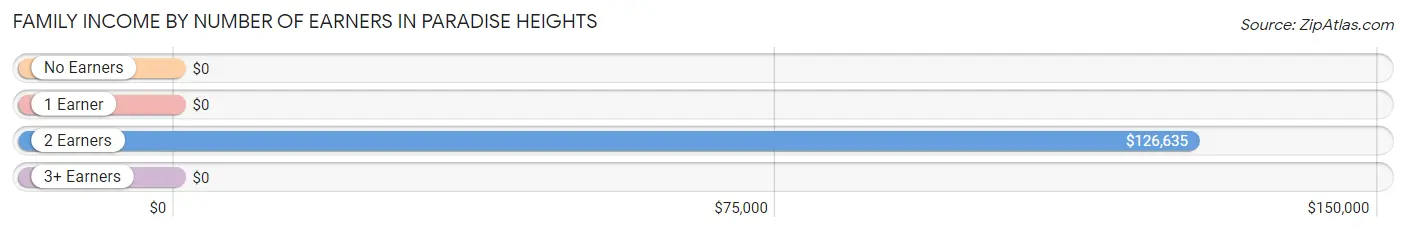
| Number of Earners | # Families | Median Income |
| No Earners | 0 (0.0%) | $0 |
| 1 Earner | 16 (9.1%) | $0 |
| 2 Earners | 160 (90.9%) | $126,635 |
| 3+ Earners | 0 (0.0%) | $0 |
| Total | 176 (100.0%) | $126,250 |
Household Income in Paradise Heights
Household Income Brackets in Paradise Heights
With 173 households falling in the category, the $35,000 to $49,999 income range is the most frequent in Paradise Heights, accounting for 35.2% of all households.
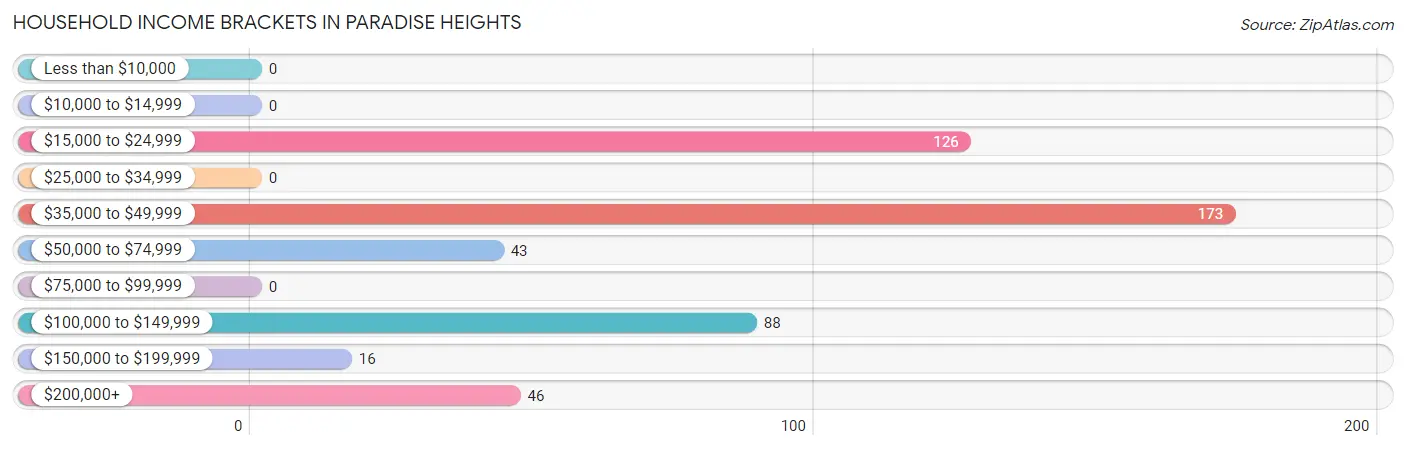
| Income Bracket | # Households | % Households |
| Less than $10,000 | 0 | 0.0% |
| $10,000 to $14,999 | 0 | 0.0% |
| $15,000 to $24,999 | 126 | 25.6% |
| $25,000 to $34,999 | 0 | 0.0% |
| $35,000 to $49,999 | 173 | 35.2% |
| $50,000 to $74,999 | 43 | 8.7% |
| $75,000 to $99,999 | 0 | 0.0% |
| $100,000 to $149,999 | 88 | 17.9% |
| $150,000 to $199,999 | 16 | 3.3% |
| $200,000+ | 46 | 9.3% |
Household Income by Householder Age in Paradise Heights
| Income Bracket | # Households | Median Income |
| 15 to 24 Years | 0 (0.0%) | $0 |
| 25 to 44 Years | 71 (14.4%) | $0 |
| 45 to 64 Years | 273 (55.5%) | $0 |
| 65+ Years | 148 (30.1%) | $0 |
| Total | 492 (100.0%) | $0 |
Poverty in Paradise Heights
Income Below Poverty by Sex and Age in Paradise Heights
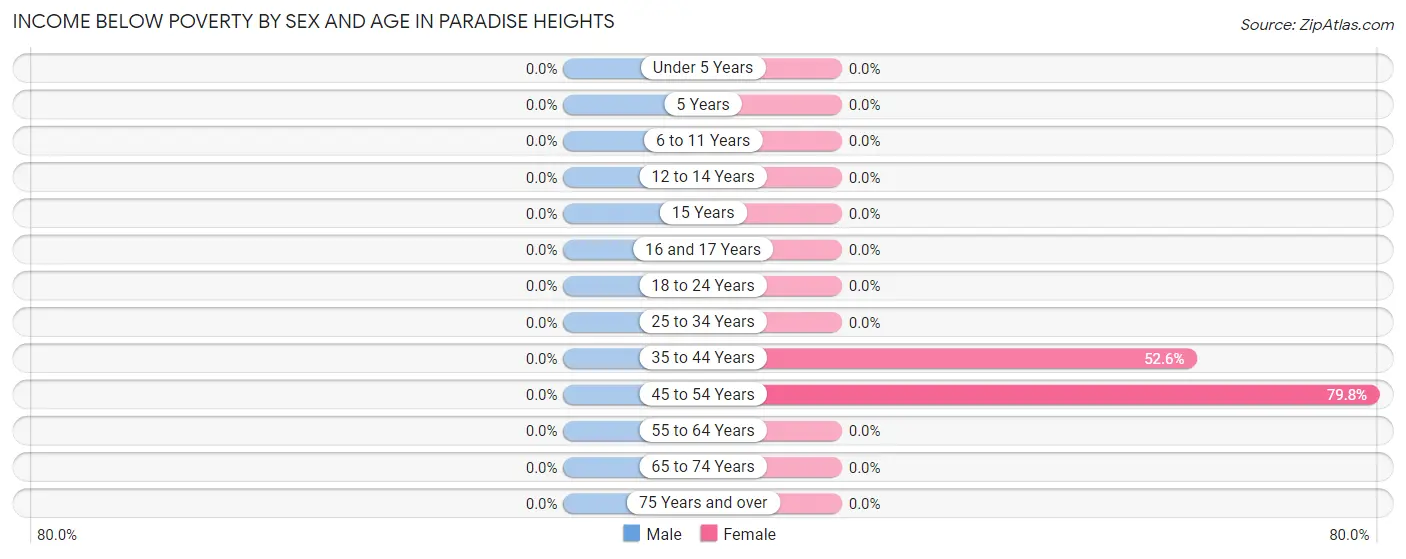
| Age Bracket | Male | Female |
| Under 5 Years | 0 (0.0%) | 0 (0.0%) |
| 5 Years | 0 (0.0%) | 0 (0.0%) |
| 6 to 11 Years | 0 (0.0%) | 0 (0.0%) |
| 12 to 14 Years | 0 (0.0%) | 0 (0.0%) |
| 15 Years | 0 (0.0%) | 0 (0.0%) |
| 16 and 17 Years | 0 (0.0%) | 0 (0.0%) |
| 18 to 24 Years | 0 (0.0%) | 0 (0.0%) |
| 25 to 34 Years | 0 (0.0%) | 0 (0.0%) |
| 35 to 44 Years | 0 (0.0%) | 20 (52.6%) |
| 45 to 54 Years | 0 (0.0%) | 63 (79.7%) |
| 55 to 64 Years | 0 (0.0%) | 0 (0.0%) |
| 65 to 74 Years | 0 (0.0%) | 0 (0.0%) |
| 75 Years and over | 0 (0.0%) | 0 (0.0%) |
| Total | 0 (0.0%) | 83 (24.4%) |
Income Above Poverty by Sex and Age in Paradise Heights
According to the poverty statistics in Paradise Heights, males aged 25 to 34 years and females aged under 5 years are the age groups that are most secure financially, with 100.0% of males and 100.0% of females in these age groups living above the poverty line.
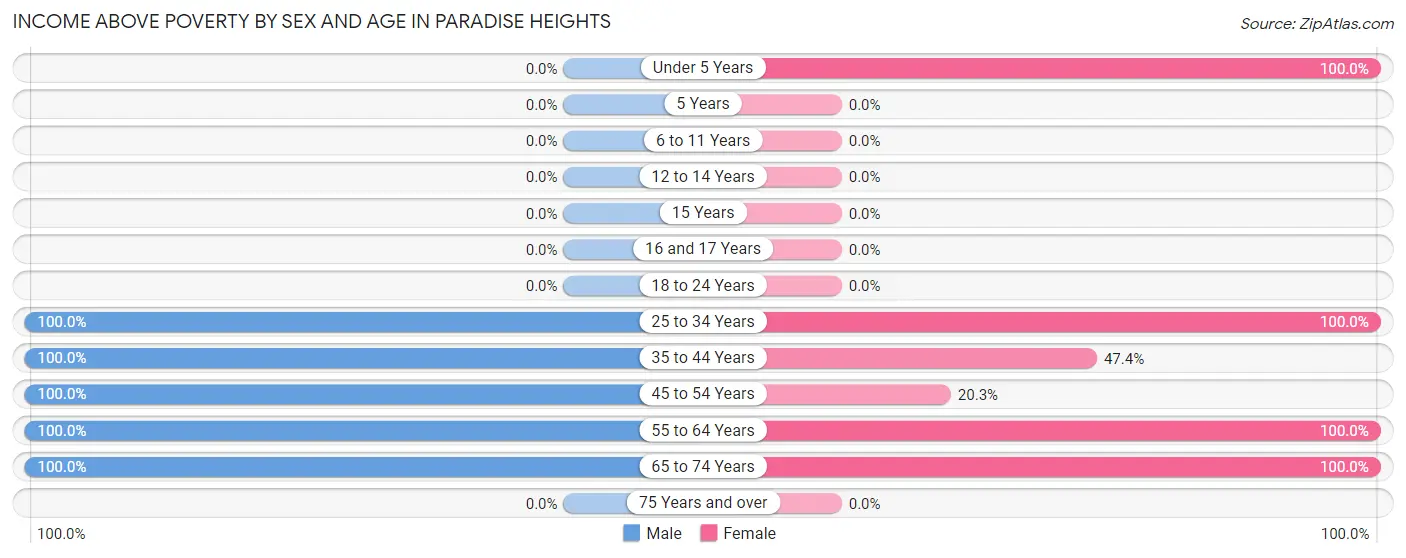
| Age Bracket | Male | Female |
| Under 5 Years | 0 (0.0%) | 63 (100.0%) |
| 5 Years | 0 (0.0%) | 0 (0.0%) |
| 6 to 11 Years | 0 (0.0%) | 0 (0.0%) |
| 12 to 14 Years | 0 (0.0%) | 0 (0.0%) |
| 15 Years | 0 (0.0%) | 0 (0.0%) |
| 16 and 17 Years | 0 (0.0%) | 0 (0.0%) |
| 18 to 24 Years | 0 (0.0%) | 0 (0.0%) |
| 25 to 34 Years | 51 (100.0%) | 52 (100.0%) |
| 35 to 44 Years | 19 (100.0%) | 18 (47.4%) |
| 45 to 54 Years | 78 (100.0%) | 16 (20.3%) |
| 55 to 64 Years | 194 (100.0%) | 86 (100.0%) |
| 65 to 74 Years | 126 (100.0%) | 22 (100.0%) |
| 75 Years and over | 0 (0.0%) | 0 (0.0%) |
| Total | 468 (100.0%) | 257 (75.6%) |
Income Below Poverty Among Married-Couple Families in Paradise Heights
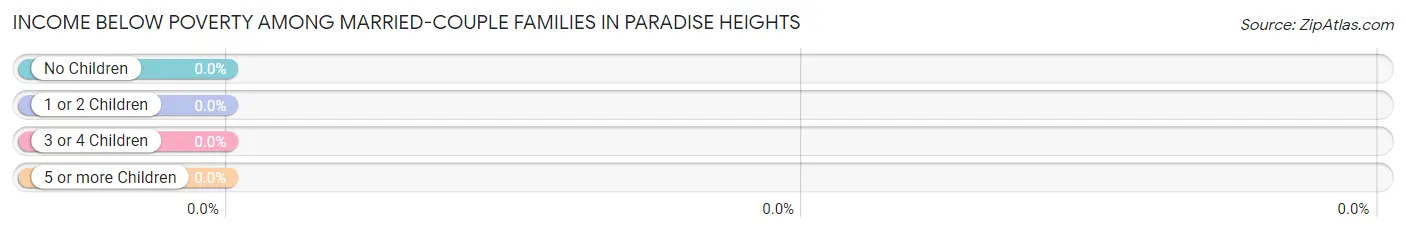
| Children | Above Poverty | Below Poverty |
| No Children | 124 (100.0%) | 0 (0.0%) |
| 1 or 2 Children | 52 (100.0%) | 0 (0.0%) |
| 3 or 4 Children | 0 (0.0%) | 0 (0.0%) |
| 5 or more Children | 0 (0.0%) | 0 (0.0%) |
| Total | 176 (100.0%) | 0 (0.0%) |
Income Below Poverty Among Single-Parent Households in Paradise Heights
| Children | Single Father | Single Mother |
| No Children | 0 (0.0%) | 0 (0.0%) |
| 1 or 2 Children | 0 (0.0%) | 0 (0.0%) |
| 3 or 4 Children | 0 (0.0%) | 0 (0.0%) |
| 5 or more Children | 0 (0.0%) | 0 (0.0%) |
| Total | 0 (0.0%) | 0 (0.0%) |
Income Below Poverty Among Married-Couple vs Single-Parent Households in Paradise Heights
| Children | Married-Couple Families | Single-Parent Households |
| No Children | 0 (0.0%) | 0 (0.0%) |
| 1 or 2 Children | 0 (0.0%) | 0 (0.0%) |
| 3 or 4 Children | 0 (0.0%) | 0 (0.0%) |
| 5 or more Children | 0 (0.0%) | 0 (0.0%) |
| Total | 0 (0.0%) | 0 (0.0%) |
Race in Paradise Heights
The most populous races in Paradise Heights are White / Caucasian (694 | 85.9%), Hispanic or Latino (166 | 20.5%), and Native / Alaskan (63 | 7.8%).
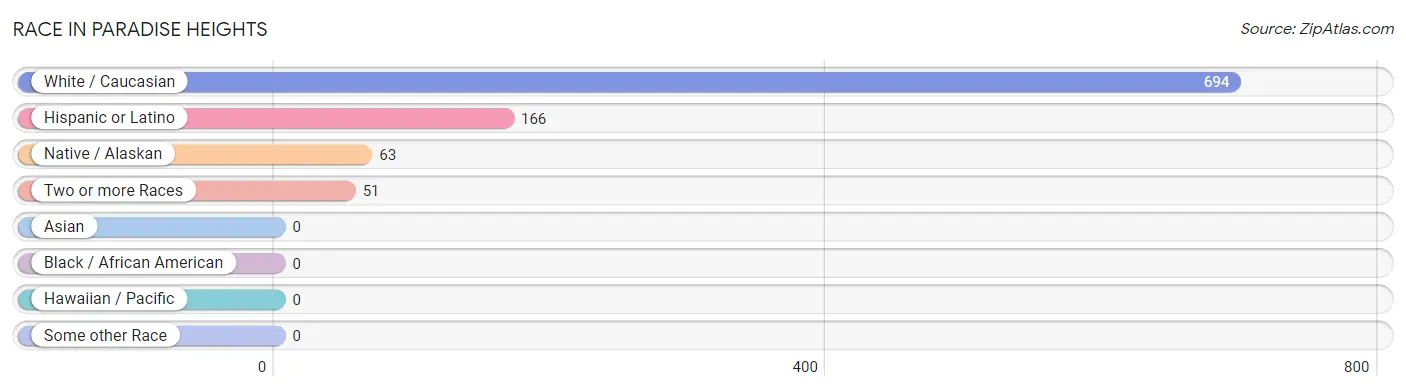
| Race | # Population | % Population |
| Asian | 0 | 0.0% |
| Black / African American | 0 | 0.0% |
| Hawaiian / Pacific | 0 | 0.0% |
| Hispanic or Latino | 166 | 20.5% |
| Native / Alaskan | 63 | 7.8% |
| White / Caucasian | 694 | 85.9% |
| Two or more Races | 51 | 6.3% |
| Some other Race | 0 | 0.0% |
| Total | 808 | 100.0% |
Ancestry in Paradise Heights
The most populous ancestries reported in Paradise Heights are Cuban (166 | 20.5%), Irish (129 | 16.0%), European (128 | 15.8%), American (126 | 15.6%), and Apache (63 | 7.8%), together accounting for 75.7% of all Paradise Heights residents.
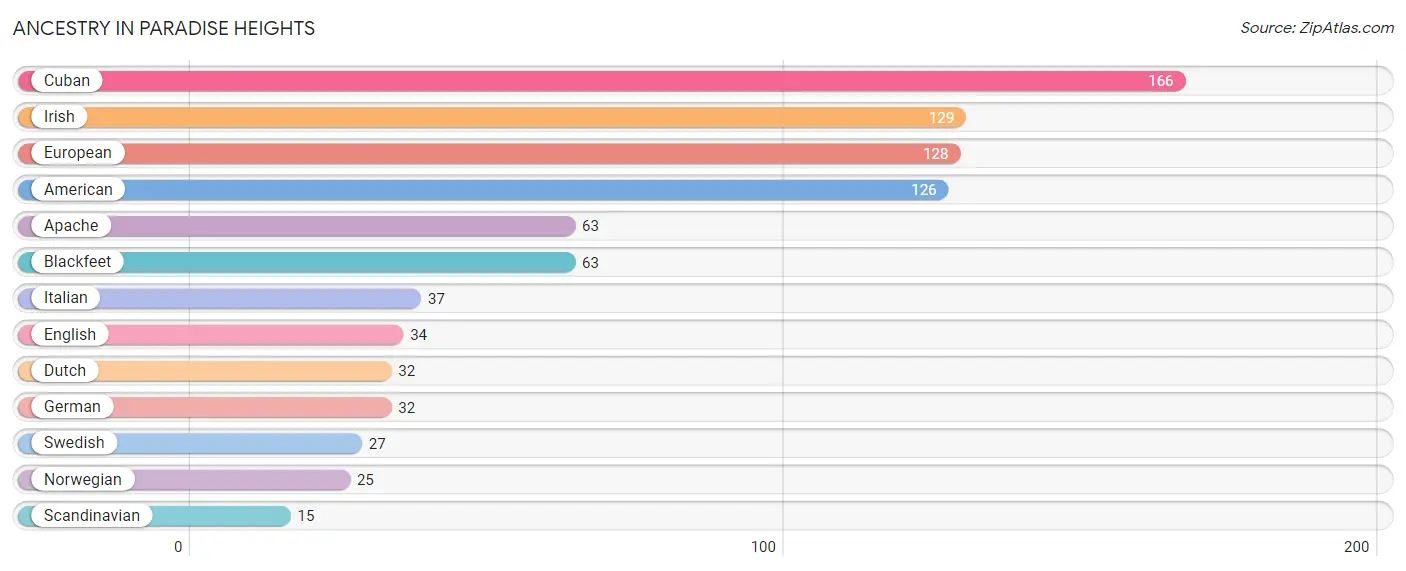
| Ancestry | # Population | % Population |
| American | 126 | 15.6% |
| Apache | 63 | 7.8% |
| Blackfeet | 63 | 7.8% |
| Cuban | 166 | 20.5% |
| Dutch | 32 | 4.0% |
| English | 34 | 4.2% |
| European | 128 | 15.8% |
| German | 32 | 4.0% |
| Irish | 129 | 16.0% |
| Italian | 37 | 4.6% |
| Norwegian | 25 | 3.1% |
| Scandinavian | 15 | 1.9% |
| Swedish | 27 | 3.3% | View All 13 Rows |
Immigrants in Paradise Heights
The most numerous immigrant groups reported in Paradise Heights came from Caribbean (51 | 6.3%), Cuba (51 | 6.3%), and Latin America (51 | 6.3%), together accounting for 18.9% of all Paradise Heights residents.
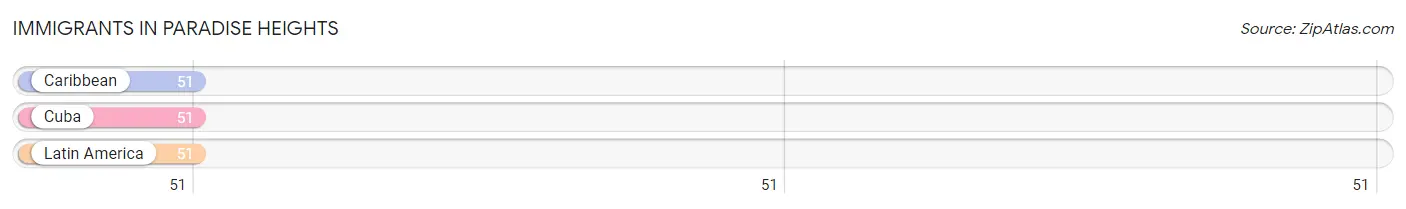
| Immigration Origin | # Population | % Population |
| Caribbean | 51 | 6.3% |
| Cuba | 51 | 6.3% |
| Latin America | 51 | 6.3% | View All 3 Rows |
Sex and Age in Paradise Heights
Sex and Age in Paradise Heights
The most populous age groups in Paradise Heights are 55 to 59 Years (147 | 31.4%) for men and 55 to 59 Years (86 | 25.3%) for women.
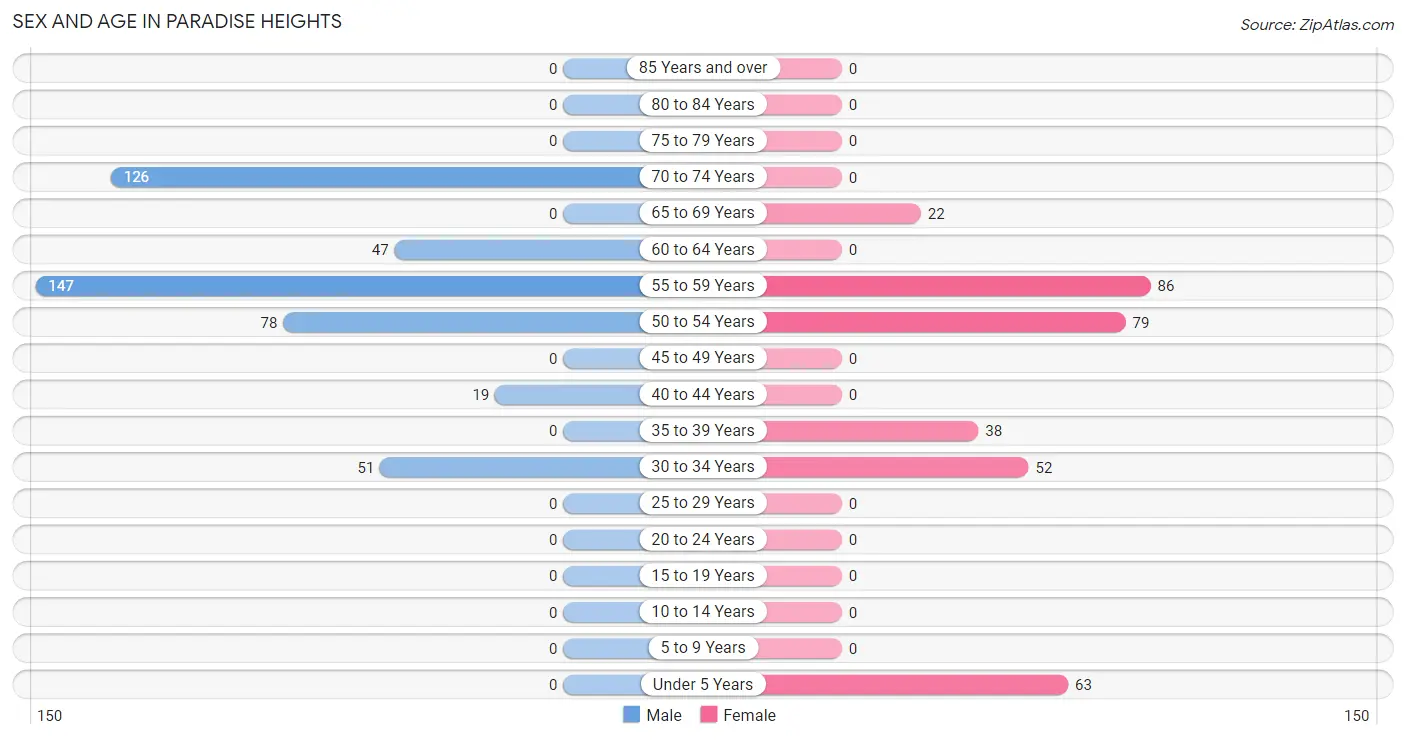
| Age Bracket | Male | Female |
| Under 5 Years | 0 (0.0%) | 63 (18.5%) |
| 5 to 9 Years | 0 (0.0%) | 0 (0.0%) |
| 10 to 14 Years | 0 (0.0%) | 0 (0.0%) |
| 15 to 19 Years | 0 (0.0%) | 0 (0.0%) |
| 20 to 24 Years | 0 (0.0%) | 0 (0.0%) |
| 25 to 29 Years | 0 (0.0%) | 0 (0.0%) |
| 30 to 34 Years | 51 (10.9%) | 52 (15.3%) |
| 35 to 39 Years | 0 (0.0%) | 38 (11.2%) |
| 40 to 44 Years | 19 (4.1%) | 0 (0.0%) |
| 45 to 49 Years | 0 (0.0%) | 0 (0.0%) |
| 50 to 54 Years | 78 (16.7%) | 79 (23.2%) |
| 55 to 59 Years | 147 (31.4%) | 86 (25.3%) |
| 60 to 64 Years | 47 (10.0%) | 0 (0.0%) |
| 65 to 69 Years | 0 (0.0%) | 22 (6.5%) |
| 70 to 74 Years | 126 (26.9%) | 0 (0.0%) |
| 75 to 79 Years | 0 (0.0%) | 0 (0.0%) |
| 80 to 84 Years | 0 (0.0%) | 0 (0.0%) |
| 85 Years and over | 0 (0.0%) | 0 (0.0%) |
| Total | 468 (100.0%) | 340 (100.0%) |
Families and Households in Paradise Heights
Median Family Size in Paradise Heights
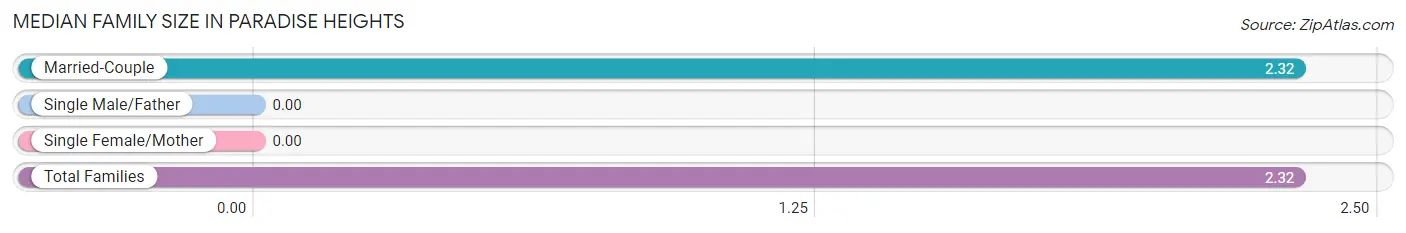
| Family Type | # Families | Family Size |
| Married-Couple | 176 (100.0%) | 2.32 |
| Single Male/Father | 0 (0.0%) | - |
| Single Female/Mother | 0 (0.0%) | - |
| Total Families | 176 (100.0%) | 2.32 |
Median Household Size in Paradise Heights
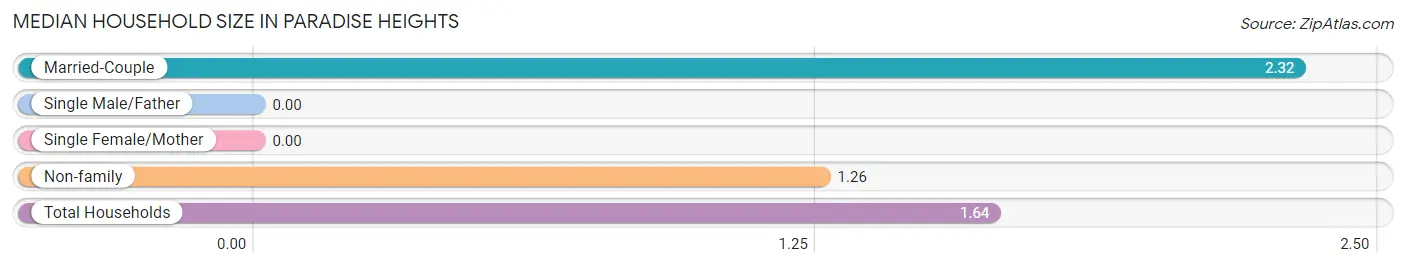
| Household Type | # Households | Household Size |
| Married-Couple | 176 (35.8%) | 2.32 |
| Single Male/Father | 0 (0.0%) | - |
| Single Female/Mother | 0 (0.0%) | - |
| Non-family | 316 (64.2%) | 1.26 |
| Total Households | 492 (100.0%) | 1.64 |
Household Size by Marriage Status in Paradise Heights
Out of a total of 492 households in Paradise Heights, 176 (35.8%) are family households, while 316 (64.2%) are nonfamily households. The most numerous type of family households are 2-person households, comprising 124, and the most common type of nonfamily households are 1-person households, comprising 173.
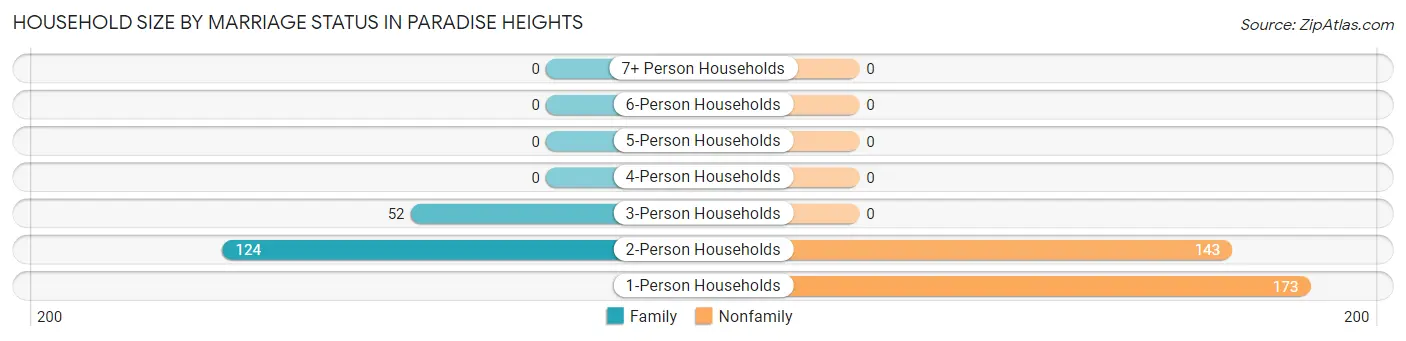
| Household Size | Family Households | Nonfamily Households |
| 1-Person Households | - | 173 (35.2%) |
| 2-Person Households | 124 (25.2%) | 143 (29.1%) |
| 3-Person Households | 52 (10.6%) | 0 (0.0%) |
| 4-Person Households | 0 (0.0%) | 0 (0.0%) |
| 5-Person Households | 0 (0.0%) | 0 (0.0%) |
| 6-Person Households | 0 (0.0%) | 0 (0.0%) |
| 7+ Person Households | 0 (0.0%) | 0 (0.0%) |
| Total | 176 (35.8%) | 316 (64.2%) |
Female Fertility in Paradise Heights
Fertility by Age in Paradise Heights
Average fertility rate in Paradise Heights is 578.0 births per 1,000 women. Women in the age bracket of 20 to 34 years have the highest fertility rate with 1,000.0 births per 1,000 women. Women in the age bracket of 20 to 34 years acount for 100.0% of all women with births.
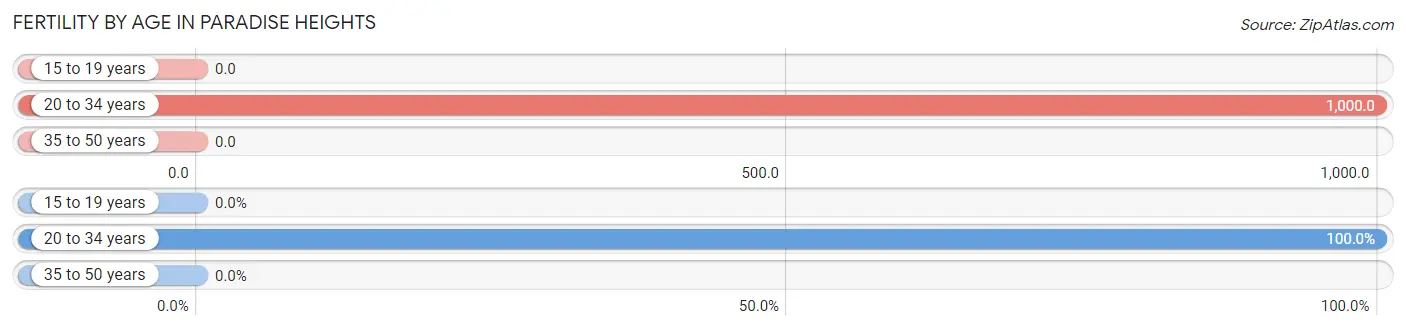
| Age Bracket | Women with Births | Births / 1,000 Women |
| 15 to 19 years | 0 (0.0%) | 0.0 |
| 20 to 34 years | 52 (100.0%) | 1,000.0 |
| 35 to 50 years | 0 (0.0%) | 0.0 |
| Total | 52 (100.0%) | 578.0 |
Fertility by Age by Marriage Status in Paradise Heights
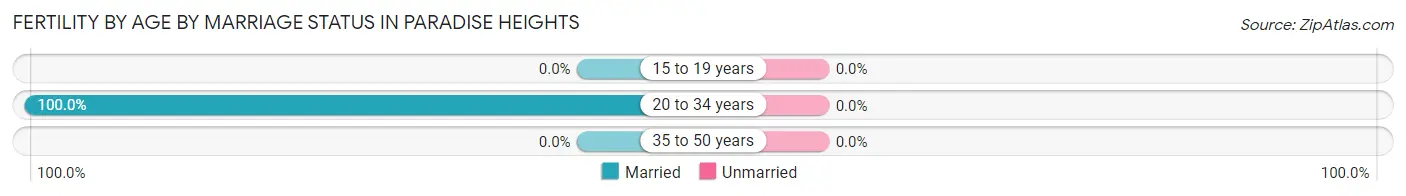
| Age Bracket | Married | Unmarried |
| 15 to 19 years | 0 (0.0%) | 0 (0.0%) |
| 20 to 34 years | 52 (100.0%) | 0 (0.0%) |
| 35 to 50 years | 0 (0.0%) | 0 (0.0%) |
| Total | 52 (100.0%) | 0 (0.0%) |
Fertility by Education in Paradise Heights
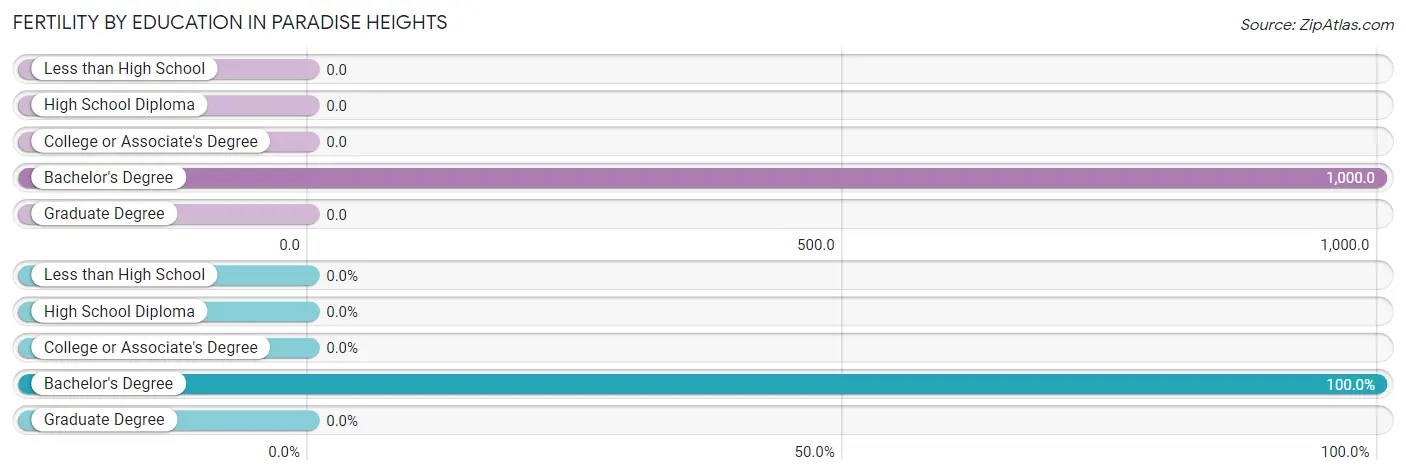
| Educational Attainment | Women with Births | Births / 1,000 Women |
| Less than High School | 0 (0.0%) | 0.0 |
| High School Diploma | 0 (0.0%) | 0.0 |
| College or Associate's Degree | 0 (0.0%) | 0.0 |
| Bachelor's Degree | 52 (100.0%) | 1,000.0 |
| Graduate Degree | 0 (0.0%) | 0.0 |
| Total | 52 (100.0%) | 578.0 |
Fertility by Education by Marriage Status in Paradise Heights
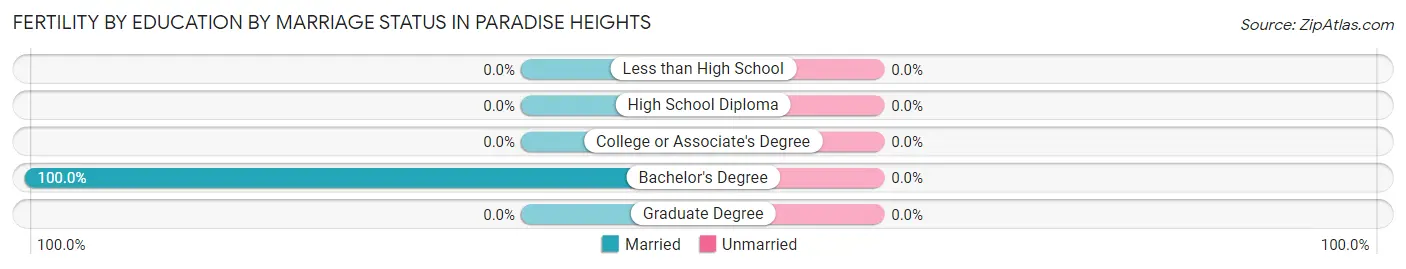
| Educational Attainment | Married | Unmarried |
| Less than High School | 0 (0.0%) | 0 (0.0%) |
| High School Diploma | 0 (0.0%) | 0 (0.0%) |
| College or Associate's Degree | 0 (0.0%) | 0 (0.0%) |
| Bachelor's Degree | 52 (100.0%) | 0 (0.0%) |
| Graduate Degree | 0 (0.0%) | 0 (0.0%) |
| Total | 52 (100.0%) | 0 (0.0%) |
Employment Characteristics in Paradise Heights
Employment by Class of Employer in Paradise Heights
Among the 561 employed individuals in Paradise Heights, private company employees (220 | 39.2%), self-employed (incorporated) (155 | 27.6%), and self-employed (not incorporated) (115 | 20.5%) make up the most common classes of employment.
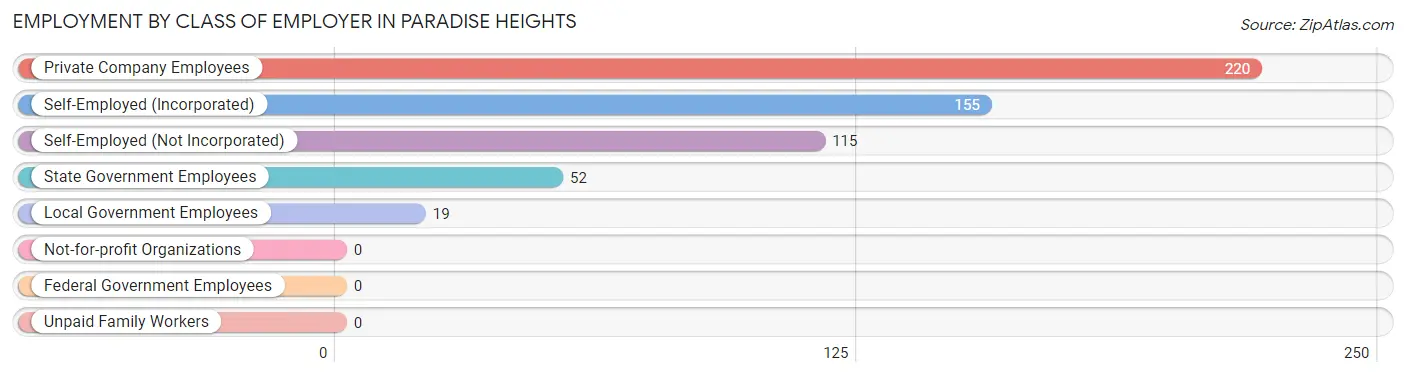
| Employer Class | # Employees | % Employees |
| Private Company Employees | 220 | 39.2% |
| Self-Employed (Incorporated) | 155 | 27.6% |
| Self-Employed (Not Incorporated) | 115 | 20.5% |
| Not-for-profit Organizations | 0 | 0.0% |
| Local Government Employees | 19 | 3.4% |
| State Government Employees | 52 | 9.3% |
| Federal Government Employees | 0 | 0.0% |
| Unpaid Family Workers | 0 | 0.0% |
| Total | 561 | 100.0% |
Employment Status by Age in Paradise Heights
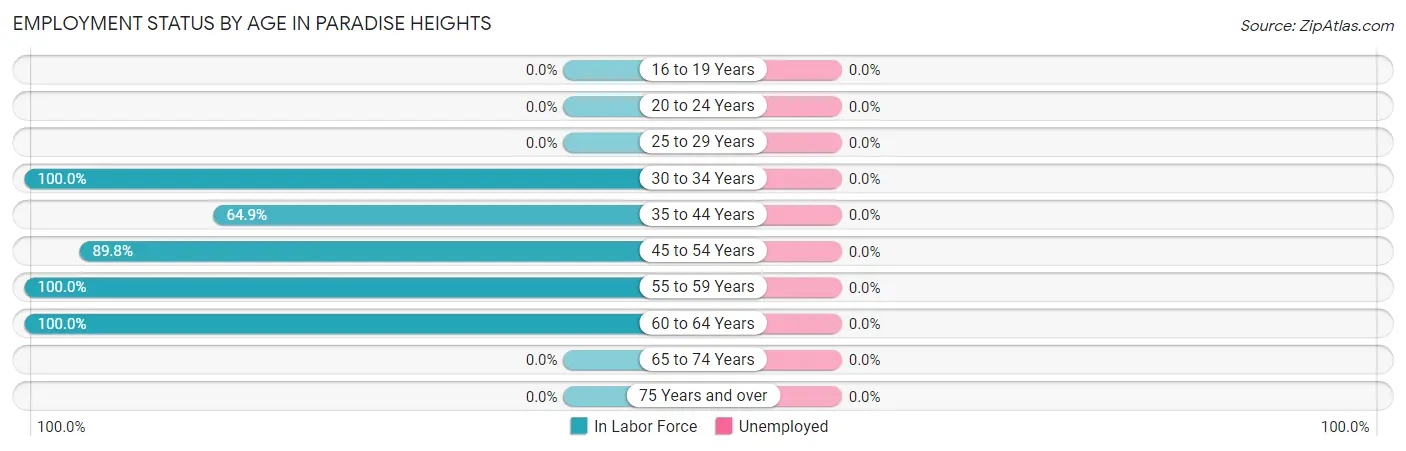
| Age Bracket | In Labor Force | Unemployed |
| 16 to 19 Years | 0 (0.0%) | 0 (0.0%) |
| 20 to 24 Years | 0 (0.0%) | 0 (0.0%) |
| 25 to 29 Years | 0 (0.0%) | 0 (0.0%) |
| 30 to 34 Years | 103 (100.0%) | 0 (0.0%) |
| 35 to 44 Years | 37 (64.9%) | 0 (0.0%) |
| 45 to 54 Years | 141 (89.8%) | 0 (0.0%) |
| 55 to 59 Years | 233 (100.0%) | 0 (0.0%) |
| 60 to 64 Years | 47 (100.0%) | 0 (0.0%) |
| 65 to 74 Years | 0 (0.0%) | 0 (0.0%) |
| 75 Years and over | 0 (0.0%) | 0 (0.0%) |
| Total | 561 (75.3%) | 0 (0.0%) |
Employment Status by Educational Attainment in Paradise Heights
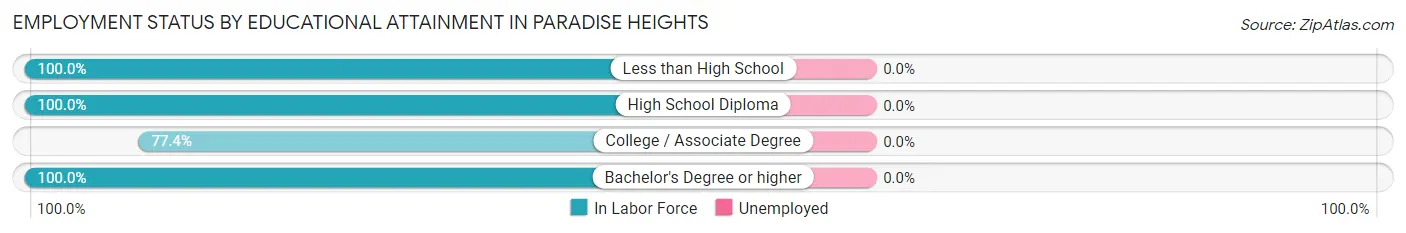
| Educational Attainment | In Labor Force | Unemployed |
| Less than High School | 104 (100.0%) | 0 (0.0%) |
| High School Diploma | 151 (100.0%) | 0 (0.0%) |
| College / Associate Degree | 123 (77.4%) | 0 (0.0%) |
| Bachelor's Degree or higher | 183 (100.0%) | 0 (0.0%) |
| Total | 561 (94.0%) | 0 (0.0%) |
Employment Occupations by Sex in Paradise Heights
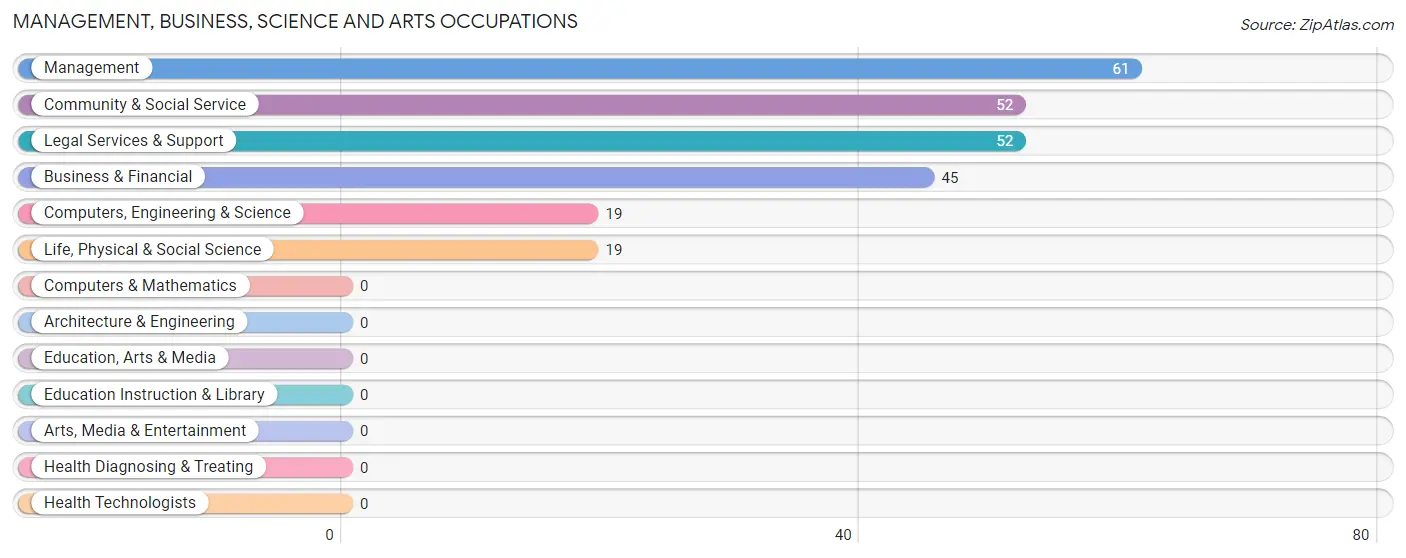
Management, Business, Science and Arts Occupations
The most common Management, Business, Science and Arts occupations in Paradise Heights are Management (61 | 10.9%), Community & Social Service (52 | 9.3%), Legal Services & Support (52 | 9.3%), Business & Financial (45 | 8.0%), and Computers, Engineering & Science (19 | 3.4%).
Management, Business, Science and Arts Occupations by Sex
Within the Management, Business, Science and Arts occupations in Paradise Heights, the most male-oriented occupations are Computers, Engineering & Science (100.0%), Life, Physical & Social Science (100.0%), and Business & Financial (60.0%), while the most female-oriented occupations are Management (100.0%), Community & Social Service (100.0%), and Legal Services & Support (100.0%).
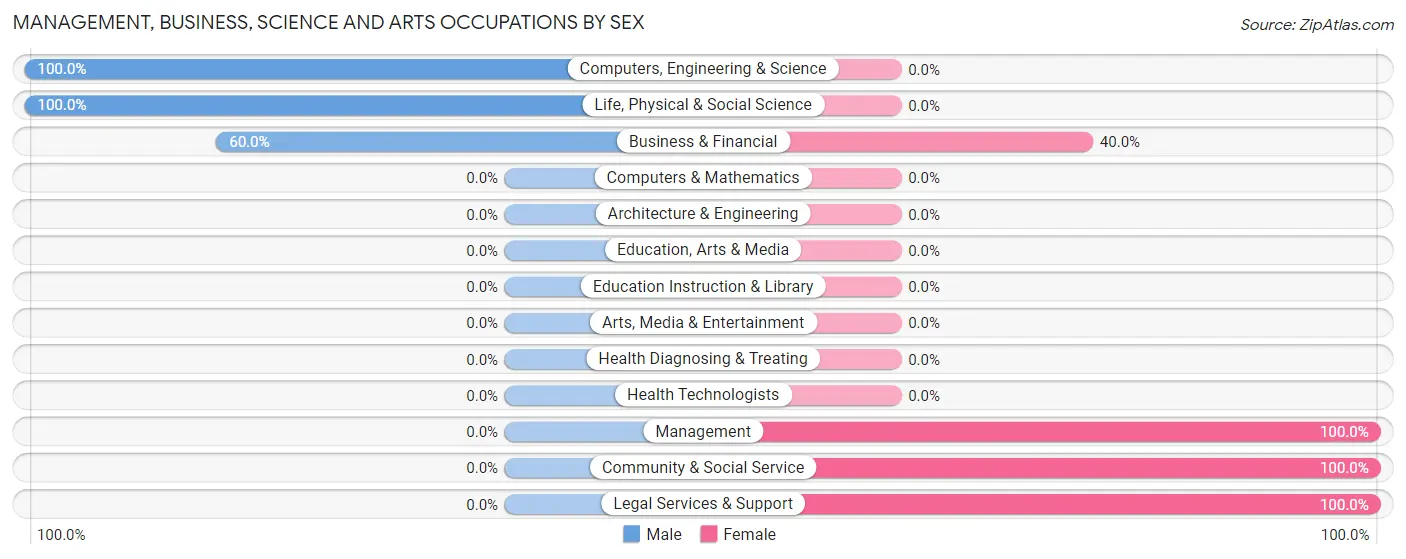
| Occupation | Male | Female |
| Management | 0 (0.0%) | 61 (100.0%) |
| Business & Financial | 27 (60.0%) | 18 (40.0%) |
| Computers, Engineering & Science | 19 (100.0%) | 0 (0.0%) |
| Computers & Mathematics | 0 (0.0%) | 0 (0.0%) |
| Architecture & Engineering | 0 (0.0%) | 0 (0.0%) |
| Life, Physical & Social Science | 19 (100.0%) | 0 (0.0%) |
| Community & Social Service | 0 (0.0%) | 52 (100.0%) |
| Education, Arts & Media | 0 (0.0%) | 0 (0.0%) |
| Legal Services & Support | 0 (0.0%) | 52 (100.0%) |
| Education Instruction & Library | 0 (0.0%) | 0 (0.0%) |
| Arts, Media & Entertainment | 0 (0.0%) | 0 (0.0%) |
| Health Diagnosing & Treating | 0 (0.0%) | 0 (0.0%) |
| Health Technologists | 0 (0.0%) | 0 (0.0%) |
| Total (Category) | 46 (26.0%) | 131 (74.0%) |
| Total (Overall) | 342 (61.0%) | 219 (39.0%) |
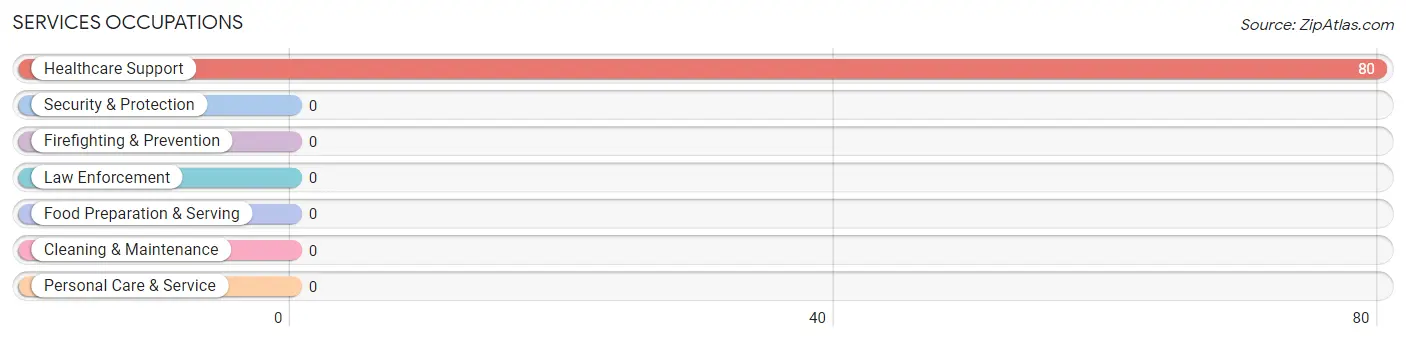
Services Occupations
The most common Services occupations in Paradise Heights are , and Healthcare Support (80 | 14.3%).
Services Occupations by Sex
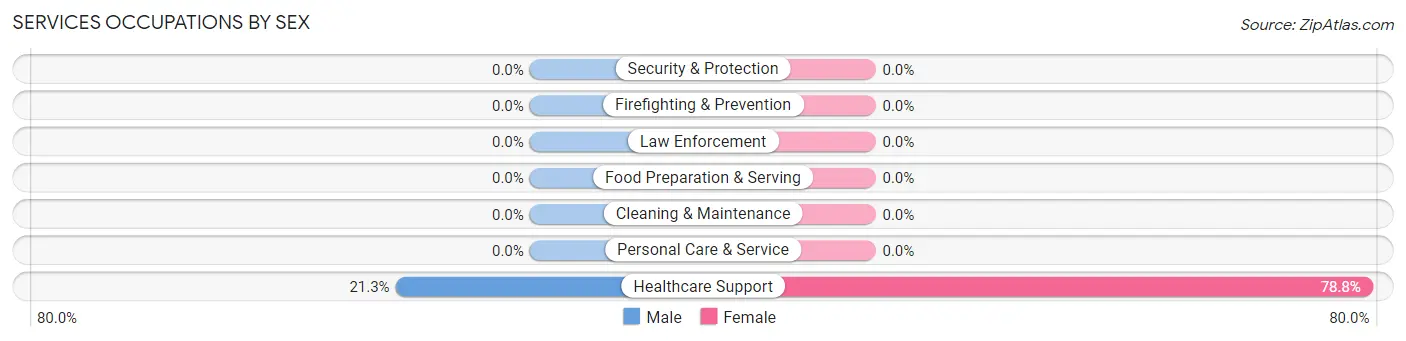
| Occupation | Male | Female |
| Healthcare Support | 17 (21.2%) | 63 (78.7%) |
| Security & Protection | 0 (0.0%) | 0 (0.0%) |
| Firefighting & Prevention | 0 (0.0%) | 0 (0.0%) |
| Law Enforcement | 0 (0.0%) | 0 (0.0%) |
| Food Preparation & Serving | 0 (0.0%) | 0 (0.0%) |
| Cleaning & Maintenance | 0 (0.0%) | 0 (0.0%) |
| Personal Care & Service | 0 (0.0%) | 0 (0.0%) |
| Total (Category) | 17 (21.2%) | 63 (78.7%) |
| Total (Overall) | 342 (61.0%) | 219 (39.0%) |
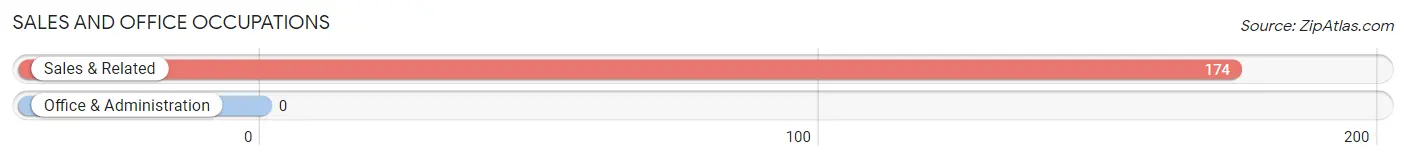
Sales and Office Occupations
The most common Sales and Office occupations in Paradise Heights are , and Sales & Related (174 | 31.0%).
Sales and Office Occupations by Sex
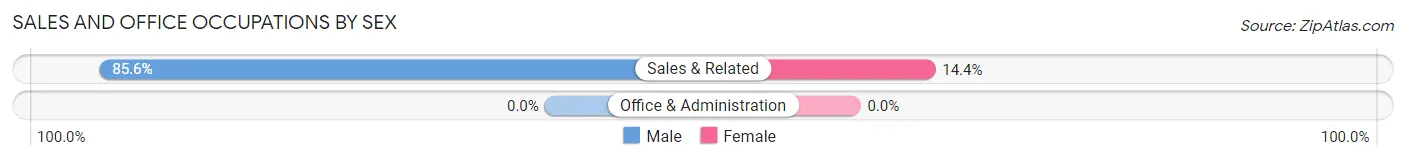
| Occupation | Male | Female |
| Sales & Related | 149 (85.6%) | 25 (14.4%) |
| Office & Administration | 0 (0.0%) | 0 (0.0%) |
| Total (Category) | 149 (85.6%) | 25 (14.4%) |
| Total (Overall) | 342 (61.0%) | 219 (39.0%) |
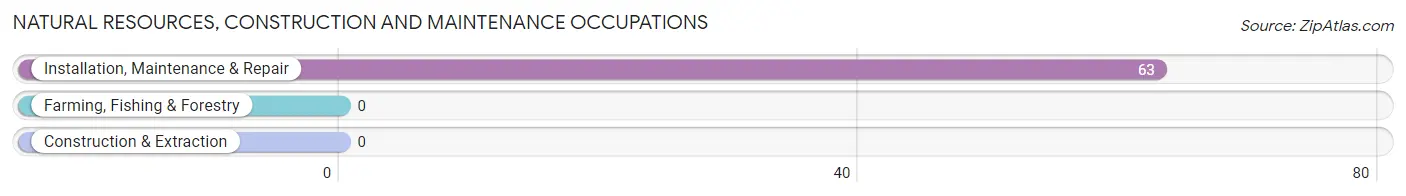
Natural Resources, Construction and Maintenance Occupations
The most common Natural Resources, Construction and Maintenance occupations in Paradise Heights are , and Installation, Maintenance & Repair (63 | 11.2%).
Natural Resources, Construction and Maintenance Occupations by Sex
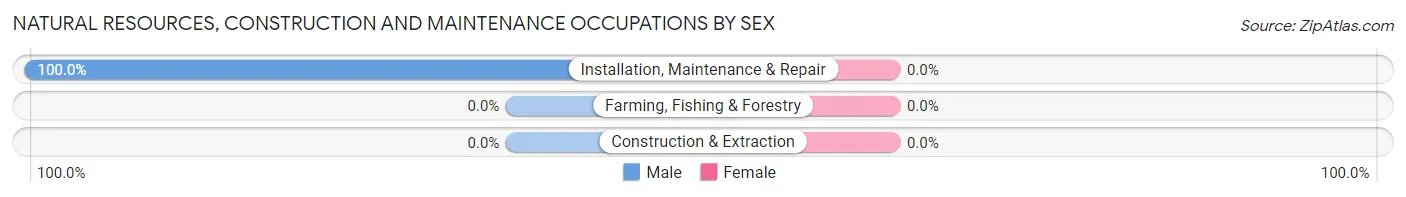
| Occupation | Male | Female |
| Farming, Fishing & Forestry | 0 (0.0%) | 0 (0.0%) |
| Construction & Extraction | 0 (0.0%) | 0 (0.0%) |
| Installation, Maintenance & Repair | 63 (100.0%) | 0 (0.0%) |
| Total (Category) | 63 (100.0%) | 0 (0.0%) |
| Total (Overall) | 342 (61.0%) | 219 (39.0%) |
Production, Transportation and Moving Occupations
The most common Production, Transportation and Moving occupations in Paradise Heights are , and Production (67 | 11.9%).
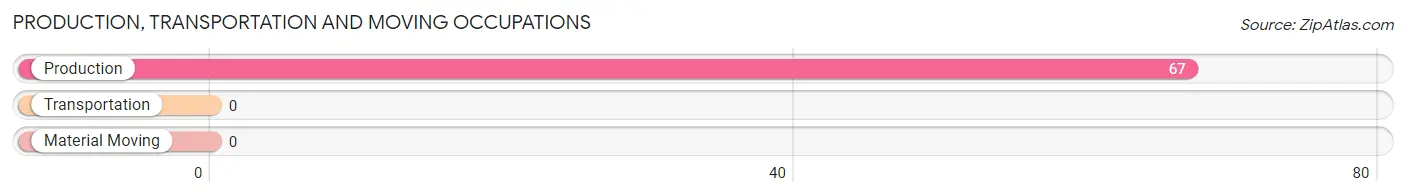
Production, Transportation and Moving Occupations by Sex
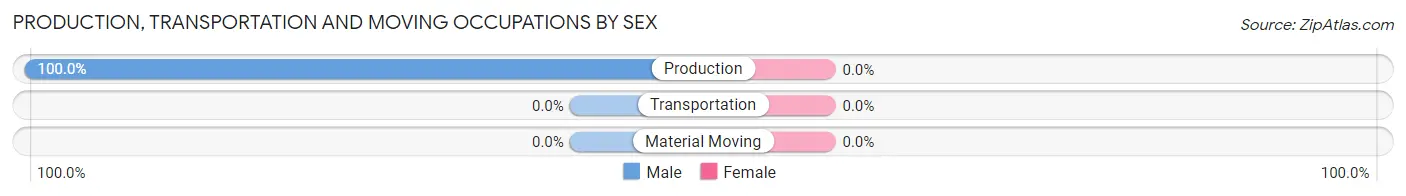
| Occupation | Male | Female |
| Production | 67 (100.0%) | 0 (0.0%) |
| Transportation | 0 (0.0%) | 0 (0.0%) |
| Material Moving | 0 (0.0%) | 0 (0.0%) |
| Total (Category) | 67 (100.0%) | 0 (0.0%) |
| Total (Overall) | 342 (61.0%) | 219 (39.0%) |
Employment Industries by Sex in Paradise Heights
Employment Industries in Paradise Heights
The major employment industries in Paradise Heights include Retail Trade (104 | 18.5%), Health Care & Social Assistance (80 | 14.3%), Public Administration (71 | 12.7%), Manufacturing (67 | 11.9%), and Accommodation & Food Services (64 | 11.4%).
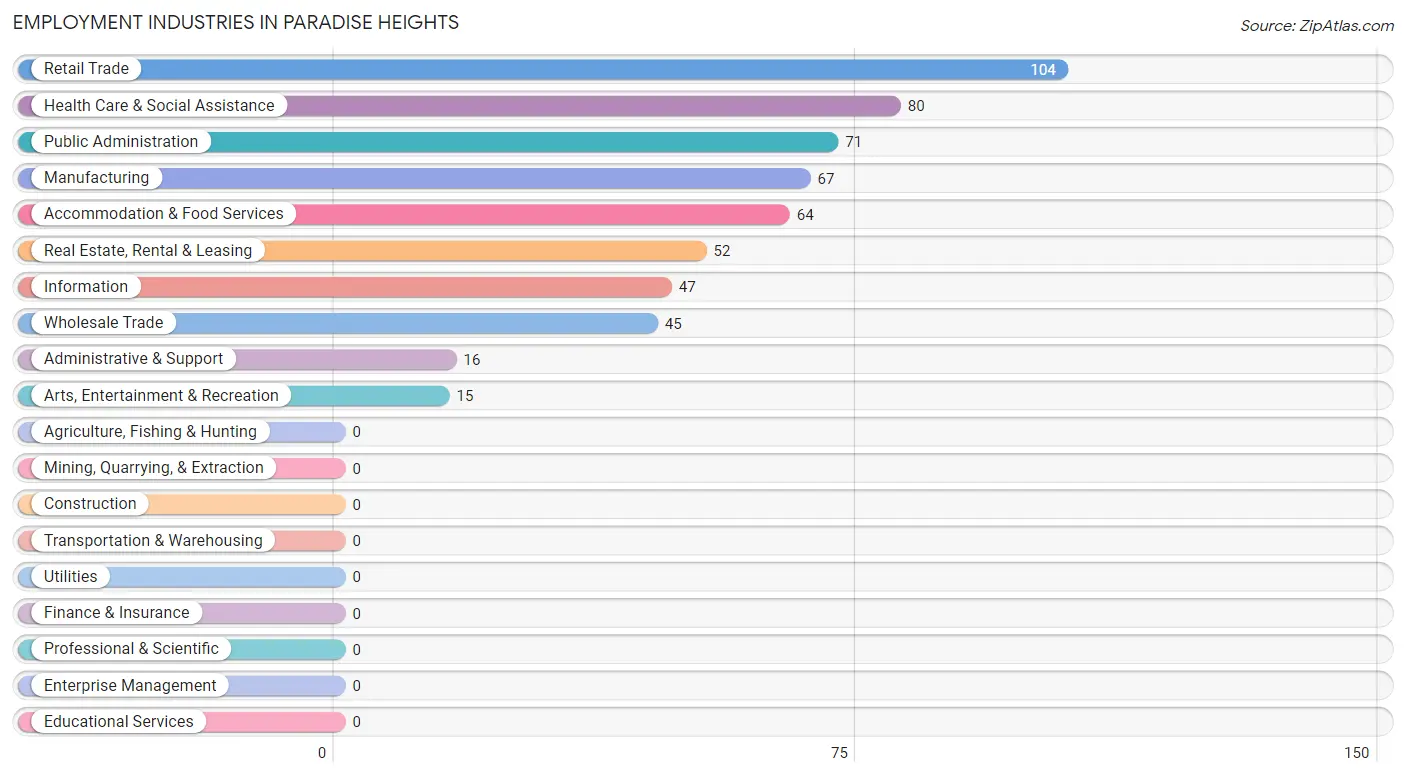
Employment Industries by Sex in Paradise Heights
The Paradise Heights industries that see more men than women are Manufacturing (100.0%), Wholesale Trade (100.0%), and Retail Trade (100.0%), whereas the industries that tend to have a higher number of women are Arts, Entertainment & Recreation (100.0%), Accommodation & Food Services (100.0%), and Health Care & Social Assistance (78.7%).
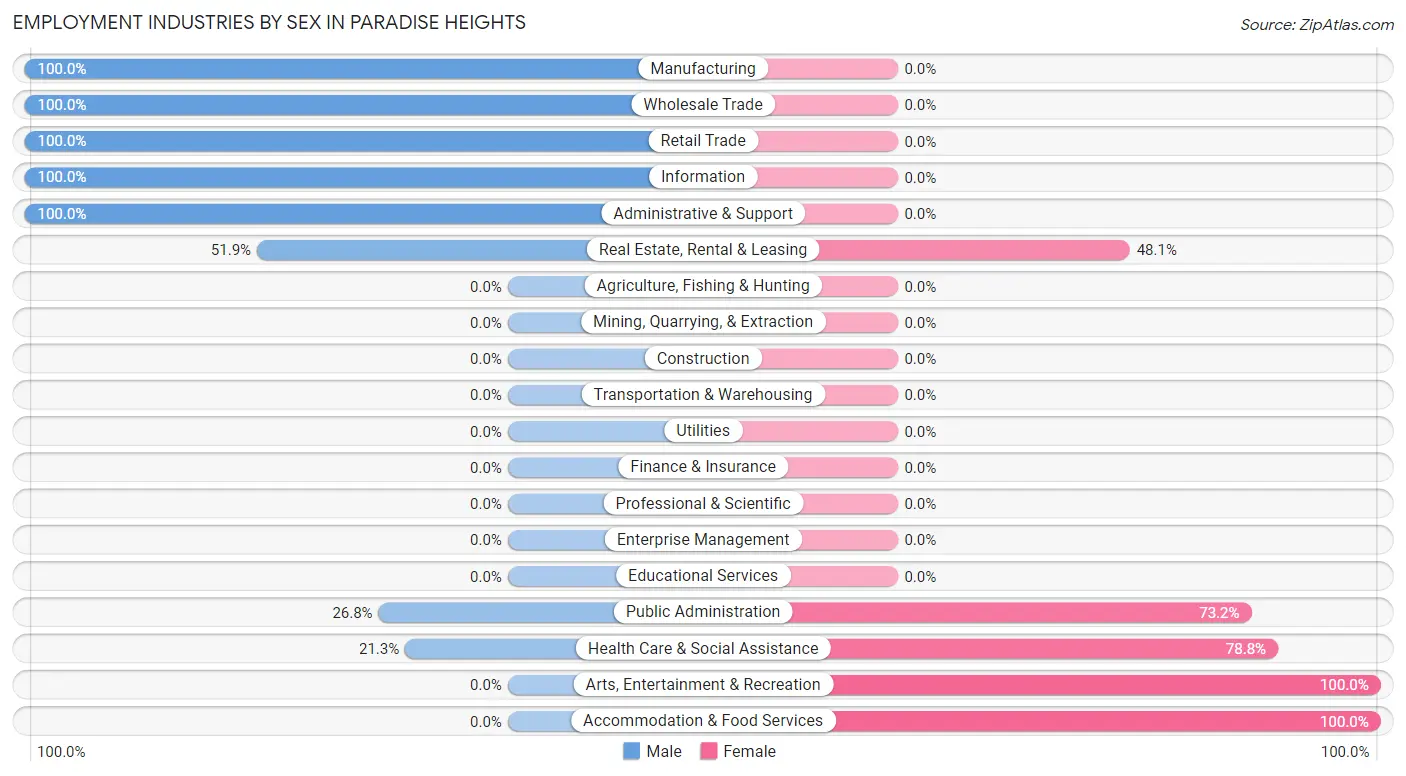
| Industry | Male | Female |
| Agriculture, Fishing & Hunting | 0 (0.0%) | 0 (0.0%) |
| Mining, Quarrying, & Extraction | 0 (0.0%) | 0 (0.0%) |
| Construction | 0 (0.0%) | 0 (0.0%) |
| Manufacturing | 67 (100.0%) | 0 (0.0%) |
| Wholesale Trade | 45 (100.0%) | 0 (0.0%) |
| Retail Trade | 104 (100.0%) | 0 (0.0%) |
| Transportation & Warehousing | 0 (0.0%) | 0 (0.0%) |
| Utilities | 0 (0.0%) | 0 (0.0%) |
| Information | 47 (100.0%) | 0 (0.0%) |
| Finance & Insurance | 0 (0.0%) | 0 (0.0%) |
| Real Estate, Rental & Leasing | 27 (51.9%) | 25 (48.1%) |
| Professional & Scientific | 0 (0.0%) | 0 (0.0%) |
| Enterprise Management | 0 (0.0%) | 0 (0.0%) |
| Administrative & Support | 16 (100.0%) | 0 (0.0%) |
| Educational Services | 0 (0.0%) | 0 (0.0%) |
| Health Care & Social Assistance | 17 (21.2%) | 63 (78.7%) |
| Arts, Entertainment & Recreation | 0 (0.0%) | 15 (100.0%) |
| Accommodation & Food Services | 0 (0.0%) | 64 (100.0%) |
| Public Administration | 19 (26.8%) | 52 (73.2%) |
| Total | 342 (61.0%) | 219 (39.0%) |
Education in Paradise Heights
School Enrollment in Paradise Heights
| School Level | # Students | % Students |
| Nursery / Preschool | 0 | 0.0% |
| Kindergarten | 0 | 0.0% |
| Elementary School | 0 | 0.0% |
| Middle School | 0 | 0.0% |
| High School | 0 | 0.0% |
| College / Undergraduate | 0 | 0.0% |
| Graduate / Professional | 0 | 0.0% |
| Total | 0 | 0.0% |
School Enrollment by Age by Funding Source in Paradise Heights
| Age Bracket | Public School | Private School |
| 3 to 4 Year Olds | 0 (0.0%) | 0 (0.0%) |
| 5 to 9 Year Old | 0 (0.0%) | 0 (0.0%) |
| 10 to 14 Year Olds | 0 (0.0%) | 0 (0.0%) |
| 15 to 17 Year Olds | 0 (0.0%) | 0 (0.0%) |
| 18 to 19 Year Olds | 0 (0.0%) | 0 (0.0%) |
| 20 to 24 Year Olds | 0 (0.0%) | 0 (0.0%) |
| 25 to 34 Year Olds | 0 (0.0%) | 0 (0.0%) |
| 35 Years and over | 0 (0.0%) | 0 (0.0%) |
| Total | 0 (0.0%) | 0 (0.0%) |
Educational Attainment by Field of Study in Paradise Heights
Arts & humanities (71 | 38.8%), psychology (51 | 27.9%), business (46 | 25.1%), and bio, nature & agricultural (15 | 8.2%) are the most common fields of study among 183 individuals in Paradise Heights who have obtained a bachelor's degree or higher.
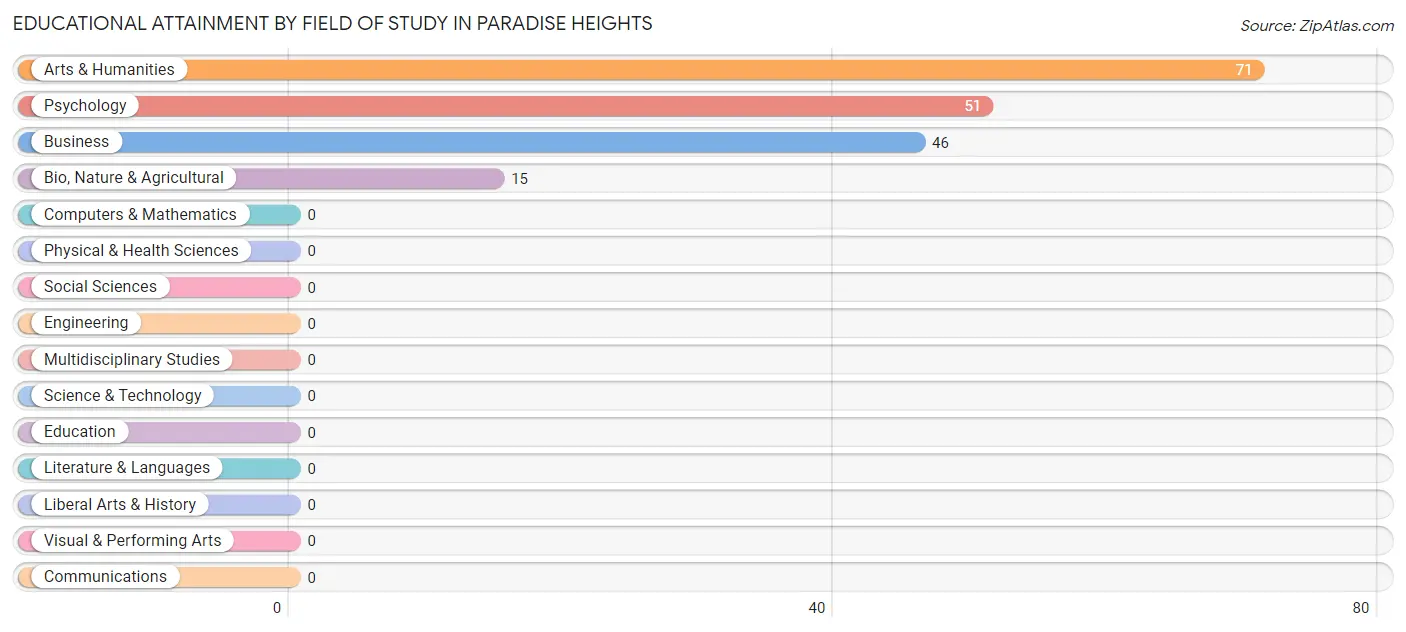
| Field of Study | # Graduates | % Graduates |
| Computers & Mathematics | 0 | 0.0% |
| Bio, Nature & Agricultural | 15 | 8.2% |
| Physical & Health Sciences | 0 | 0.0% |
| Psychology | 51 | 27.9% |
| Social Sciences | 0 | 0.0% |
| Engineering | 0 | 0.0% |
| Multidisciplinary Studies | 0 | 0.0% |
| Science & Technology | 0 | 0.0% |
| Business | 46 | 25.1% |
| Education | 0 | 0.0% |
| Literature & Languages | 0 | 0.0% |
| Liberal Arts & History | 0 | 0.0% |
| Visual & Performing Arts | 0 | 0.0% |
| Communications | 0 | 0.0% |
| Arts & Humanities | 71 | 38.8% |
| Total | 183 | 100.0% |
Transportation & Commute in Paradise Heights
Vehicle Availability by Sex in Paradise Heights
The most prevalent vehicle ownership categories in Paradise Heights are males with 1 vehicle (167, accounting for 48.8%) and females with 1 vehicle (0, making up 76.3%).
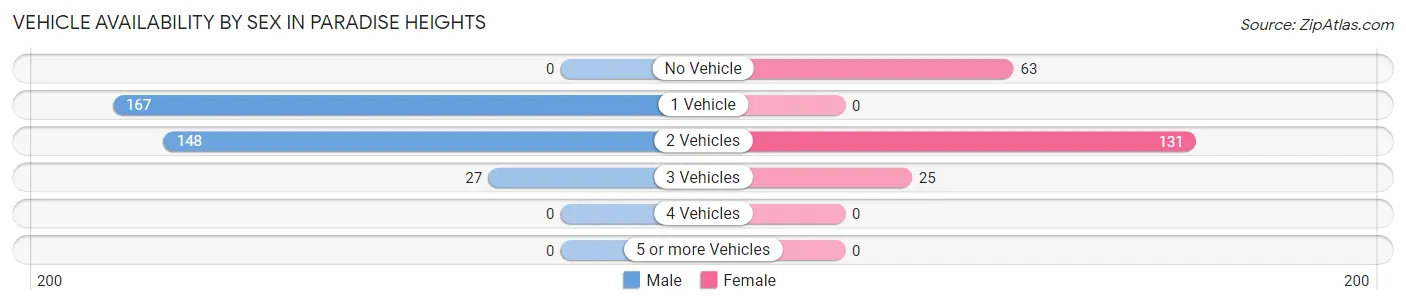
| Vehicles Available | Male | Female |
| No Vehicle | 0 (0.0%) | 63 (28.8%) |
| 1 Vehicle | 167 (48.8%) | 0 (0.0%) |
| 2 Vehicles | 148 (43.3%) | 131 (59.8%) |
| 3 Vehicles | 27 (7.9%) | 25 (11.4%) |
| 4 Vehicles | 0 (0.0%) | 0 (0.0%) |
| 5 or more Vehicles | 0 (0.0%) | 0 (0.0%) |
| Total | 342 (100.0%) | 219 (100.0%) |
Commute Time in Paradise Heights
The most frequently occuring commute durations in Paradise Heights are 30 to 34 minutes (137 commuters, 37.2%), 45 to 59 minutes (70 commuters, 19.0%), and 40 to 44 minutes (62 commuters, 16.9%).
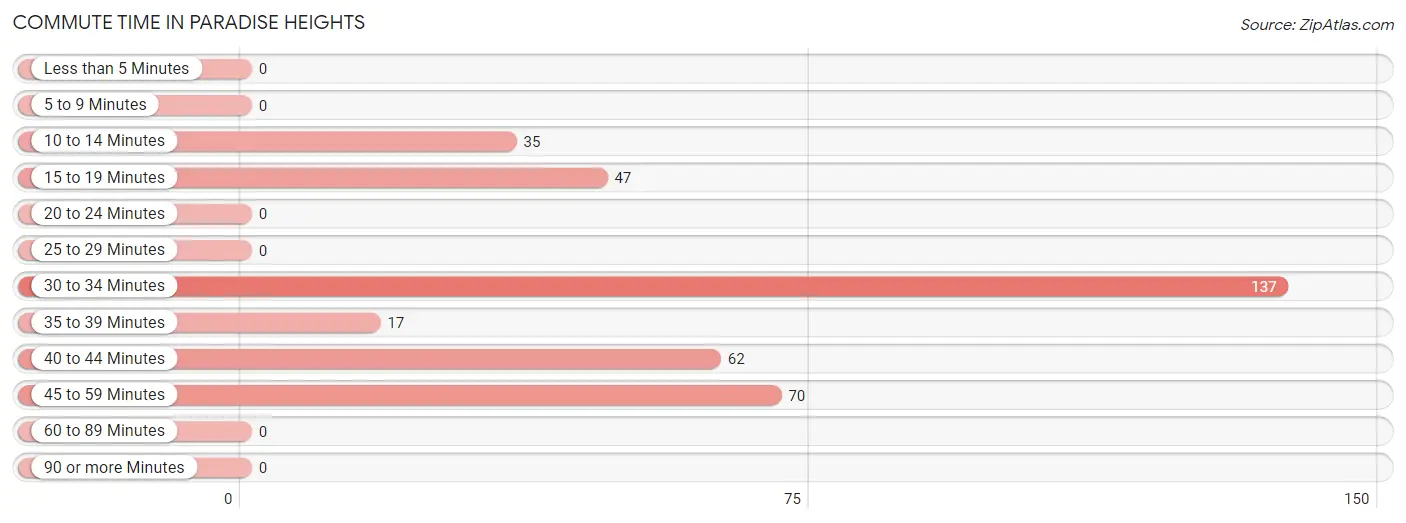
| Commute Time | # Commuters | % Commuters |
| Less than 5 Minutes | 0 | 0.0% |
| 5 to 9 Minutes | 0 | 0.0% |
| 10 to 14 Minutes | 35 | 9.5% |
| 15 to 19 Minutes | 47 | 12.8% |
| 20 to 24 Minutes | 0 | 0.0% |
| 25 to 29 Minutes | 0 | 0.0% |
| 30 to 34 Minutes | 137 | 37.2% |
| 35 to 39 Minutes | 17 | 4.6% |
| 40 to 44 Minutes | 62 | 16.9% |
| 45 to 59 Minutes | 70 | 19.0% |
| 60 to 89 Minutes | 0 | 0.0% |
| 90 or more Minutes | 0 | 0.0% |
Commute Time by Sex in Paradise Heights
The most common commute times in Paradise Heights are 30 to 34 minutes (104 commuters, 39.4%) for males and 40 to 44 minutes (46 commuters, 44.2%) for females.
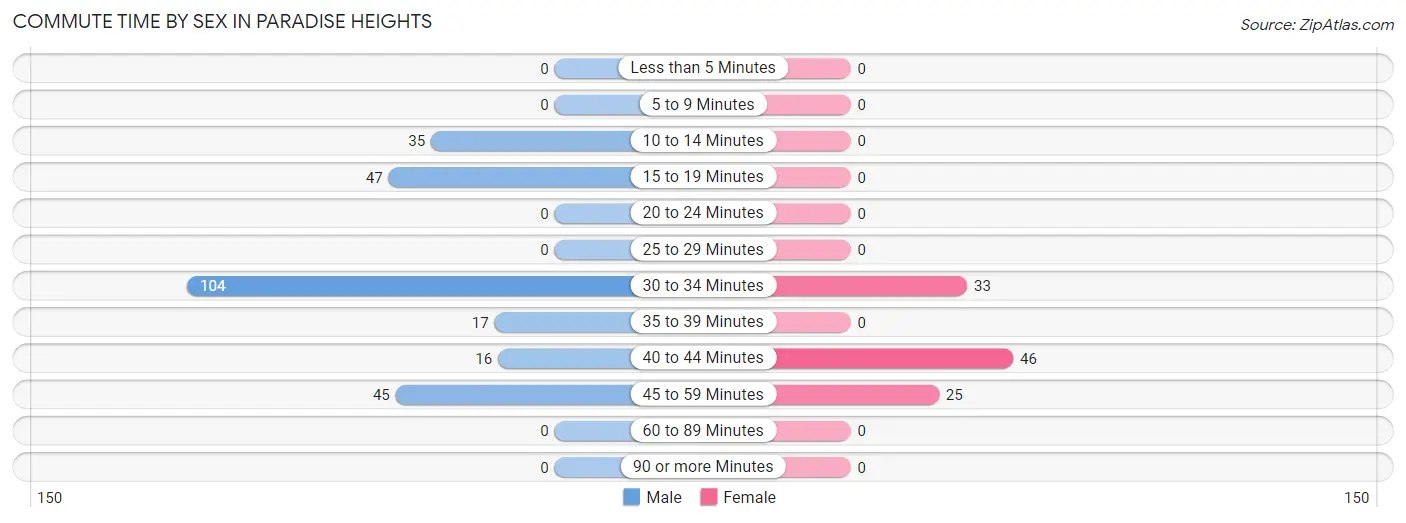
| Commute Time | Male | Female |
| Less than 5 Minutes | 0 (0.0%) | 0 (0.0%) |
| 5 to 9 Minutes | 0 (0.0%) | 0 (0.0%) |
| 10 to 14 Minutes | 35 (13.3%) | 0 (0.0%) |
| 15 to 19 Minutes | 47 (17.8%) | 0 (0.0%) |
| 20 to 24 Minutes | 0 (0.0%) | 0 (0.0%) |
| 25 to 29 Minutes | 0 (0.0%) | 0 (0.0%) |
| 30 to 34 Minutes | 104 (39.4%) | 33 (31.7%) |
| 35 to 39 Minutes | 17 (6.4%) | 0 (0.0%) |
| 40 to 44 Minutes | 16 (6.1%) | 46 (44.2%) |
| 45 to 59 Minutes | 45 (17.1%) | 25 (24.0%) |
| 60 to 89 Minutes | 0 (0.0%) | 0 (0.0%) |
| 90 or more Minutes | 0 (0.0%) | 0 (0.0%) |
Time of Departure to Work by Sex in Paradise Heights
The most frequent times of departure to work in Paradise Heights are 4:00 PM to 11:59 PM (120, 45.5%) for males and 6:30 AM to 6:59 AM (46, 44.2%) for females.
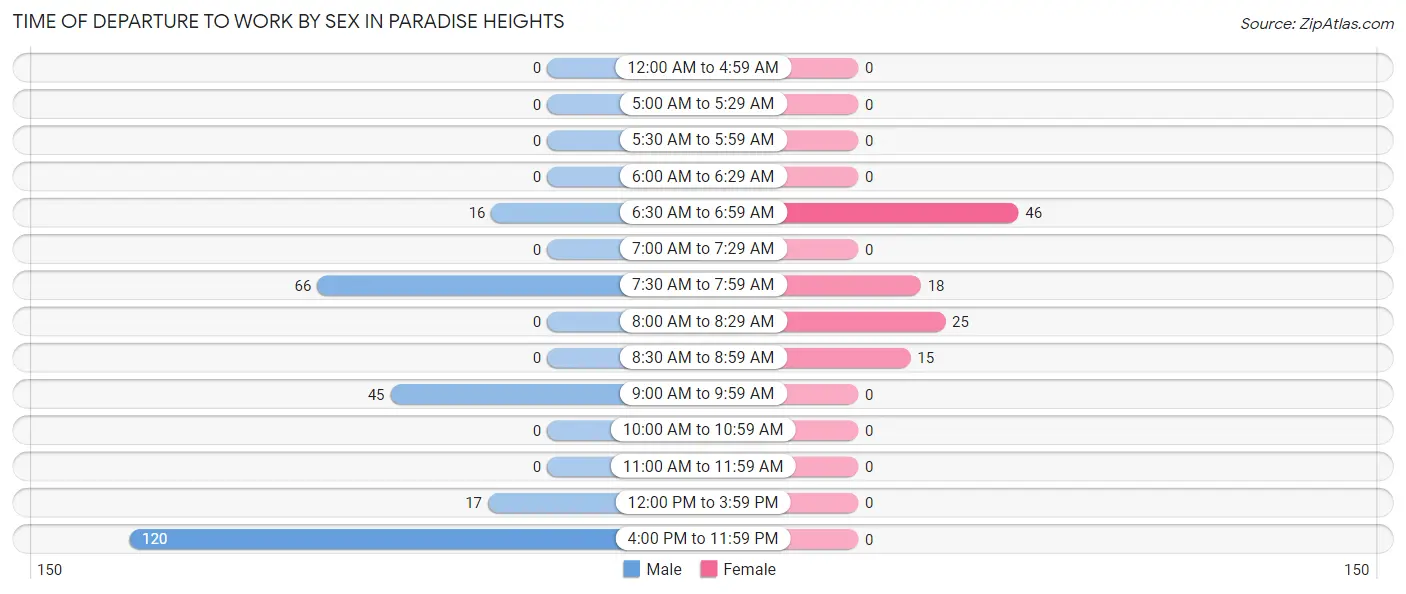
| Time of Departure | Male | Female |
| 12:00 AM to 4:59 AM | 0 (0.0%) | 0 (0.0%) |
| 5:00 AM to 5:29 AM | 0 (0.0%) | 0 (0.0%) |
| 5:30 AM to 5:59 AM | 0 (0.0%) | 0 (0.0%) |
| 6:00 AM to 6:29 AM | 0 (0.0%) | 0 (0.0%) |
| 6:30 AM to 6:59 AM | 16 (6.1%) | 46 (44.2%) |
| 7:00 AM to 7:29 AM | 0 (0.0%) | 0 (0.0%) |
| 7:30 AM to 7:59 AM | 66 (25.0%) | 18 (17.3%) |
| 8:00 AM to 8:29 AM | 0 (0.0%) | 25 (24.0%) |
| 8:30 AM to 8:59 AM | 0 (0.0%) | 15 (14.4%) |
| 9:00 AM to 9:59 AM | 45 (17.1%) | 0 (0.0%) |
| 10:00 AM to 10:59 AM | 0 (0.0%) | 0 (0.0%) |
| 11:00 AM to 11:59 AM | 0 (0.0%) | 0 (0.0%) |
| 12:00 PM to 3:59 PM | 17 (6.4%) | 0 (0.0%) |
| 4:00 PM to 11:59 PM | 120 (45.5%) | 0 (0.0%) |
| Total | 264 (100.0%) | 104 (100.0%) |
Housing Occupancy in Paradise Heights
Occupancy by Ownership in Paradise Heights
Of the total 492 dwellings in Paradise Heights, owner-occupied units account for 319 (64.8%), while renter-occupied units make up 173 (35.2%).
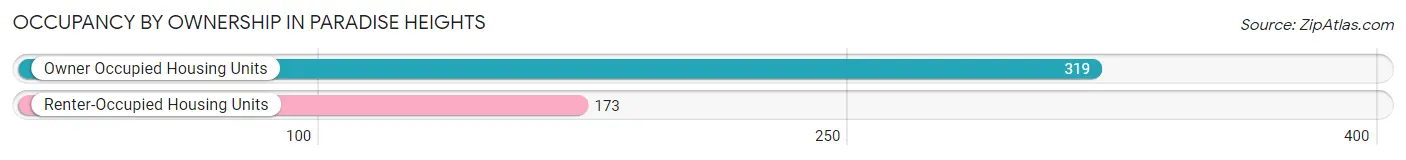
| Occupancy | # Housing Units | % Housing Units |
| Owner Occupied Housing Units | 319 | 64.8% |
| Renter-Occupied Housing Units | 173 | 35.2% |
| Total Occupied Housing Units | 492 | 100.0% |
Occupancy by Household Size in Paradise Heights
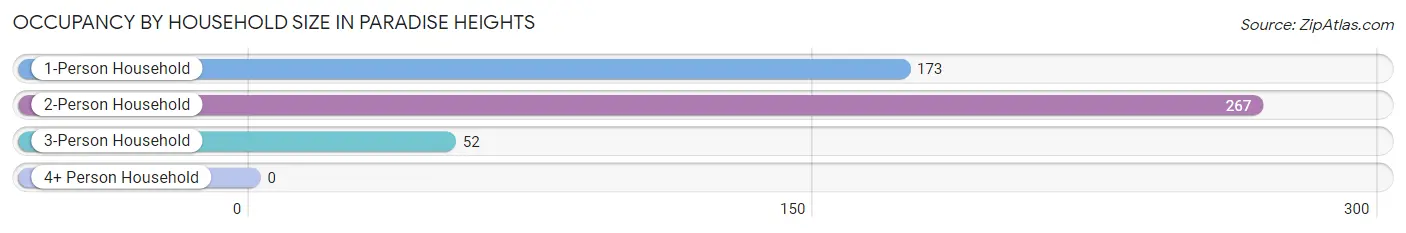
| Household Size | # Housing Units | % Housing Units |
| 1-Person Household | 173 | 35.2% |
| 2-Person Household | 267 | 54.3% |
| 3-Person Household | 52 | 10.6% |
| 4+ Person Household | 0 | 0.0% |
| Total Housing Units | 492 | 100.0% |
Occupancy by Ownership by Household Size in Paradise Heights
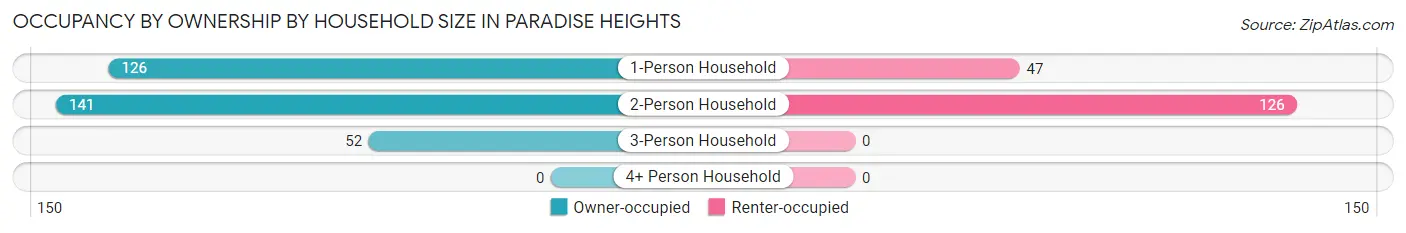
| Household Size | Owner-occupied | Renter-occupied |
| 1-Person Household | 126 (72.8%) | 47 (27.2%) |
| 2-Person Household | 141 (52.8%) | 126 (47.2%) |
| 3-Person Household | 52 (100.0%) | 0 (0.0%) |
| 4+ Person Household | 0 (0.0%) | 0 (0.0%) |
| Total Housing Units | 319 (64.8%) | 173 (35.2%) |
Occupancy by Educational Attainment in Paradise Heights
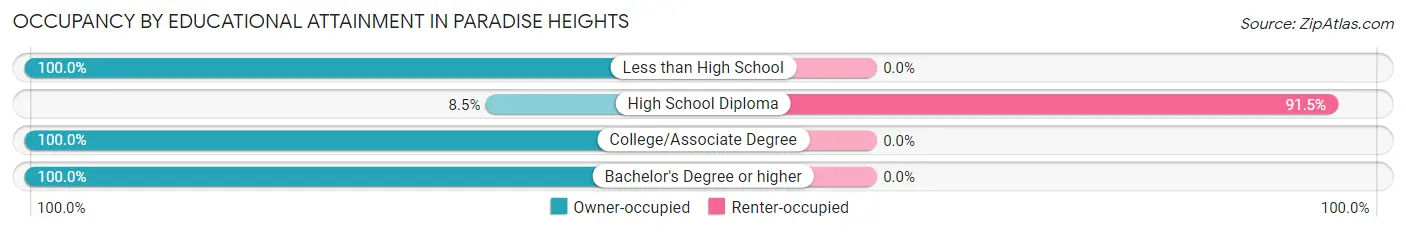
| Household Size | Owner-occupied | Renter-occupied |
| Less than High School | 126 (100.0%) | 0 (0.0%) |
| High School Diploma | 16 (8.5%) | 173 (91.5%) |
| College/Associate Degree | 60 (100.0%) | 0 (0.0%) |
| Bachelor's Degree or higher | 117 (100.0%) | 0 (0.0%) |
Occupancy by Age of Householder in Paradise Heights
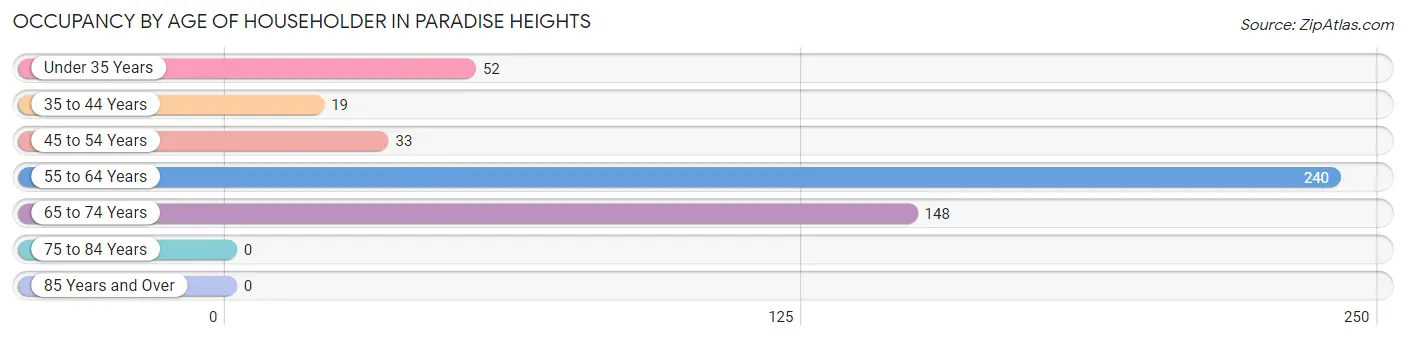
| Age Bracket | # Households | % Households |
| Under 35 Years | 52 | 10.6% |
| 35 to 44 Years | 19 | 3.9% |
| 45 to 54 Years | 33 | 6.7% |
| 55 to 64 Years | 240 | 48.8% |
| 65 to 74 Years | 148 | 30.1% |
| 75 to 84 Years | 0 | 0.0% |
| 85 Years and Over | 0 | 0.0% |
| Total | 492 | 100.0% |
Housing Finances in Paradise Heights
Median Income by Occupancy in Paradise Heights
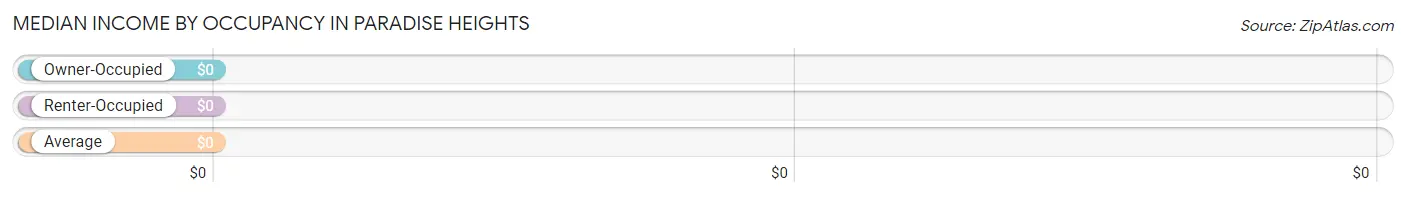
| Occupancy Type | # Households | Median Income |
| Owner-Occupied | 319 (64.8%) | $0 |
| Renter-Occupied | 173 (35.2%) | $0 |
| Average | 492 (100.0%) | $0 |
Occupancy by Householder Income Bracket in Paradise Heights
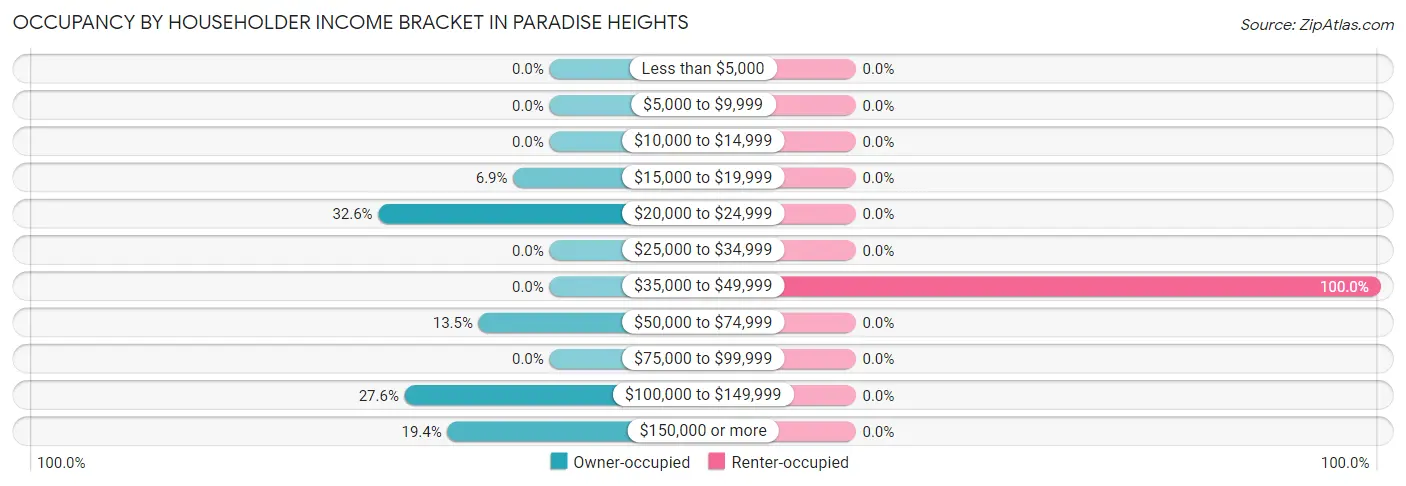
| Income Bracket | Owner-occupied | Renter-occupied |
| Less than $5,000 | 0 (0.0%) | 0 (0.0%) |
| $5,000 to $9,999 | 0 (0.0%) | 0 (0.0%) |
| $10,000 to $14,999 | 0 (0.0%) | 0 (0.0%) |
| $15,000 to $19,999 | 22 (6.9%) | 0 (0.0%) |
| $20,000 to $24,999 | 104 (32.6%) | 0 (0.0%) |
| $25,000 to $34,999 | 0 (0.0%) | 0 (0.0%) |
| $35,000 to $49,999 | 0 (0.0%) | 173 (100.0%) |
| $50,000 to $74,999 | 43 (13.5%) | 0 (0.0%) |
| $75,000 to $99,999 | 0 (0.0%) | 0 (0.0%) |
| $100,000 to $149,999 | 88 (27.6%) | 0 (0.0%) |
| $150,000 or more | 62 (19.4%) | 0 (0.0%) |
| Total | 319 (100.0%) | 173 (100.0%) |
Monthly Housing Cost Tiers in Paradise Heights
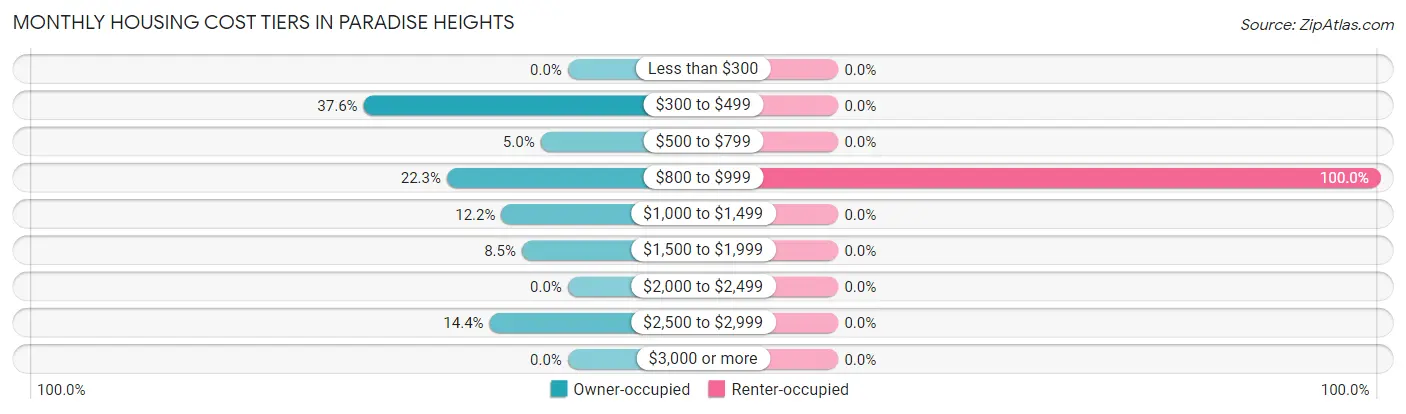
| Monthly Cost | Owner-occupied | Renter-occupied |
| Less than $300 | 0 (0.0%) | 0 (0.0%) |
| $300 to $499 | 120 (37.6%) | 0 (0.0%) |
| $500 to $799 | 16 (5.0%) | 0 (0.0%) |
| $800 to $999 | 71 (22.3%) | 173 (100.0%) |
| $1,000 to $1,499 | 39 (12.2%) | 0 (0.0%) |
| $1,500 to $1,999 | 27 (8.5%) | 0 (0.0%) |
| $2,000 to $2,499 | 0 (0.0%) | 0 (0.0%) |
| $2,500 to $2,999 | 46 (14.4%) | 0 (0.0%) |
| $3,000 or more | 0 (0.0%) | 0 (0.0%) |
| Total | 319 (100.0%) | 173 (100.0%) |
Physical Housing Characteristics in Paradise Heights
Housing Structures in Paradise Heights
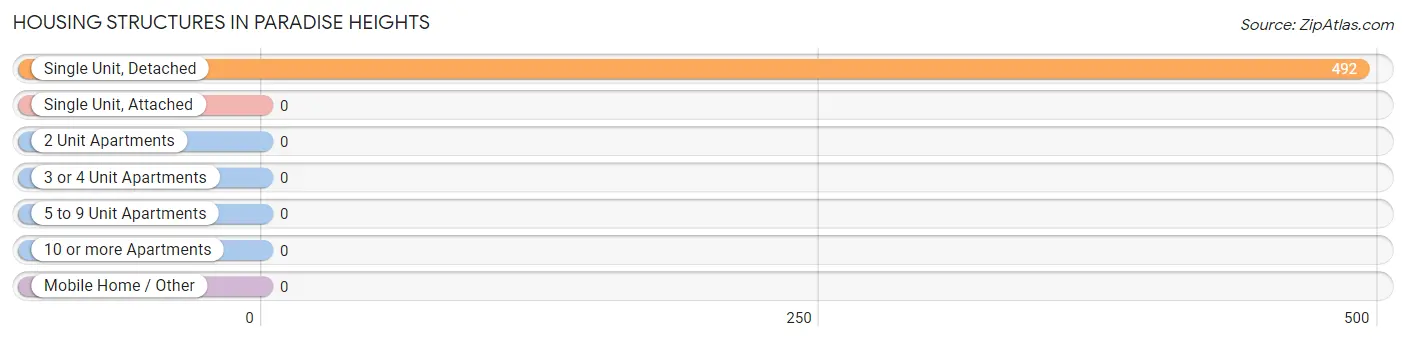
| Structure Type | # Housing Units | % Housing Units |
| Single Unit, Detached | 492 | 100.0% |
| Single Unit, Attached | 0 | 0.0% |
| 2 Unit Apartments | 0 | 0.0% |
| 3 or 4 Unit Apartments | 0 | 0.0% |
| 5 to 9 Unit Apartments | 0 | 0.0% |
| 10 or more Apartments | 0 | 0.0% |
| Mobile Home / Other | 0 | 0.0% |
| Total | 492 | 100.0% |
Housing Structures by Occupancy in Paradise Heights
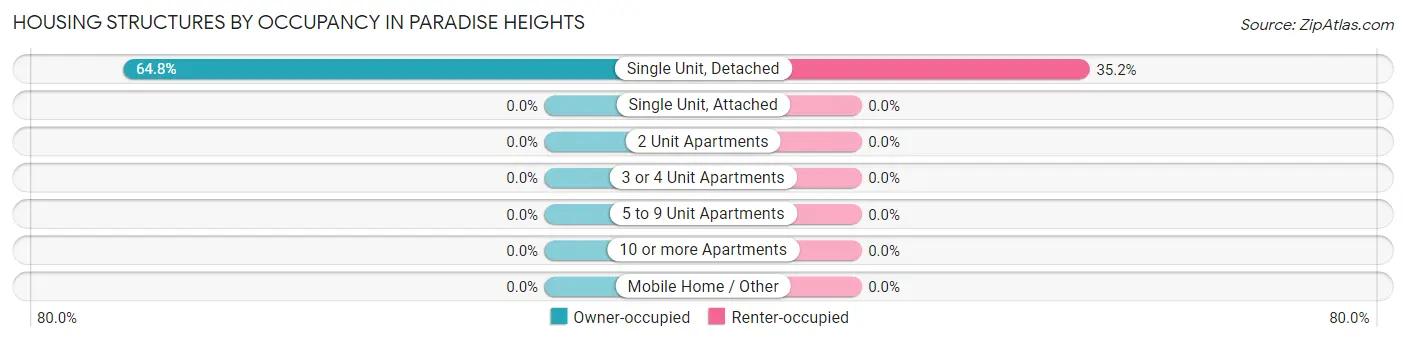
| Structure Type | Owner-occupied | Renter-occupied |
| Single Unit, Detached | 319 (64.8%) | 173 (35.2%) |
| Single Unit, Attached | 0 (0.0%) | 0 (0.0%) |
| 2 Unit Apartments | 0 (0.0%) | 0 (0.0%) |
| 3 or 4 Unit Apartments | 0 (0.0%) | 0 (0.0%) |
| 5 to 9 Unit Apartments | 0 (0.0%) | 0 (0.0%) |
| 10 or more Apartments | 0 (0.0%) | 0 (0.0%) |
| Mobile Home / Other | 0 (0.0%) | 0 (0.0%) |
| Total | 319 (64.8%) | 173 (35.2%) |
Housing Structures by Number of Rooms in Paradise Heights
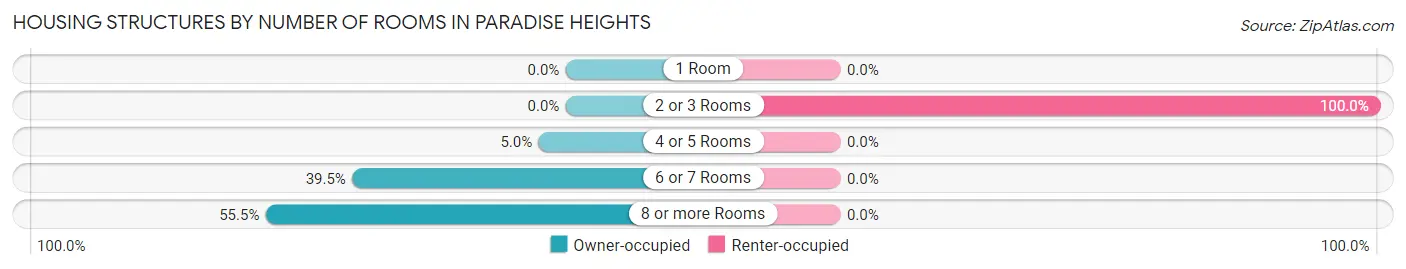
| Number of Rooms | Owner-occupied | Renter-occupied |
| 1 Room | 0 (0.0%) | 0 (0.0%) |
| 2 or 3 Rooms | 0 (0.0%) | 173 (100.0%) |
| 4 or 5 Rooms | 16 (5.0%) | 0 (0.0%) |
| 6 or 7 Rooms | 126 (39.5%) | 0 (0.0%) |
| 8 or more Rooms | 177 (55.5%) | 0 (0.0%) |
| Total | 319 (100.0%) | 173 (100.0%) |
Housing Structure by Heating Type in Paradise Heights
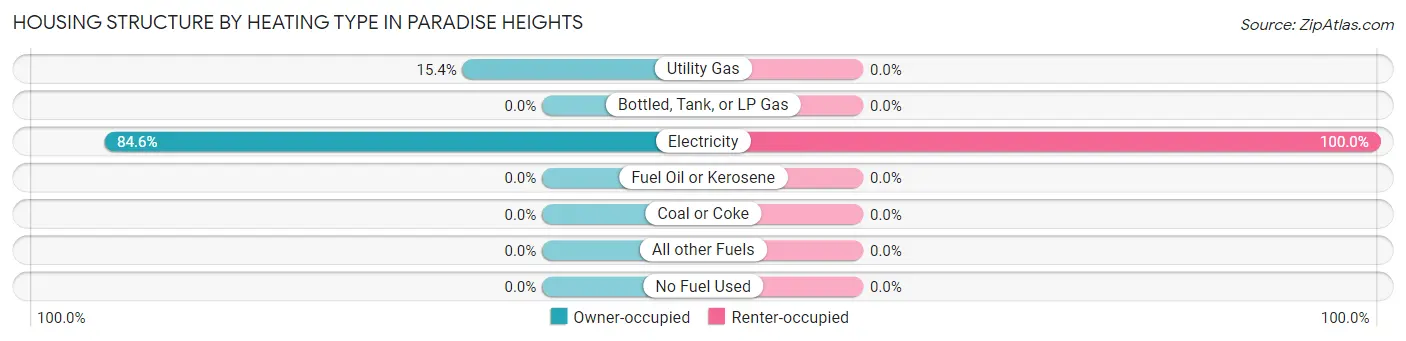
| Heating Type | Owner-occupied | Renter-occupied |
| Utility Gas | 49 (15.4%) | 0 (0.0%) |
| Bottled, Tank, or LP Gas | 0 (0.0%) | 0 (0.0%) |
| Electricity | 270 (84.6%) | 173 (100.0%) |
| Fuel Oil or Kerosene | 0 (0.0%) | 0 (0.0%) |
| Coal or Coke | 0 (0.0%) | 0 (0.0%) |
| All other Fuels | 0 (0.0%) | 0 (0.0%) |
| No Fuel Used | 0 (0.0%) | 0 (0.0%) |
| Total | 319 (100.0%) | 173 (100.0%) |
Household Vehicle Usage in Paradise Heights
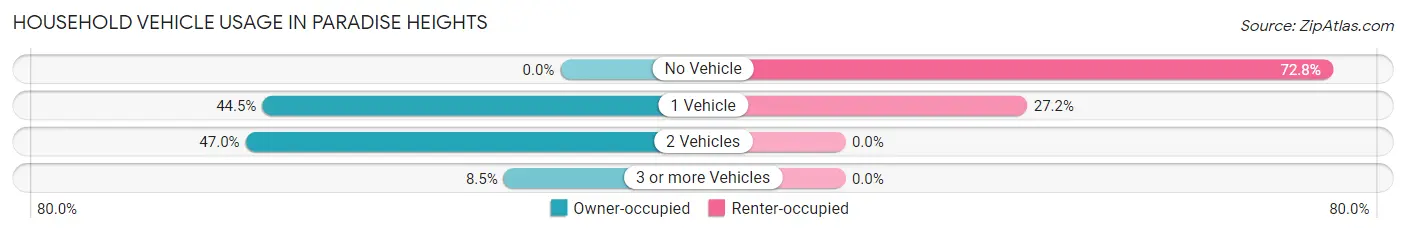
| Vehicles per Household | Owner-occupied | Renter-occupied |
| No Vehicle | 0 (0.0%) | 126 (72.8%) |
| 1 Vehicle | 142 (44.5%) | 47 (27.2%) |
| 2 Vehicles | 150 (47.0%) | 0 (0.0%) |
| 3 or more Vehicles | 27 (8.5%) | 0 (0.0%) |
| Total | 319 (100.0%) | 173 (100.0%) |
Real Estate & Mortgages in Paradise Heights
Real Estate and Mortgage Overview in Paradise Heights
| Characteristic | Without Mortgage | With Mortgage |
| Housing Units | 158 | 161 |
| Median Property Value | - | - |
| Median Household Income | $21,370 | $46 |
| Monthly Housing Costs | $333 | $0 |
| Real Estate Taxes | $376 | $17 |
Property Value by Mortgage Status in Paradise Heights
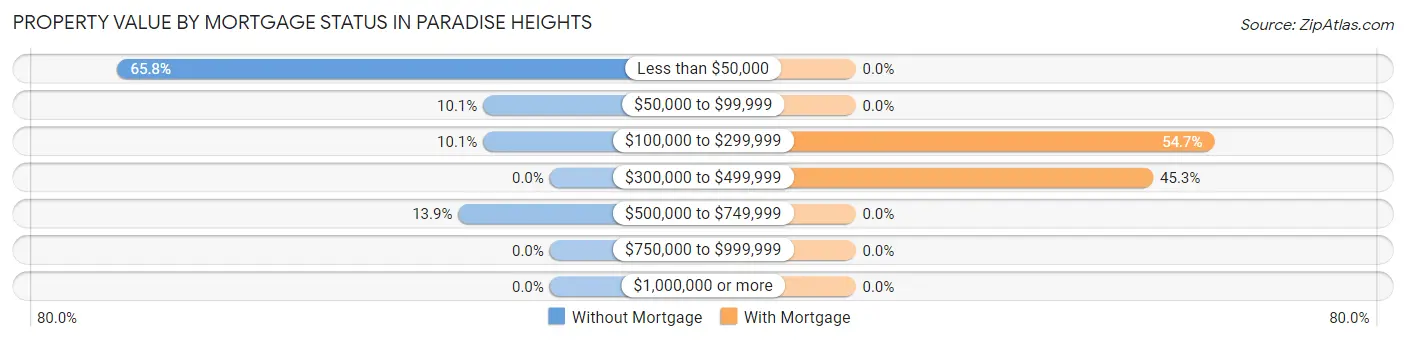
| Property Value | Without Mortgage | With Mortgage |
| Less than $50,000 | 104 (65.8%) | 0 (0.0%) |
| $50,000 to $99,999 | 16 (10.1%) | 0 (0.0%) |
| $100,000 to $299,999 | 16 (10.1%) | 88 (54.7%) |
| $300,000 to $499,999 | 0 (0.0%) | 73 (45.3%) |
| $500,000 to $749,999 | 22 (13.9%) | 0 (0.0%) |
| $750,000 to $999,999 | 0 (0.0%) | 0 (0.0%) |
| $1,000,000 or more | 0 (0.0%) | 0 (0.0%) |
| Total | 158 (100.0%) | 161 (100.0%) |
Household Income by Mortgage Status in Paradise Heights
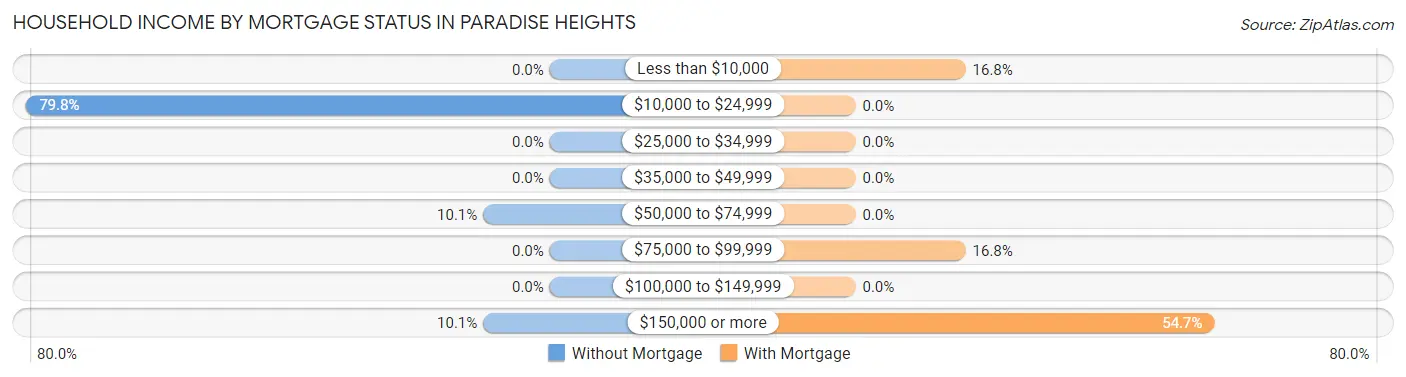
| Household Income | Without Mortgage | With Mortgage |
| Less than $10,000 | 0 (0.0%) | 27 (16.8%) |
| $10,000 to $24,999 | 126 (79.7%) | 0 (0.0%) |
| $25,000 to $34,999 | 0 (0.0%) | 0 (0.0%) |
| $35,000 to $49,999 | 0 (0.0%) | 0 (0.0%) |
| $50,000 to $74,999 | 16 (10.1%) | 0 (0.0%) |
| $75,000 to $99,999 | 0 (0.0%) | 27 (16.8%) |
| $100,000 to $149,999 | 0 (0.0%) | 0 (0.0%) |
| $150,000 or more | 16 (10.1%) | 88 (54.7%) |
| Total | 158 (100.0%) | 161 (100.0%) |
Property Value to Household Income Ratio in Paradise Heights
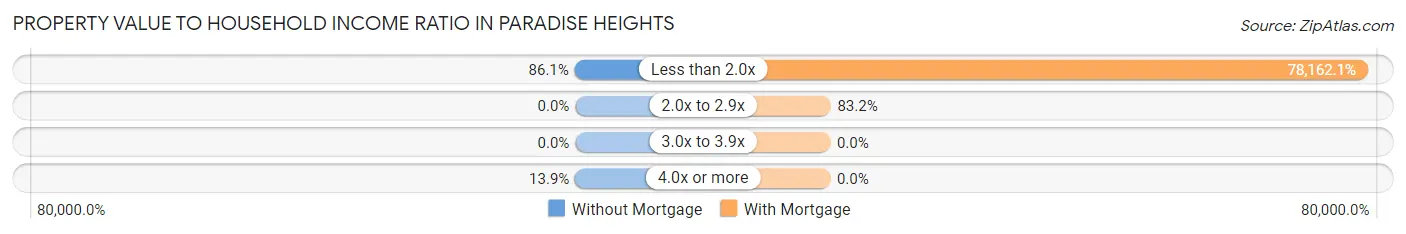
| Value-to-Income Ratio | Without Mortgage | With Mortgage |
| Less than 2.0x | 136 (86.1%) | 125,841 (78,162.1%) |
| 2.0x to 2.9x | 0 (0.0%) | 134 (83.2%) |
| 3.0x to 3.9x | 0 (0.0%) | 0 (0.0%) |
| 4.0x or more | 22 (13.9%) | 0 (0.0%) |
| Total | 158 (100.0%) | 161 (100.0%) |
Real Estate Taxes by Mortgage Status in Paradise Heights
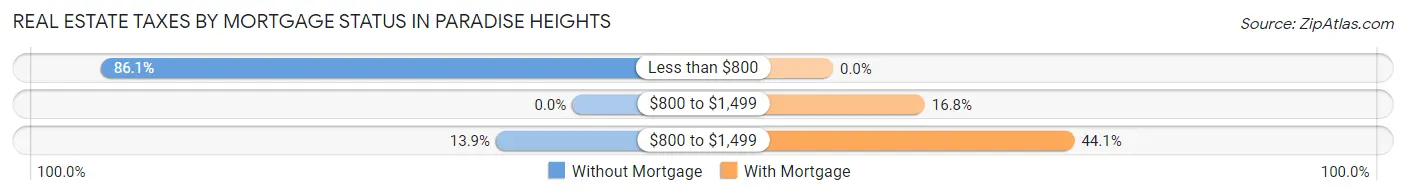
| Property Taxes | Without Mortgage | With Mortgage |
| Less than $800 | 136 (86.1%) | 0 (0.0%) |
| $800 to $1,499 | 0 (0.0%) | 27 (16.8%) |
| $800 to $1,499 | 22 (13.9%) | 71 (44.1%) |
| Total | 158 (100.0%) | 161 (100.0%) |
Health & Disability in Paradise Heights
Health Insurance Coverage by Age in Paradise Heights
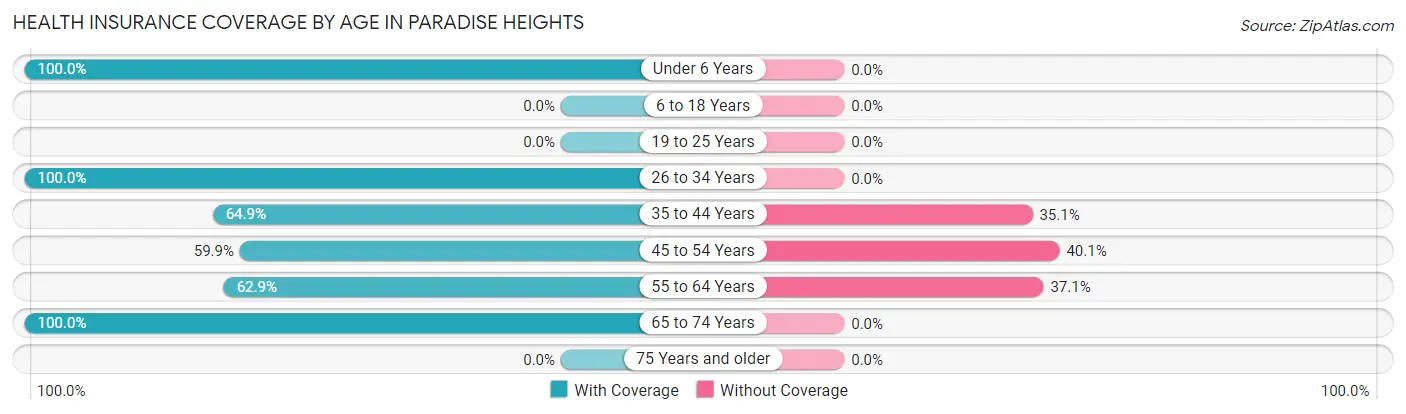
| Age Bracket | With Coverage | Without Coverage |
| Under 6 Years | 63 (100.0%) | 0 (0.0%) |
| 6 to 18 Years | 0 (0.0%) | 0 (0.0%) |
| 19 to 25 Years | 0 (0.0%) | 0 (0.0%) |
| 26 to 34 Years | 103 (100.0%) | 0 (0.0%) |
| 35 to 44 Years | 37 (64.9%) | 20 (35.1%) |
| 45 to 54 Years | 94 (59.9%) | 63 (40.1%) |
| 55 to 64 Years | 176 (62.9%) | 104 (37.1%) |
| 65 to 74 Years | 148 (100.0%) | 0 (0.0%) |
| 75 Years and older | 0 (0.0%) | 0 (0.0%) |
| Total | 621 (76.9%) | 187 (23.1%) |
Health Insurance Coverage by Citizenship Status in Paradise Heights
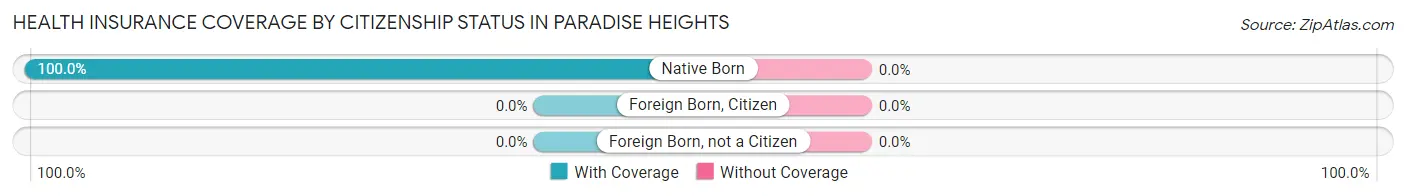
| Citizenship Status | With Coverage | Without Coverage |
| Native Born | 63 (100.0%) | 0 (0.0%) |
| Foreign Born, Citizen | 0 (0.0%) | 0 (0.0%) |
| Foreign Born, not a Citizen | 0 (0.0%) | 0 (0.0%) |
Health Insurance Coverage by Household Income in Paradise Heights
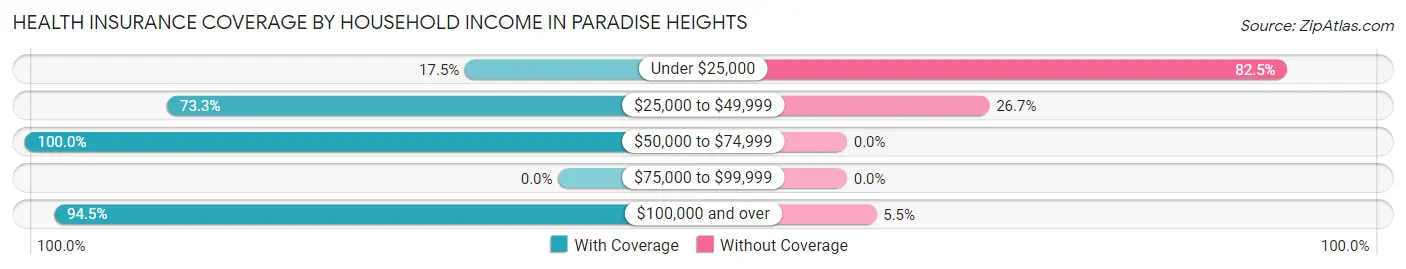
| Household Income | With Coverage | Without Coverage |
| Under $25,000 | 22 (17.5%) | 104 (82.5%) |
| $25,000 to $49,999 | 173 (73.3%) | 63 (26.7%) |
| $50,000 to $74,999 | 84 (100.0%) | 0 (0.0%) |
| $75,000 to $99,999 | 0 (0.0%) | 0 (0.0%) |
| $100,000 and over | 342 (94.5%) | 20 (5.5%) |
Public vs Private Health Insurance Coverage by Age in Paradise Heights
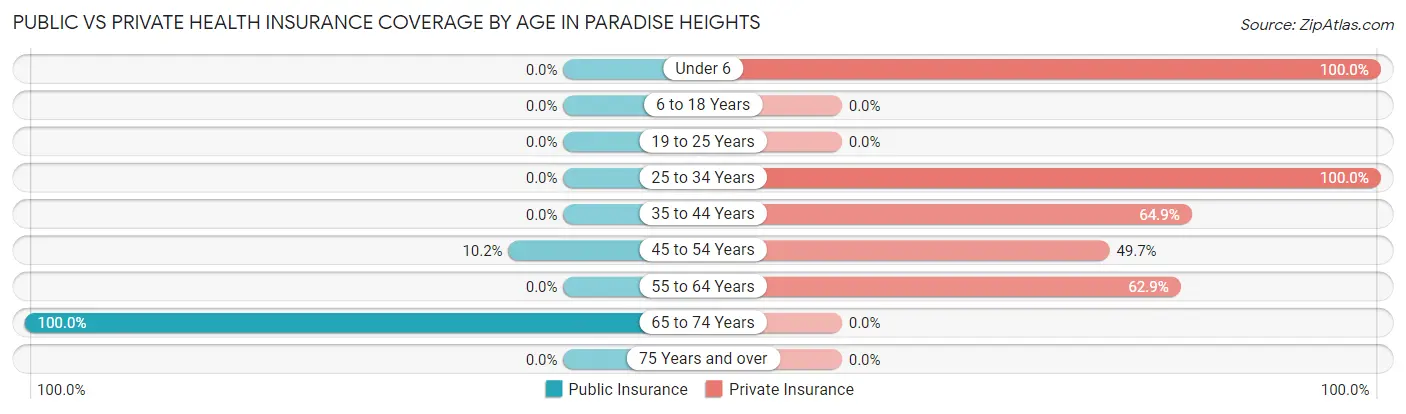
| Age Bracket | Public Insurance | Private Insurance |
| Under 6 | 0 (0.0%) | 63 (100.0%) |
| 6 to 18 Years | 0 (0.0%) | 0 (0.0%) |
| 19 to 25 Years | 0 (0.0%) | 0 (0.0%) |
| 25 to 34 Years | 0 (0.0%) | 103 (100.0%) |
| 35 to 44 Years | 0 (0.0%) | 37 (64.9%) |
| 45 to 54 Years | 16 (10.2%) | 78 (49.7%) |
| 55 to 64 Years | 0 (0.0%) | 176 (62.9%) |
| 65 to 74 Years | 148 (100.0%) | 0 (0.0%) |
| 75 Years and over | 0 (0.0%) | 0 (0.0%) |
| Total | 164 (20.3%) | 457 (56.6%) |
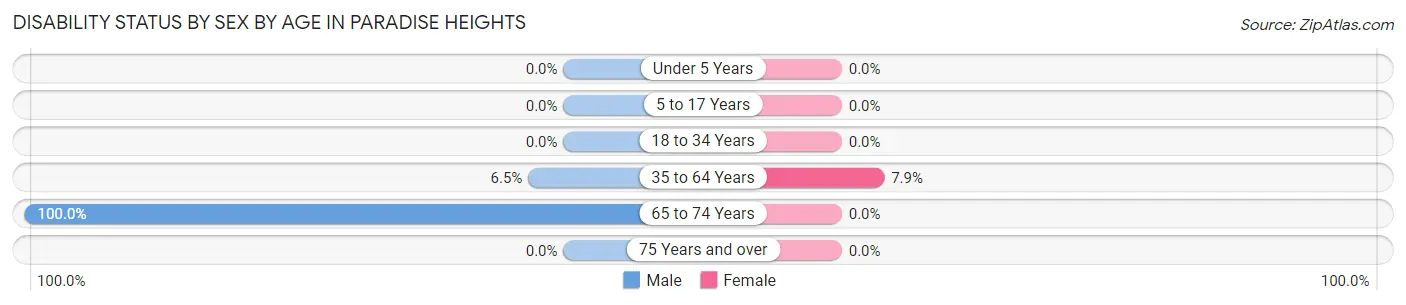
Disability Status by Sex by Age in Paradise Heights
| Age Bracket | Male | Female |
| Under 5 Years | 0 (0.0%) | 0 (0.0%) |
| 5 to 17 Years | 0 (0.0%) | 0 (0.0%) |
| 18 to 34 Years | 0 (0.0%) | 0 (0.0%) |
| 35 to 64 Years | 19 (6.5%) | 16 (7.9%) |
| 65 to 74 Years | 126 (100.0%) | 0 (0.0%) |
| 75 Years and over | 0 (0.0%) | 0 (0.0%) |
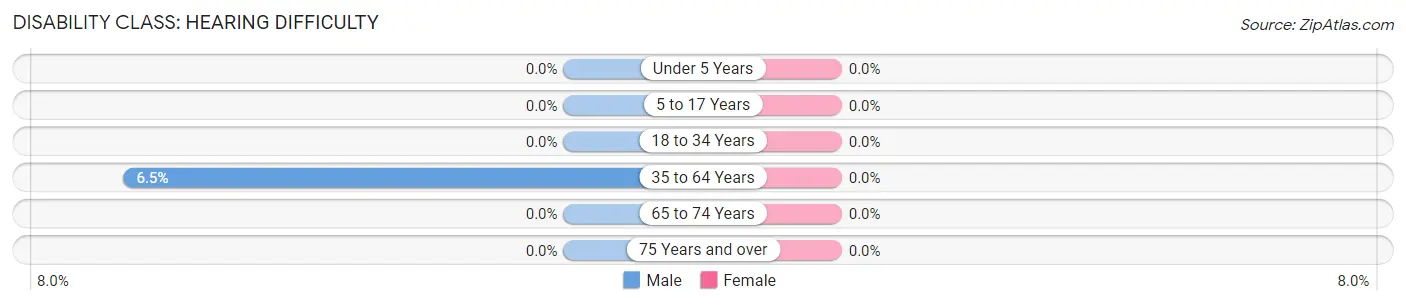
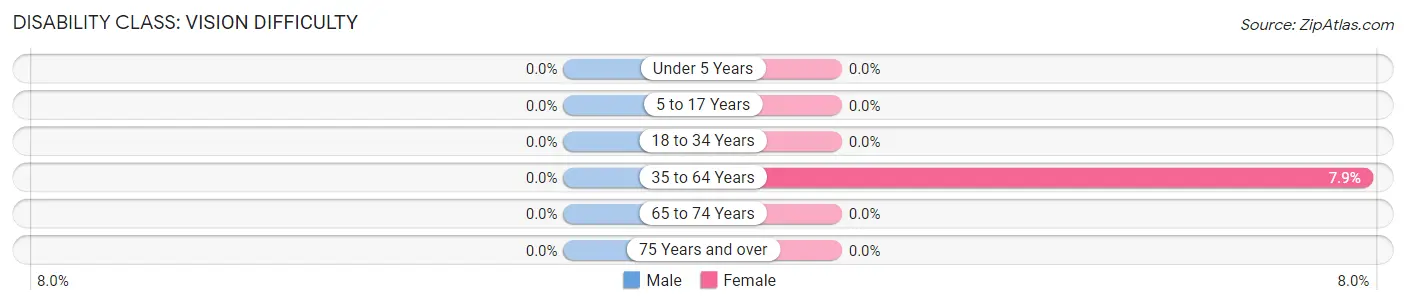
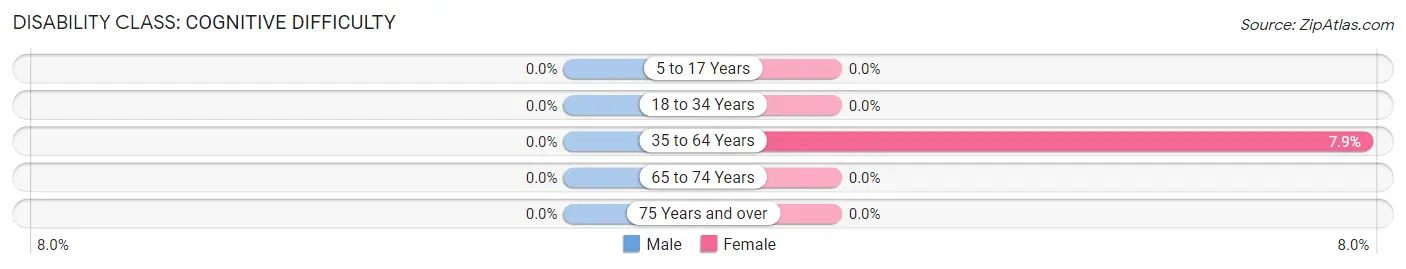
Disability Class by Sex by Age in Paradise Heights
Disability Class: Hearing Difficulty
| Age Bracket | Male | Female |
| Under 5 Years | 0 (0.0%) | 0 (0.0%) |
| 5 to 17 Years | 0 (0.0%) | 0 (0.0%) |
| 18 to 34 Years | 0 (0.0%) | 0 (0.0%) |
| 35 to 64 Years | 19 (6.5%) | 0 (0.0%) |
| 65 to 74 Years | 0 (0.0%) | 0 (0.0%) |
| 75 Years and over | 0 (0.0%) | 0 (0.0%) |
Disability Class: Vision Difficulty
| Age Bracket | Male | Female |
| Under 5 Years | 0 (0.0%) | 0 (0.0%) |
| 5 to 17 Years | 0 (0.0%) | 0 (0.0%) |
| 18 to 34 Years | 0 (0.0%) | 0 (0.0%) |
| 35 to 64 Years | 0 (0.0%) | 16 (7.9%) |
| 65 to 74 Years | 0 (0.0%) | 0 (0.0%) |
| 75 Years and over | 0 (0.0%) | 0 (0.0%) |
Disability Class: Cognitive Difficulty
| Age Bracket | Male | Female |
| 5 to 17 Years | 0 (0.0%) | 0 (0.0%) |
| 18 to 34 Years | 0 (0.0%) | 0 (0.0%) |
| 35 to 64 Years | 0 (0.0%) | 16 (7.9%) |
| 65 to 74 Years | 0 (0.0%) | 0 (0.0%) |
| 75 Years and over | 0 (0.0%) | 0 (0.0%) |
Disability Class: Ambulatory Difficulty
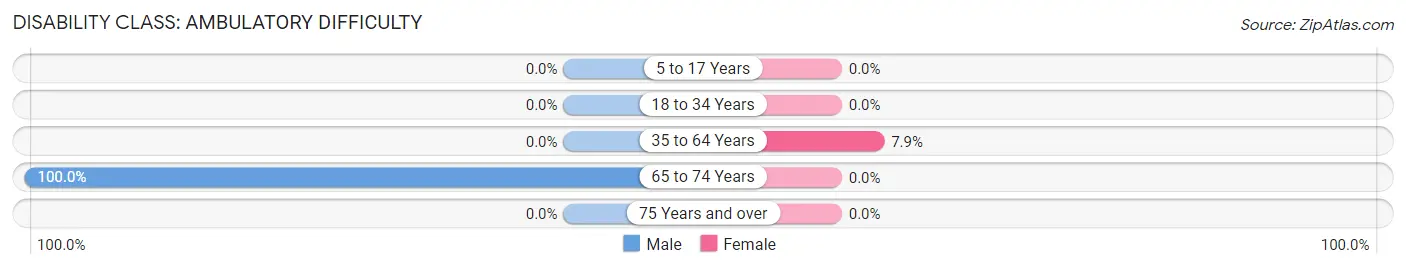
| Age Bracket | Male | Female |
| 5 to 17 Years | 0 (0.0%) | 0 (0.0%) |
| 18 to 34 Years | 0 (0.0%) | 0 (0.0%) |
| 35 to 64 Years | 0 (0.0%) | 16 (7.9%) |
| 65 to 74 Years | 126 (100.0%) | 0 (0.0%) |
| 75 Years and over | 0 (0.0%) | 0 (0.0%) |
Disability Class: Self-Care Difficulty
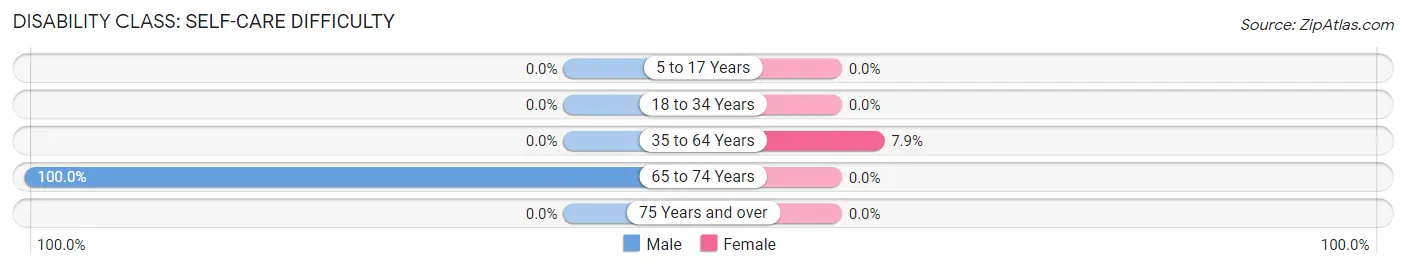
| Age Bracket | Male | Female |
| 5 to 17 Years | 0 (0.0%) | 0 (0.0%) |
| 18 to 34 Years | 0 (0.0%) | 0 (0.0%) |
| 35 to 64 Years | 0 (0.0%) | 16 (7.9%) |
| 65 to 74 Years | 126 (100.0%) | 0 (0.0%) |
| 75 Years and over | 0 (0.0%) | 0 (0.0%) |
Technology Access in Paradise Heights
Computing Device Access in Paradise Heights
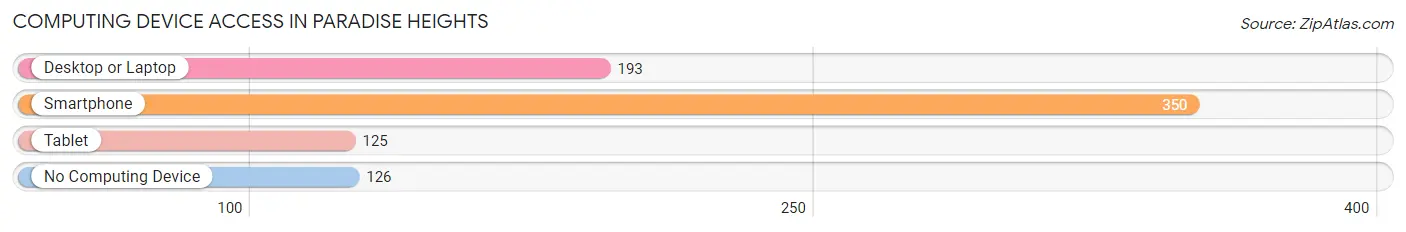
| Device Type | # Households | % Households |
| Desktop or Laptop | 193 | 39.2% |
| Smartphone | 350 | 71.1% |
| Tablet | 125 | 25.4% |
| No Computing Device | 126 | 25.6% |
| Total | 492 | 100.0% |
Internet Access in Paradise Heights
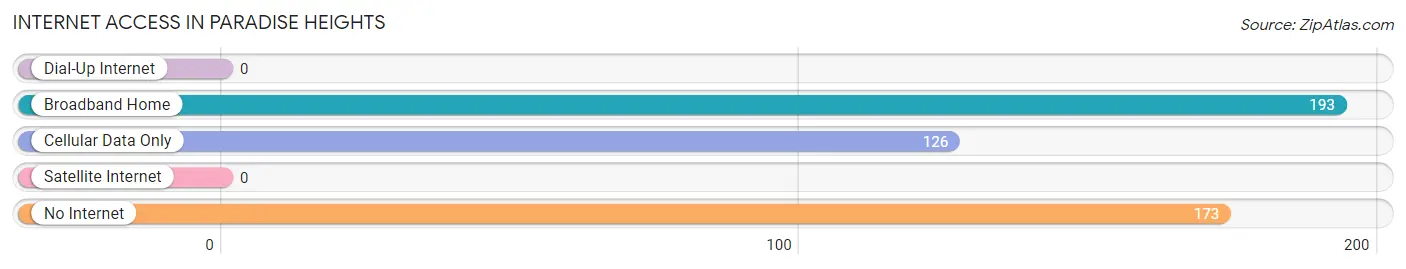
| Internet Type | # Households | % Households |
| Dial-Up Internet | 0 | 0.0% |
| Broadband Home | 193 | 39.2% |
| Cellular Data Only | 126 | 25.6% |
| Satellite Internet | 0 | 0.0% |
| No Internet | 173 | 35.2% |
| Total | 492 | 100.0% |
Paradise Heights Summary
Paradise Heights is a small, unincorporated community located in Orange County, Florida. It is situated in the northwest corner of the county, just south of the city of Orlando. The community is bordered by the cities of Winter Park, Maitland, and Altamonte Springs. The population of Paradise Heights was estimated to be around 4,000 in 2000.
History
Paradise Heights was founded in the late 1950s by a group of developers who wanted to create a suburban community in the area. The developers purchased a large tract of land and began to subdivide it into residential lots. The first homes were built in the late 1950s and early 1960s. The community was named Paradise Heights because of its location on a hill overlooking the city of Orlando.
The community grew steadily throughout the 1960s and 1970s, and by the 1980s it had become a popular place to live for families and retirees. The community was incorporated in 1988, and the town council was established. The town council was responsible for providing services such as police and fire protection, garbage collection, and street maintenance.
Geography
Paradise Heights is located in the northwest corner of Orange County, Florida. It is bordered by the cities of Winter Park, Maitland, and Altamonte Springs. The community is situated on a hill overlooking the city of Orlando. The terrain is mostly flat, with some rolling hills. The climate is subtropical, with hot, humid summers and mild winters.
Economy
The economy of Paradise Heights is largely based on tourism and retail. The community is home to several small businesses, including restaurants, shops, and services. The town also has a few larger employers, such as a hospital and a university.
Demographics
The population of Paradise Heights was estimated to be around 4,000 in 2000. The population is mostly white (83%), with a small percentage of African Americans (7%) and Hispanics (7%). The median household income is $45,000, and the median home value is $150,000. The town has a low crime rate and a high rate of homeownership.
Conclusion
Paradise Heights is a small, unincorporated community located in Orange County, Florida. It was founded in the late 1950s and has grown steadily since then. The population is mostly white, with a small percentage of African Americans and Hispanics. The economy is largely based on tourism and retail, and the town has a low crime rate and a high rate of homeownership. Paradise Heights is a great place to live for families and retirees alike.
Common Questions
What is Per Capita Income in Paradise Heights?
Per Capita income in Paradise Heights is $44,642.
What is the Median Family Income in Paradise Heights?
Median Family Income in Paradise Heights is $126,250.
What is Inequality or Gini Index in Paradise Heights?
Inequality or Gini Index in Paradise Heights is 0.46.
What is the Total Population of Paradise Heights?
Total Population of Paradise Heights is 808.
What is the Total Male Population of Paradise Heights?
Total Male Population of Paradise Heights is 468.
What is the Total Female Population of Paradise Heights?
Total Female Population of Paradise Heights is 340.
What is the Ratio of Males per 100 Females in Paradise Heights?
There are 137.65 Males per 100 Females in Paradise Heights.
What is the Ratio of Females per 100 Males in Paradise Heights?
There are 72.65 Females per 100 Males in Paradise Heights.
What is the Median Population Age in Paradise Heights?
Median Population Age in Paradise Heights is 56.0 Years.
What is the Average Family Size in Paradise Heights
Average Family Size in Paradise Heights is 2.3 People.
What is the Average Household Size in Paradise Heights
Average Household Size in Paradise Heights is 1.6 People.
How Large is the Labor Force in Paradise Heights?
There are 561 People in the Labor Forcein in Paradise Heights.
What is the Percentage of People in the Labor Force in Paradise Heights?
75.3% of People are in the Labor Force in Paradise Heights.