Zip Codes with the Highest Percentage of Self-Employed / Not Incorporated in Florida
RELATED REPORTS & OPTIONS
Self-Employed / Not Incorporated
Florida
Compare Zip Codes
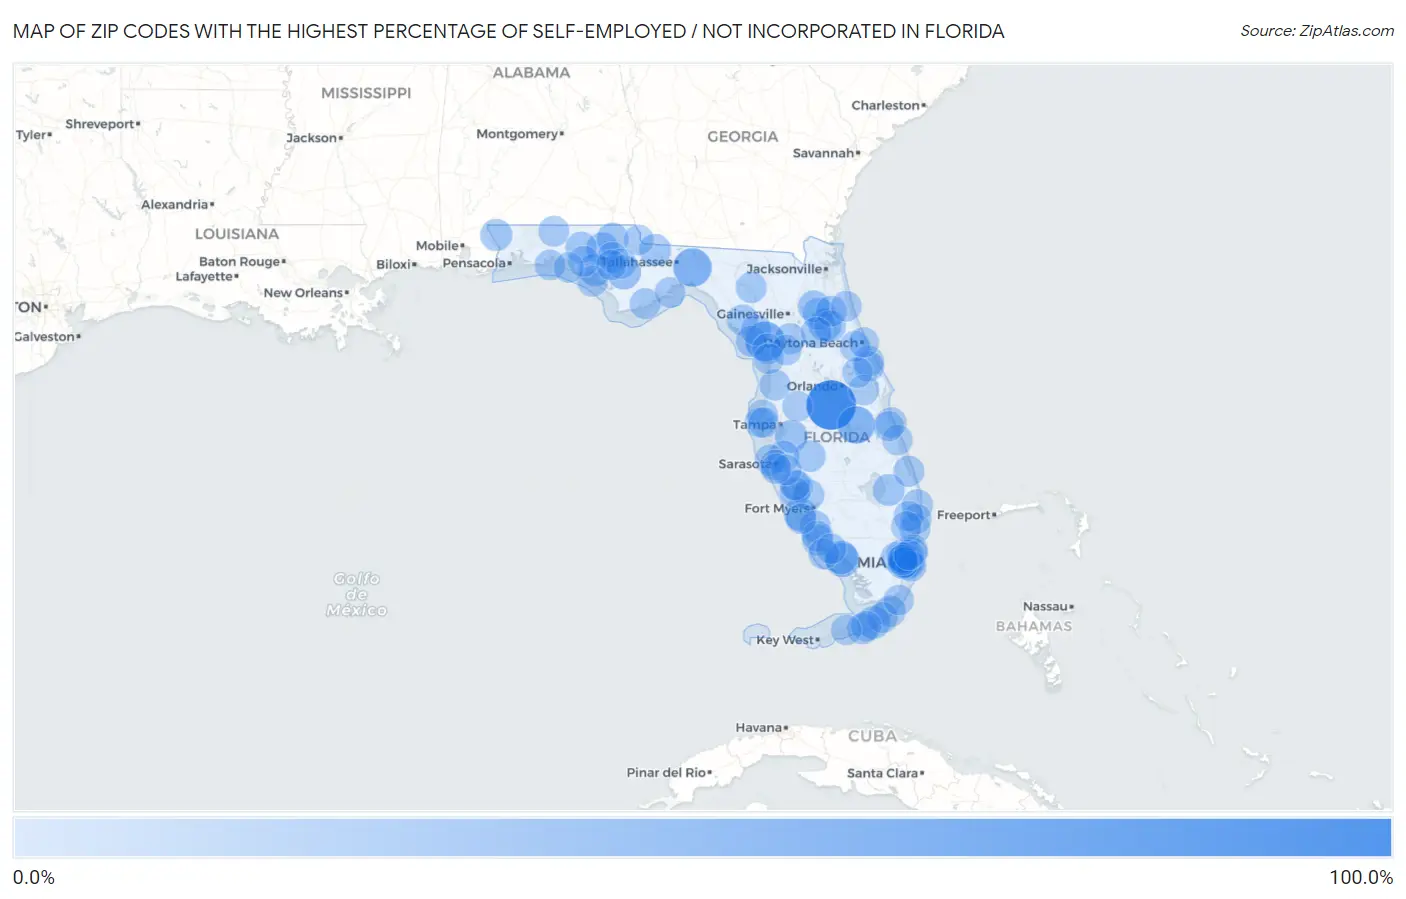
Map of Zip Codes with the Highest Percentage of Self-Employed / Not Incorporated in Florida
0.0%
100.0%
Zip Codes with the Highest Percentage of Self-Employed / Not Incorporated in Florida
| Zip Code | % Self-Employed / Not Incorporated | vs State | vs National | |
| 1. | 33858 | 100.0% | 6.1%(+93.9)#1 | 5.8%(+94.2)#1 |
| 2. | 32639 | 52.5% | 6.1%(+46.5)#2 | 5.8%(+46.7)#188 |
| 3. | 32361 | 46.7% | 6.1%(+40.6)#3 | 5.8%(+40.9)#274 |
| 4. | 34739 | 43.1% | 6.1%(+37.1)#4 | 5.8%(+37.3)#335 |
| 5. | 34138 | 27.7% | 6.1%(+21.6)#5 | 5.8%(+21.9)#911 |
| 6. | 32449 | 26.0% | 6.1%(+19.9)#6 | 5.8%(+20.2)#1,041 |
| 7. | 34139 | 25.0% | 6.1%(+18.9)#7 | 5.8%(+19.2)#1,150 |
| 8. | 33956 | 21.6% | 6.1%(+15.5)#8 | 5.8%(+15.8)#1,539 |
| 9. | 33001 | 21.6% | 6.1%(+15.5)#9 | 5.8%(+15.8)#1,541 |
| 10. | 32193 | 20.9% | 6.1%(+14.8)#10 | 5.8%(+15.1)#1,654 |
| 11. | 32463 | 20.5% | 6.1%(+14.4)#11 | 5.8%(+14.6)#1,732 |
| 12. | 33503 | 20.4% | 6.1%(+14.3)#12 | 5.8%(+14.6)#1,748 |
| 13. | 32409 | 20.1% | 6.1%(+14.0)#13 | 5.8%(+14.3)#1,785 |
| 14. | 33135 | 18.6% | 6.1%(+12.5)#14 | 5.8%(+12.8)#2,147 |
| 15. | 32431 | 17.8% | 6.1%(+11.7)#15 | 5.8%(+12.0)#2,378 |
| 16. | 33128 | 17.8% | 6.1%(+11.7)#16 | 5.8%(+12.0)#2,382 |
| 17. | 32147 | 17.7% | 6.1%(+11.6)#17 | 5.8%(+11.9)#2,398 |
| 18. | 32568 | 17.6% | 6.1%(+11.5)#18 | 5.8%(+11.8)#2,421 |
| 19. | 32332 | 17.5% | 6.1%(+11.4)#19 | 5.8%(+11.7)#2,472 |
| 20. | 33438 | 16.9% | 6.1%(+10.8)#20 | 5.8%(+11.0)#2,673 |
| 21. | 32140 | 16.7% | 6.1%(+10.6)#21 | 5.8%(+10.9)#2,728 |
| 22. | 32157 | 15.8% | 6.1%(+9.71)#22 | 5.8%(+9.99)#3,070 |
| 23. | 33070 | 15.8% | 6.1%(+9.69)#23 | 5.8%(+9.96)#3,088 |
| 24. | 33125 | 15.5% | 6.1%(+9.43)#24 | 5.8%(+9.70)#3,190 |
| 25. | 34134 | 15.3% | 6.1%(+9.24)#25 | 5.8%(+9.52)#3,265 |
| 26. | 33865 | 15.3% | 6.1%(+9.21)#26 | 5.8%(+9.48)#3,284 |
| 27. | 32455 | 15.3% | 6.1%(+9.18)#27 | 5.8%(+9.45)#3,297 |
| 28. | 34211 | 15.1% | 6.1%(+8.98)#28 | 5.8%(+9.25)#3,387 |
| 29. | 34102 | 14.4% | 6.1%(+8.31)#29 | 5.8%(+8.58)#3,703 |
| 30. | 33051 | 14.3% | 6.1%(+8.20)#30 | 5.8%(+8.47)#3,735 |
| 31. | 33480 | 13.9% | 6.1%(+7.80)#31 | 5.8%(+8.07)#3,971 |
| 32. | 33955 | 13.9% | 6.1%(+7.79)#32 | 5.8%(+8.06)#3,976 |
| 33. | 34482 | 13.5% | 6.1%(+7.45)#33 | 5.8%(+7.72)#4,167 |
| 34. | 34996 | 13.2% | 6.1%(+7.15)#34 | 5.8%(+7.42)#4,357 |
| 35. | 34613 | 13.2% | 6.1%(+7.14)#35 | 5.8%(+7.42)#4,366 |
| 36. | 32438 | 13.2% | 6.1%(+7.13)#36 | 5.8%(+7.40)#4,377 |
| 37. | 32071 | 13.1% | 6.1%(+7.04)#37 | 5.8%(+7.31)#4,440 |
| 38. | 32131 | 13.1% | 6.1%(+7.04)#38 | 5.8%(+7.31)#4,443 |
| 39. | 33948 | 13.1% | 6.1%(+7.02)#39 | 5.8%(+7.29)#4,452 |
| 40. | 32680 | 13.1% | 6.1%(+6.99)#40 | 5.8%(+7.27)#4,469 |
| 41. | 32625 | 13.0% | 6.1%(+6.92)#41 | 5.8%(+7.19)#4,519 |
| 42. | 33178 | 12.9% | 6.1%(+6.79)#42 | 5.8%(+7.06)#4,602 |
| 43. | 32134 | 12.9% | 6.1%(+6.77)#43 | 5.8%(+7.04)#4,616 |
| 44. | 34228 | 12.7% | 6.1%(+6.62)#44 | 5.8%(+6.89)#4,724 |
| 45. | 32567 | 12.5% | 6.1%(+6.40)#45 | 5.8%(+6.67)#4,909 |
| 46. | 32328 | 12.4% | 6.1%(+6.28)#46 | 5.8%(+6.55)#4,995 |
| 47. | 32408 | 12.4% | 6.1%(+6.27)#47 | 5.8%(+6.54)#4,999 |
| 48. | 33016 | 12.3% | 6.1%(+6.22)#48 | 5.8%(+6.49)#5,035 |
| 49. | 32437 | 12.3% | 6.1%(+6.21)#49 | 5.8%(+6.49)#5,038 |
| 50. | 32626 | 12.2% | 6.1%(+6.16)#50 | 5.8%(+6.43)#5,076 |
| 51. | 34103 | 12.2% | 6.1%(+6.14)#51 | 5.8%(+6.42)#5,086 |
| 52. | 33981 | 12.2% | 6.1%(+6.08)#52 | 5.8%(+6.36)#5,142 |
| 53. | 33013 | 12.1% | 6.1%(+6.05)#53 | 5.8%(+6.33)#5,173 |
| 54. | 33036 | 12.1% | 6.1%(+6.01)#54 | 5.8%(+6.29)#5,203 |
| 55. | 33144 | 12.1% | 6.1%(+6.01)#55 | 5.8%(+6.28)#5,209 |
| 56. | 34681 | 12.0% | 6.1%(+5.90)#56 | 5.8%(+6.18)#5,301 |
| 57. | 32141 | 11.8% | 6.1%(+5.72)#57 | 5.8%(+6.00)#5,440 |
| 58. | 33009 | 11.7% | 6.1%(+5.64)#58 | 5.8%(+5.92)#5,507 |
| 59. | 34145 | 11.7% | 6.1%(+5.63)#59 | 5.8%(+5.90)#5,531 |
| 60. | 33050 | 11.6% | 6.1%(+5.53)#60 | 5.8%(+5.80)#5,605 |
| 61. | 33010 | 11.6% | 6.1%(+5.47)#61 | 5.8%(+5.75)#5,652 |
| 62. | 32951 | 11.6% | 6.1%(+5.46)#62 | 5.8%(+5.73)#5,657 |
| 63. | 32086 | 11.5% | 6.1%(+5.46)#63 | 5.8%(+5.73)#5,660 |
| 64. | 33441 | 11.5% | 6.1%(+5.45)#64 | 5.8%(+5.72)#5,671 |
| 65. | 33012 | 11.5% | 6.1%(+5.41)#65 | 5.8%(+5.68)#5,704 |
| 66. | 32346 | 11.4% | 6.1%(+5.30)#66 | 5.8%(+5.58)#5,823 |
| 67. | 32759 | 11.3% | 6.1%(+5.21)#67 | 5.8%(+5.49)#5,900 |
| 68. | 34236 | 11.2% | 6.1%(+5.11)#68 | 5.8%(+5.39)#6,001 |
| 69. | 32541 | 11.1% | 6.1%(+4.98)#69 | 5.8%(+5.25)#6,137 |
| 70. | 33953 | 11.0% | 6.1%(+4.95)#70 | 5.8%(+5.22)#6,166 |
| 71. | 33037 | 11.0% | 6.1%(+4.92)#71 | 5.8%(+5.19)#6,201 |
| 72. | 32709 | 10.9% | 6.1%(+4.84)#72 | 5.8%(+5.12)#6,280 |
| 73. | 32124 | 10.9% | 6.1%(+4.84)#73 | 5.8%(+5.11)#6,288 |
| 74. | 34449 | 10.9% | 6.1%(+4.79)#74 | 5.8%(+5.07)#6,324 |
| 75. | 32118 | 10.9% | 6.1%(+4.78)#75 | 5.8%(+5.05)#6,337 |
| 76. | 34241 | 10.8% | 6.1%(+4.76)#76 | 5.8%(+5.03)#6,354 |
| 77. | 33043 | 10.8% | 6.1%(+4.72)#77 | 5.8%(+5.00)#6,402 |
| 78. | 33957 | 10.7% | 6.1%(+4.65)#78 | 5.8%(+4.93)#6,492 |
| 79. | 34432 | 10.7% | 6.1%(+4.65)#79 | 5.8%(+4.93)#6,495 |
| 80. | 32963 | 10.7% | 6.1%(+4.61)#80 | 5.8%(+4.88)#6,543 |
| 81. | 34242 | 10.7% | 6.1%(+4.58)#81 | 5.8%(+4.85)#6,586 |
| 82. | 32459 | 10.6% | 6.1%(+4.50)#82 | 5.8%(+4.77)#6,664 |
| 83. | 32732 | 10.6% | 6.1%(+4.48)#83 | 5.8%(+4.76)#6,684 |
| 84. | 33483 | 10.6% | 6.1%(+4.47)#84 | 5.8%(+4.75)#6,699 |
| 85. | 33767 | 10.6% | 6.1%(+4.47)#85 | 5.8%(+4.74)#6,707 |
| 86. | 34114 | 10.5% | 6.1%(+4.46)#86 | 5.8%(+4.73)#6,716 |
| 87. | 33473 | 10.5% | 6.1%(+4.43)#87 | 5.8%(+4.70)#6,759 |
| 88. | 33160 | 10.5% | 6.1%(+4.42)#88 | 5.8%(+4.70)#6,761 |
| 89. | 33149 | 10.5% | 6.1%(+4.40)#89 | 5.8%(+4.67)#6,784 |
| 90. | 32430 | 10.4% | 6.1%(+4.33)#90 | 5.8%(+4.60)#6,876 |
| 91. | 33540 | 10.3% | 6.1%(+4.25)#91 | 5.8%(+4.53)#6,954 |
| 92. | 33765 | 10.3% | 6.1%(+4.25)#92 | 5.8%(+4.52)#6,965 |
| 93. | 34428 | 10.3% | 6.1%(+4.22)#93 | 5.8%(+4.50)#6,985 |
| 94. | 32460 | 10.3% | 6.1%(+4.19)#94 | 5.8%(+4.46)#7,034 |
| 95. | 33126 | 10.3% | 6.1%(+4.17)#95 | 5.8%(+4.44)#7,058 |
| 96. | 33122 | 10.2% | 6.1%(+4.13)#96 | 5.8%(+4.41)#7,099 |
| 97. | 32466 | 10.2% | 6.1%(+4.13)#97 | 5.8%(+4.40)#7,107 |
| 98. | 33168 | 10.2% | 6.1%(+4.07)#98 | 5.8%(+4.34)#7,168 |
| 99. | 32949 | 10.1% | 6.1%(+4.05)#99 | 5.8%(+4.33)#7,186 |
| 100. | 33428 | 10.1% | 6.1%(+3.96)#100 | 5.8%(+4.24)#7,294 |
Common Questions
What are the Top 10 Zip Codes with the Highest Percentage of Self-Employed / Not Incorporated in Florida?
Top 10 Zip Codes with the Highest Percentage of Self-Employed / Not Incorporated in Florida are:
What zip code has the Highest Percentage of Self-Employed / Not Incorporated in Florida?
33858 has the Highest Percentage of Self-Employed / Not Incorporated in Florida with 100.0%.
What is the Percentage of Self-Employed / Not Incorporated in the State of Florida?
Percentage of Self-Employed / Not Incorporated in Florida is 6.1%.
What is the Percentage of Self-Employed / Not Incorporated in the United States?
Percentage of Self-Employed / Not Incorporated in the United States is 5.8%.