Roseland, FL Map & Demographics
Roseland Map
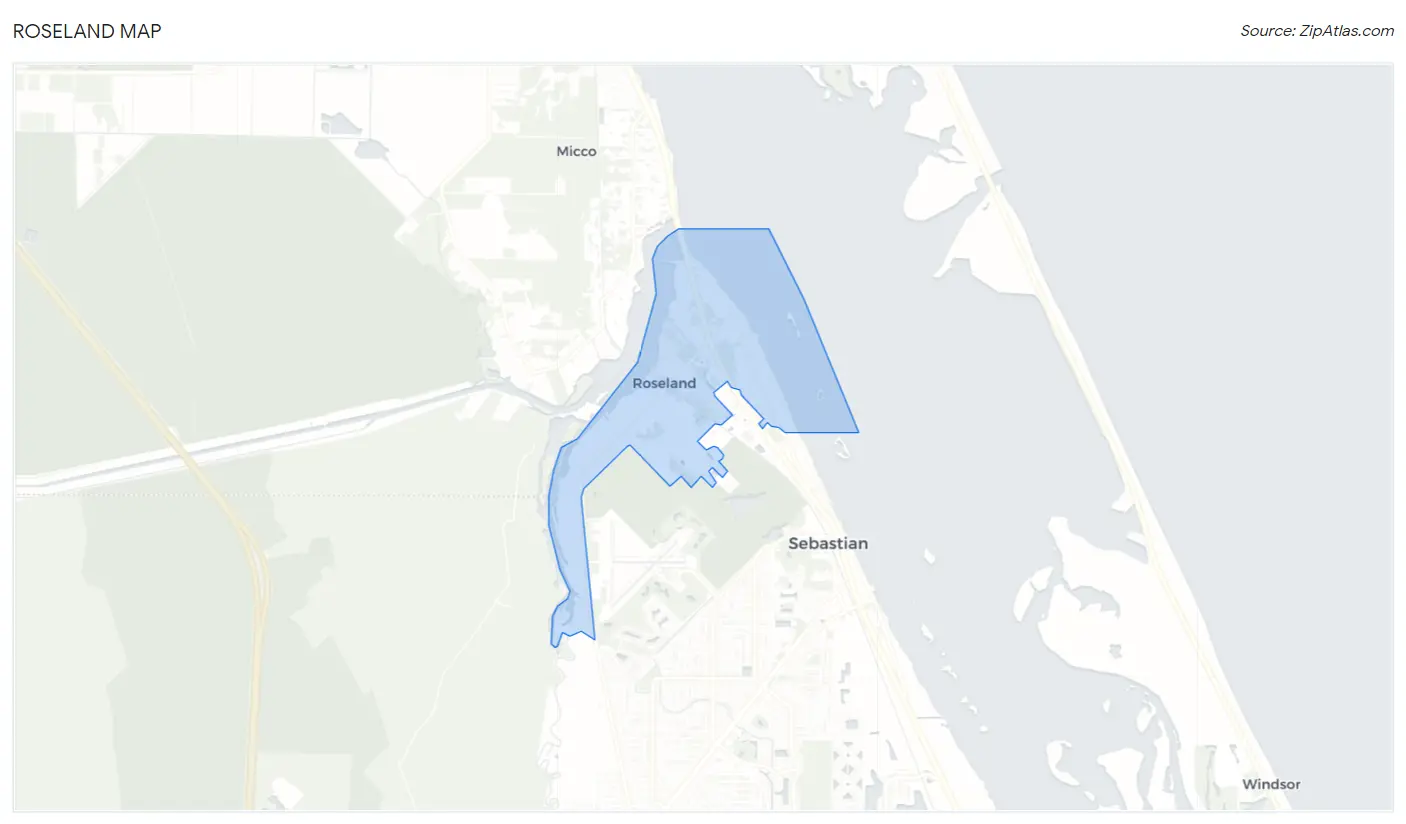
Roseland Overview
$40,186
PER CAPITA INCOME
$63,750
AVG FAMILY INCOME
$62,520
AVG HOUSEHOLD INCOME
0.33
INEQUALITY / GINI INDEX
1,377
TOTAL POPULATION
639
MALE POPULATION
738
FEMALE POPULATION
86.59
MALES / 100 FEMALES
115.49
FEMALES / 100 MALES
63.2
MEDIAN AGE
2.4
AVG FAMILY SIZE
2.1
AVG HOUSEHOLD SIZE
666
LABOR FORCE [ PEOPLE ]
50.3%
PERCENT IN LABOR FORCE
Roseland Area Codes
Income in Roseland
Income Overview in Roseland
Per Capita Income in Roseland is $40,186, while median incomes of families and households are $63,750 and $62,520 respectively.
| Characteristic | Number | Measure |
| Per Capita Income | 1,377 | $40,186 |
| Median Family Income | 423 | $63,750 |
| Mean Family Income | 423 | $87,683 |
| Median Household Income | 657 | $62,520 |
| Mean Household Income | 657 | $77,665 |
| Income Deficit | 423 | $0 |
| Wage / Income Gap (%) | 1,377 | 0.00% |
| Wage / Income Gap ($) | 1,377 | 100.00¢ per $1 |
| Gini / Inequality Index | 1,377 | 0.33 |
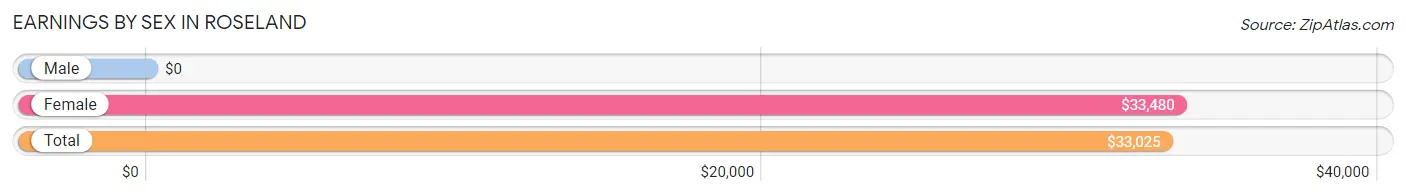
Earnings by Sex in Roseland
| Sex | Number | Average Earnings |
| Male | 257 (35.8%) | $0 |
| Female | 461 (64.2%) | $33,480 |
| Total | 718 (100.0%) | $33,025 |
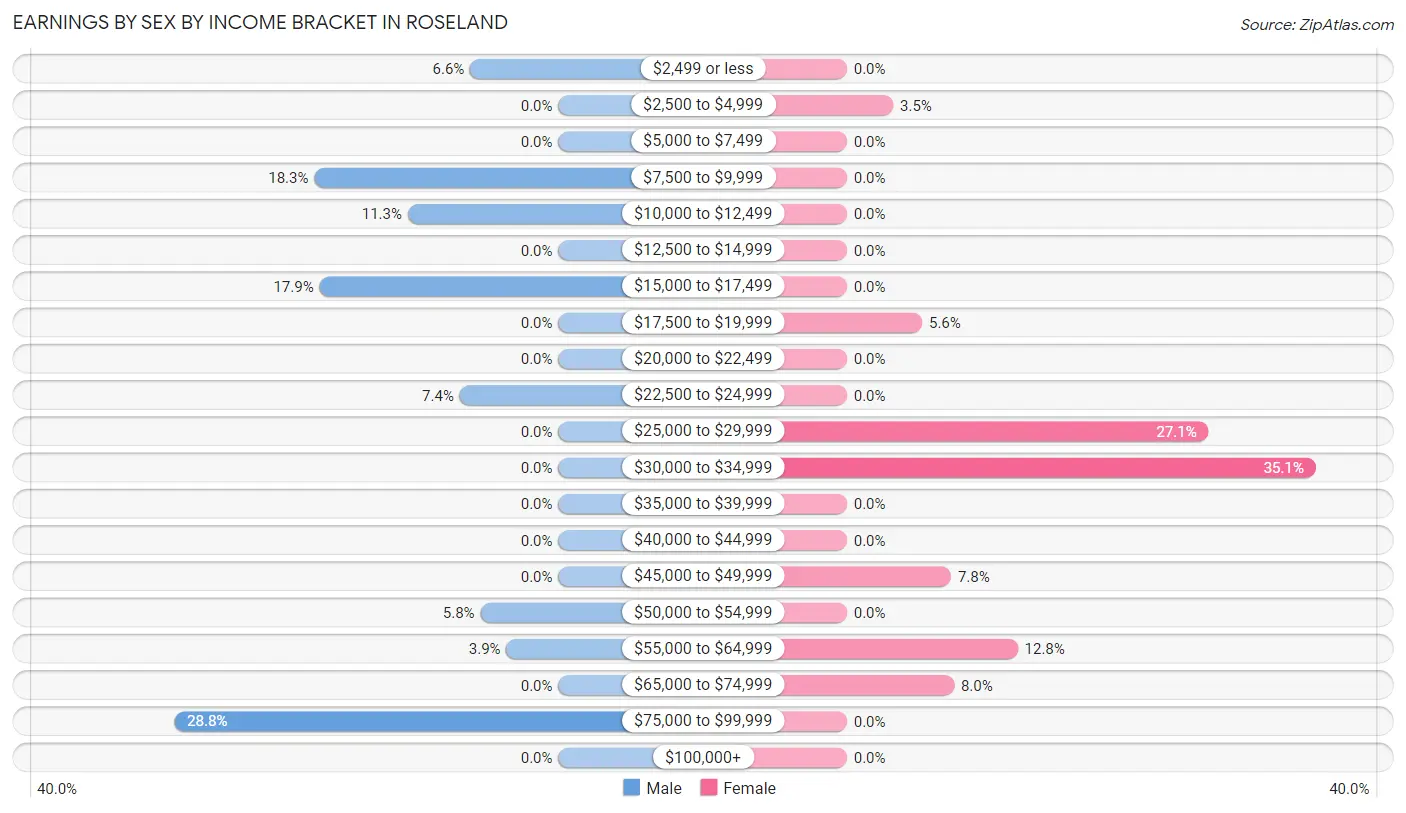
Earnings by Sex by Income Bracket in Roseland
The most common earnings brackets in Roseland are $75,000 to $99,999 for men (74 | 28.8%) and $30,000 to $34,999 for women (162 | 35.1%).
| Income | Male | Female |
| $2,499 or less | 17 (6.6%) | 0 (0.0%) |
| $2,500 to $4,999 | 0 (0.0%) | 16 (3.5%) |
| $5,000 to $7,499 | 0 (0.0%) | 0 (0.0%) |
| $7,500 to $9,999 | 47 (18.3%) | 0 (0.0%) |
| $10,000 to $12,499 | 29 (11.3%) | 0 (0.0%) |
| $12,500 to $14,999 | 0 (0.0%) | 0 (0.0%) |
| $15,000 to $17,499 | 46 (17.9%) | 0 (0.0%) |
| $17,500 to $19,999 | 0 (0.0%) | 26 (5.6%) |
| $20,000 to $22,499 | 0 (0.0%) | 0 (0.0%) |
| $22,500 to $24,999 | 19 (7.4%) | 0 (0.0%) |
| $25,000 to $29,999 | 0 (0.0%) | 125 (27.1%) |
| $30,000 to $34,999 | 0 (0.0%) | 162 (35.1%) |
| $35,000 to $39,999 | 0 (0.0%) | 0 (0.0%) |
| $40,000 to $44,999 | 0 (0.0%) | 0 (0.0%) |
| $45,000 to $49,999 | 0 (0.0%) | 36 (7.8%) |
| $50,000 to $54,999 | 15 (5.8%) | 0 (0.0%) |
| $55,000 to $64,999 | 10 (3.9%) | 59 (12.8%) |
| $65,000 to $74,999 | 0 (0.0%) | 37 (8.0%) |
| $75,000 to $99,999 | 74 (28.8%) | 0 (0.0%) |
| $100,000+ | 0 (0.0%) | 0 (0.0%) |
| Total | 257 (100.0%) | 461 (100.0%) |
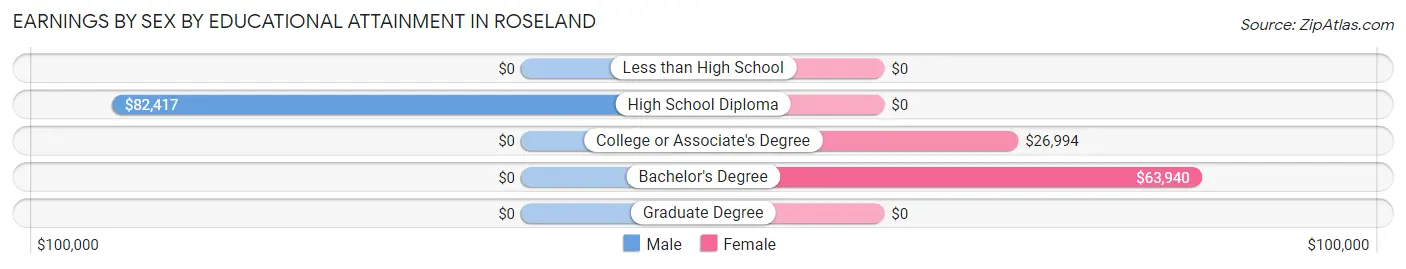
Earnings by Sex by Educational Attainment in Roseland
| Educational Attainment | Male Income | Female Income |
| Less than High School | - | - |
| High School Diploma | $82,417 | $0 |
| College or Associate's Degree | - | - |
| Bachelor's Degree | - | - |
| Graduate Degree | - | - |
| Total | - | - |
Family Income in Roseland
Family Income Brackets in Roseland
According to the Roseland family income data, there are 204 families falling into the $50,000 to $74,999 income range, which is the most common income bracket and makes up 48.2% of all families.
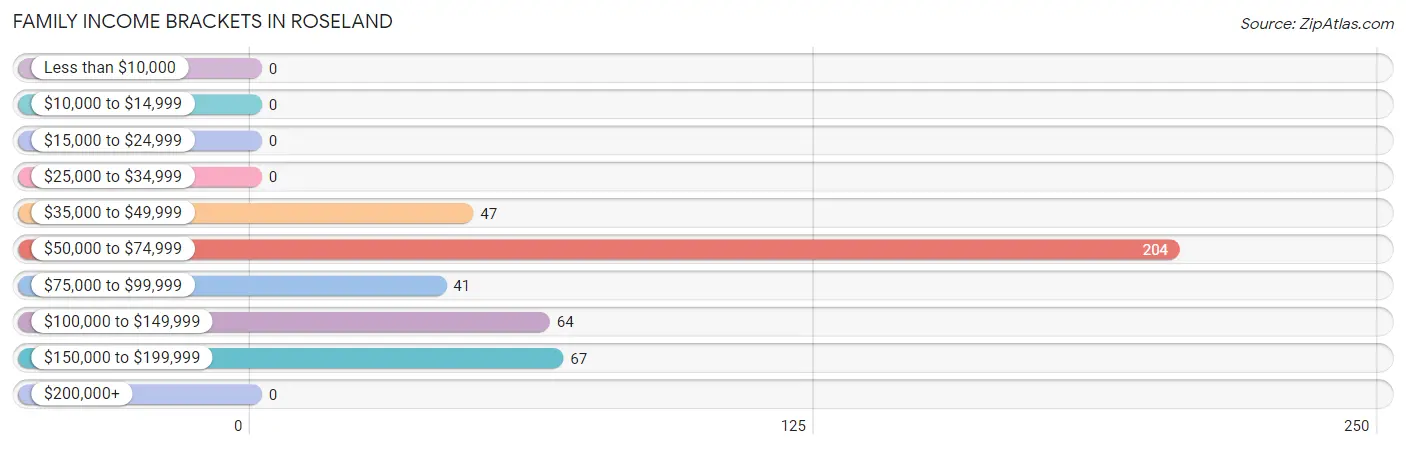
| Income Bracket | # Families | % Families |
| Less than $10,000 | 0 | 0.0% |
| $10,000 to $14,999 | 0 | 0.0% |
| $15,000 to $24,999 | 0 | 0.0% |
| $25,000 to $34,999 | 0 | 0.0% |
| $35,000 to $49,999 | 47 | 11.1% |
| $50,000 to $74,999 | 204 | 48.2% |
| $75,000 to $99,999 | 41 | 9.7% |
| $100,000 to $149,999 | 64 | 15.1% |
| $150,000 to $199,999 | 67 | 15.8% |
| $200,000+ | 0 | 0.0% |
Family Income by Famaliy Size in Roseland
2-person families (401 | 94.8%) account for the highest median family income in Roseland with $62,202 per family, while 2-person families (401 | 94.8%) have the highest median income of $31,101 per family member.
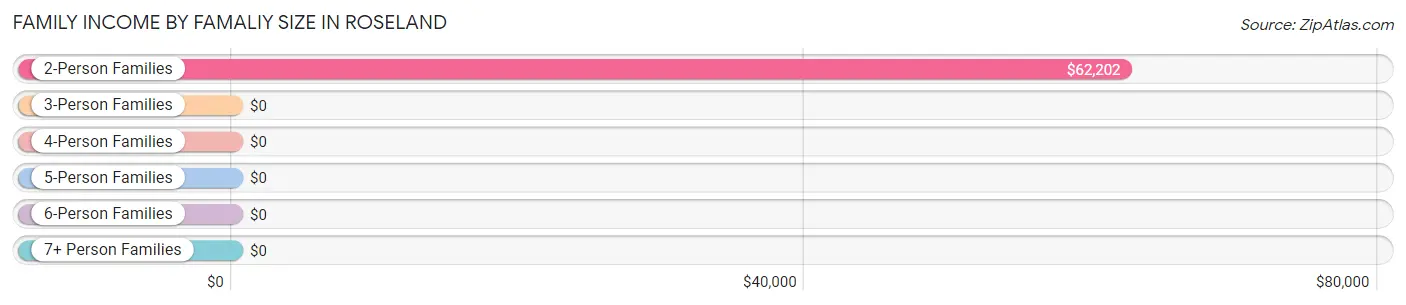
| Income Bracket | # Families | Median Income |
| 2-Person Families | 401 (94.8%) | $62,202 |
| 3-Person Families | 13 (3.1%) | $0 |
| 4-Person Families | 0 (0.0%) | $0 |
| 5-Person Families | 0 (0.0%) | $0 |
| 6-Person Families | 0 (0.0%) | $0 |
| 7+ Person Families | 9 (2.1%) | $0 |
| Total | 423 (100.0%) | $63,750 |
Family Income by Number of Earners in Roseland
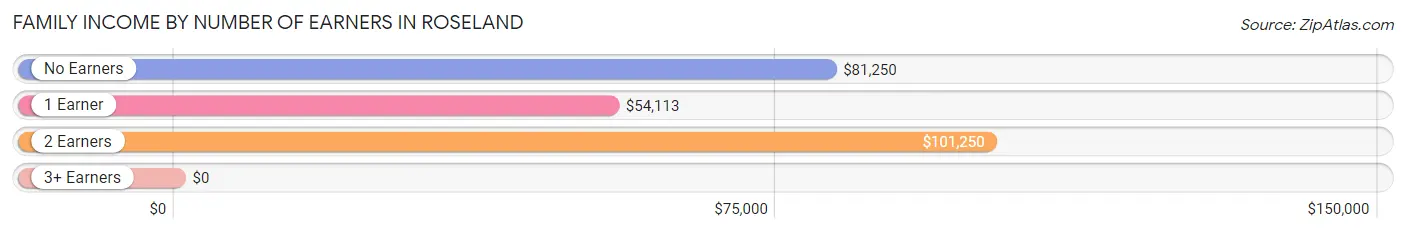
| Number of Earners | # Families | Median Income |
| No Earners | 150 (35.5%) | $81,250 |
| 1 Earner | 179 (42.3%) | $54,113 |
| 2 Earners | 85 (20.1%) | $101,250 |
| 3+ Earners | 9 (2.1%) | $0 |
| Total | 423 (100.0%) | $63,750 |
Household Income in Roseland
Household Income Brackets in Roseland
With 250 households falling in the category, the $50,000 to $74,999 income range is the most frequent in Roseland, accounting for 38.1% of all households.
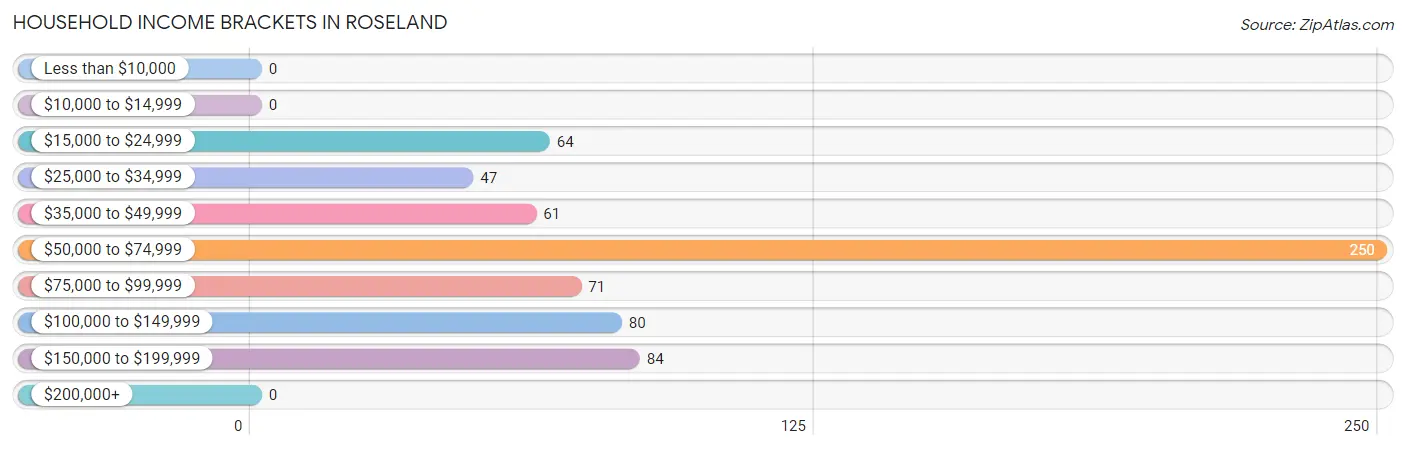
| Income Bracket | # Households | % Households |
| Less than $10,000 | 0 | 0.0% |
| $10,000 to $14,999 | 0 | 0.0% |
| $15,000 to $24,999 | 64 | 9.7% |
| $25,000 to $34,999 | 47 | 7.2% |
| $35,000 to $49,999 | 61 | 9.3% |
| $50,000 to $74,999 | 250 | 38.1% |
| $75,000 to $99,999 | 71 | 10.8% |
| $100,000 to $149,999 | 80 | 12.2% |
| $150,000 to $199,999 | 84 | 12.8% |
| $200,000+ | 0 | 0.0% |
Household Income by Householder Age in Roseland
The median household income in Roseland is $62,520, with the highest median household income of $96,333 found in the 45 to 64 years age bracket for the primary householder. A total of 146 households (22.2%) fall into this category.
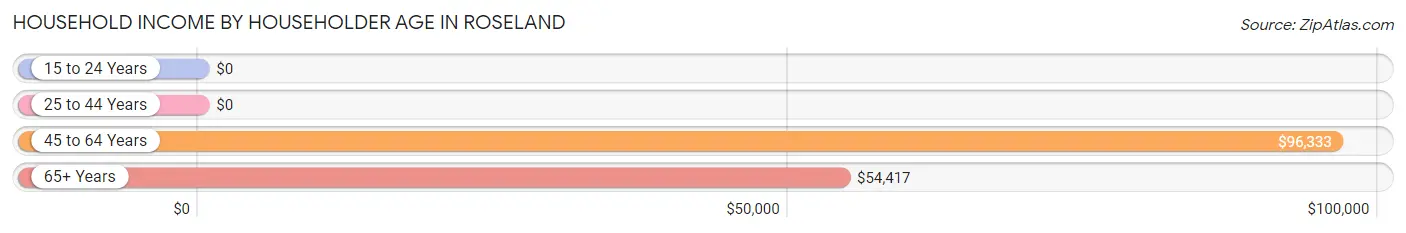
| Income Bracket | # Households | Median Income |
| 15 to 24 Years | 0 (0.0%) | $0 |
| 25 to 44 Years | 92 (14.0%) | $0 |
| 45 to 64 Years | 146 (22.2%) | $96,333 |
| 65+ Years | 419 (63.8%) | $54,417 |
| Total | 657 (100.0%) | $62,520 |
Poverty in Roseland
Income Below Poverty by Sex and Age in Roseland
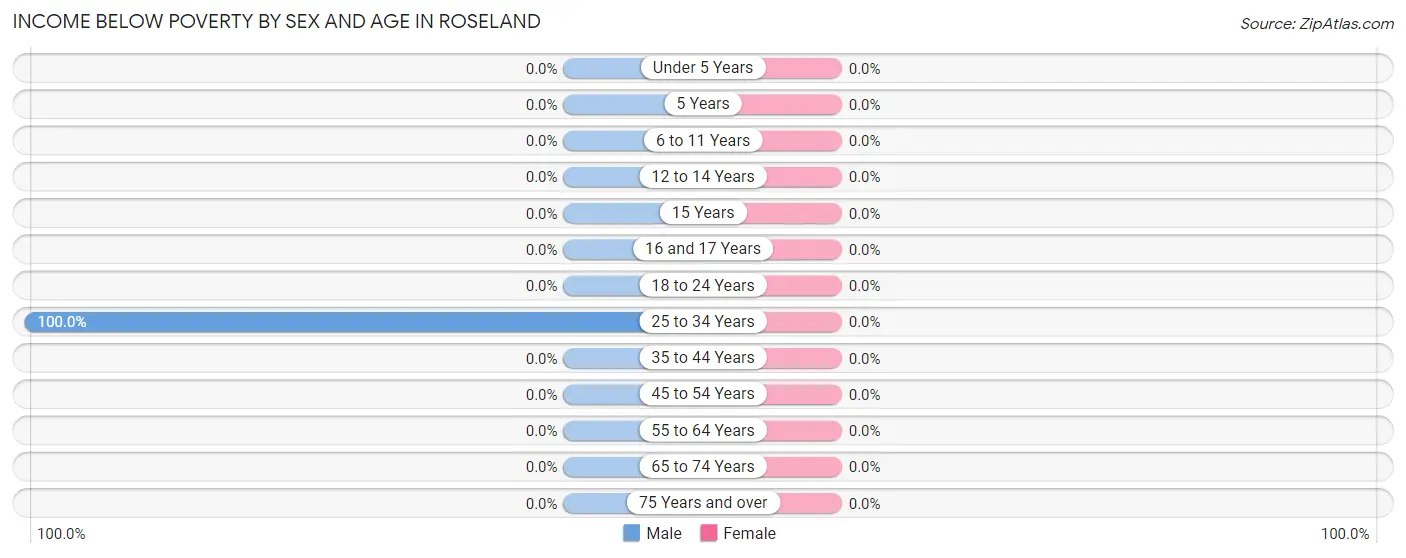
| Age Bracket | Male | Female |
| Under 5 Years | 0 (0.0%) | 0 (0.0%) |
| 5 Years | 0 (0.0%) | 0 (0.0%) |
| 6 to 11 Years | 0 (0.0%) | 0 (0.0%) |
| 12 to 14 Years | 0 (0.0%) | 0 (0.0%) |
| 15 Years | 0 (0.0%) | 0 (0.0%) |
| 16 and 17 Years | 0 (0.0%) | 0 (0.0%) |
| 18 to 24 Years | 0 (0.0%) | 0 (0.0%) |
| 25 to 34 Years | 47 (100.0%) | 0 (0.0%) |
| 35 to 44 Years | 0 (0.0%) | 0 (0.0%) |
| 45 to 54 Years | 0 (0.0%) | 0 (0.0%) |
| 55 to 64 Years | 0 (0.0%) | 0 (0.0%) |
| 65 to 74 Years | 0 (0.0%) | 0 (0.0%) |
| 75 Years and over | 0 (0.0%) | 0 (0.0%) |
| Total | 47 (7.4%) | 0 (0.0%) |
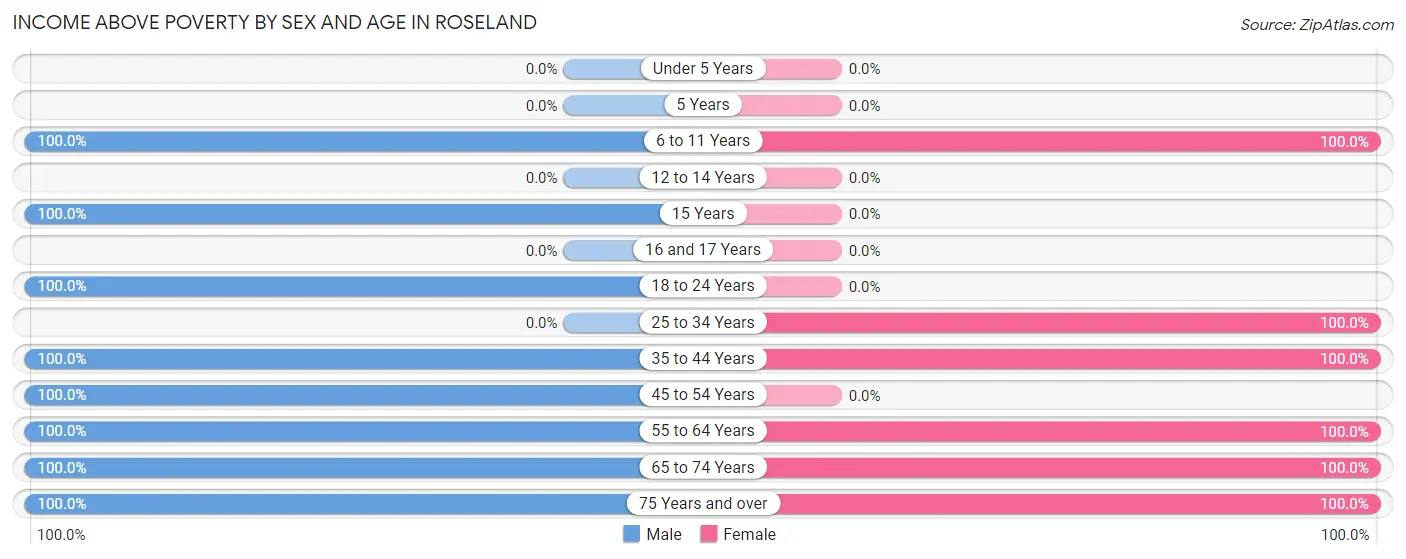
Income Above Poverty by Sex and Age in Roseland
According to the poverty statistics in Roseland, males aged 6 to 11 years and females aged 6 to 11 years are the age groups that are most secure financially, with 100.0% of males and 100.0% of females in these age groups living above the poverty line.
| Age Bracket | Male | Female |
| Under 5 Years | 0 (0.0%) | 0 (0.0%) |
| 5 Years | 0 (0.0%) | 0 (0.0%) |
| 6 to 11 Years | 27 (100.0%) | 11 (100.0%) |
| 12 to 14 Years | 0 (0.0%) | 0 (0.0%) |
| 15 Years | 14 (100.0%) | 0 (0.0%) |
| 16 and 17 Years | 0 (0.0%) | 0 (0.0%) |
| 18 to 24 Years | 29 (100.0%) | 0 (0.0%) |
| 25 to 34 Years | 0 (0.0%) | 107 (100.0%) |
| 35 to 44 Years | 52 (100.0%) | 45 (100.0%) |
| 45 to 54 Years | 43 (100.0%) | 0 (0.0%) |
| 55 to 64 Years | 89 (100.0%) | 328 (100.0%) |
| 65 to 74 Years | 248 (100.0%) | 135 (100.0%) |
| 75 Years and over | 90 (100.0%) | 108 (100.0%) |
| Total | 592 (92.6%) | 734 (100.0%) |
Income Below Poverty Among Married-Couple Families in Roseland
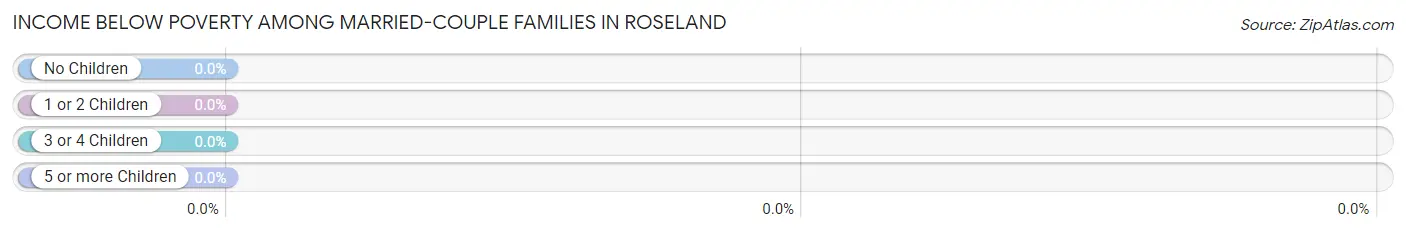
| Children | Above Poverty | Below Poverty |
| No Children | 368 (100.0%) | 0 (0.0%) |
| 1 or 2 Children | 0 (0.0%) | 0 (0.0%) |
| 3 or 4 Children | 9 (100.0%) | 0 (0.0%) |
| 5 or more Children | 0 (0.0%) | 0 (0.0%) |
| Total | 377 (100.0%) | 0 (0.0%) |
Income Below Poverty Among Single-Parent Households in Roseland
| Children | Single Father | Single Mother |
| No Children | 0 (0.0%) | 0 (0.0%) |
| 1 or 2 Children | 0 (0.0%) | 0 (0.0%) |
| 3 or 4 Children | 0 (0.0%) | 0 (0.0%) |
| 5 or more Children | 0 (0.0%) | 0 (0.0%) |
| Total | 0 (0.0%) | 0 (0.0%) |
Income Below Poverty Among Married-Couple vs Single-Parent Households in Roseland
| Children | Married-Couple Families | Single-Parent Households |
| No Children | 0 (0.0%) | 0 (0.0%) |
| 1 or 2 Children | 0 (0.0%) | 0 (0.0%) |
| 3 or 4 Children | 0 (0.0%) | 0 (0.0%) |
| 5 or more Children | 0 (0.0%) | 0 (0.0%) |
| Total | 0 (0.0%) | 0 (0.0%) |
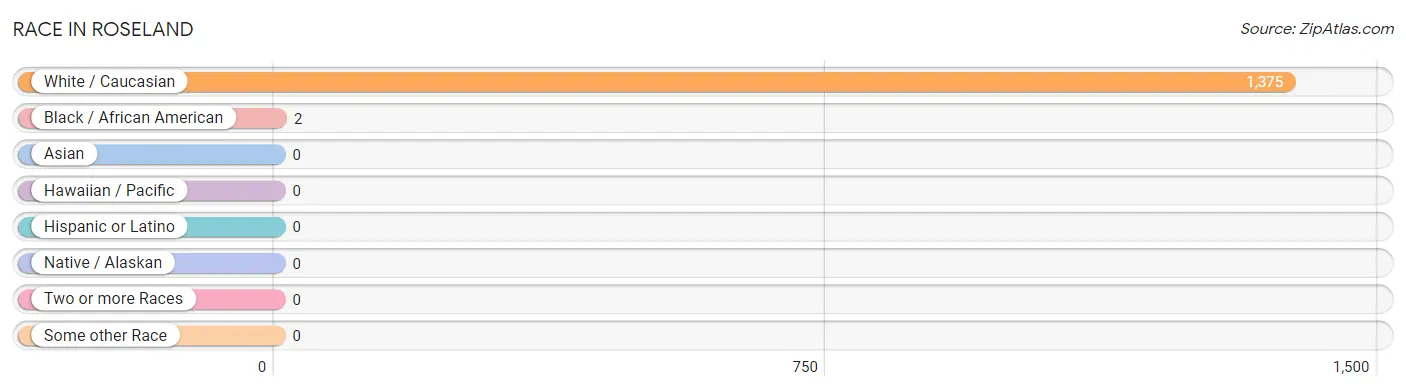
Race in Roseland
The most populous races in Roseland are White / Caucasian (1,375 | 99.9%), and Black / African American (2 | 0.2%).
| Race | # Population | % Population |
| Asian | 0 | 0.0% |
| Black / African American | 2 | 0.2% |
| Hawaiian / Pacific | 0 | 0.0% |
| Hispanic or Latino | 0 | 0.0% |
| Native / Alaskan | 0 | 0.0% |
| White / Caucasian | 1,375 | 99.9% |
| Two or more Races | 0 | 0.0% |
| Some other Race | 0 | 0.0% |
| Total | 1,377 | 100.0% |
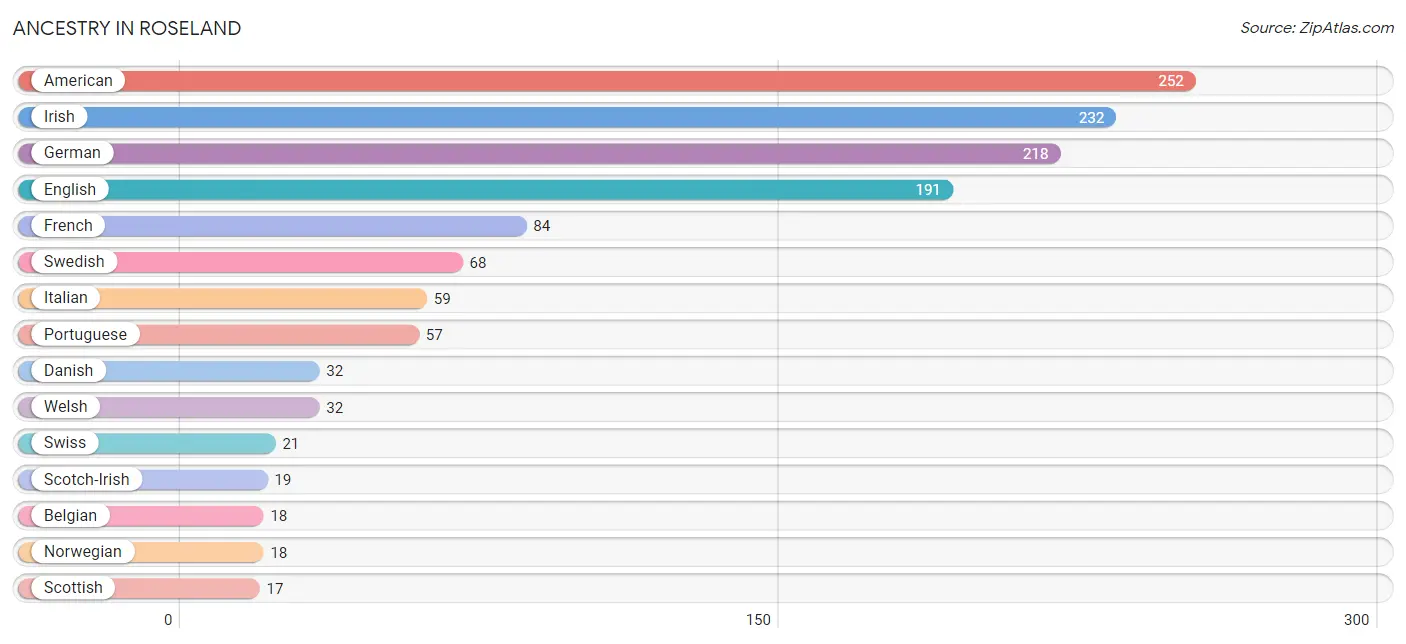
Ancestry in Roseland
The most populous ancestries reported in Roseland are American (252 | 18.3%), Irish (232 | 16.9%), German (218 | 15.8%), English (191 | 13.9%), and French (84 | 6.1%), together accounting for 71.0% of all Roseland residents.
| Ancestry | # Population | % Population |
| American | 252 | 18.3% |
| Armenian | 16 | 1.2% |
| Belgian | 18 | 1.3% |
| British | 9 | 0.6% |
| Danish | 32 | 2.3% |
| English | 191 | 13.9% |
| French | 84 | 6.1% |
| German | 218 | 15.8% |
| Haitian | 2 | 0.2% |
| Irish | 232 | 16.9% |
| Italian | 59 | 4.3% |
| Norwegian | 18 | 1.3% |
| Portuguese | 57 | 4.1% |
| Scotch-Irish | 19 | 1.4% |
| Scottish | 17 | 1.2% |
| Swedish | 68 | 4.9% |
| Swiss | 21 | 1.5% |
| Welsh | 32 | 2.3% | View All 18 Rows |
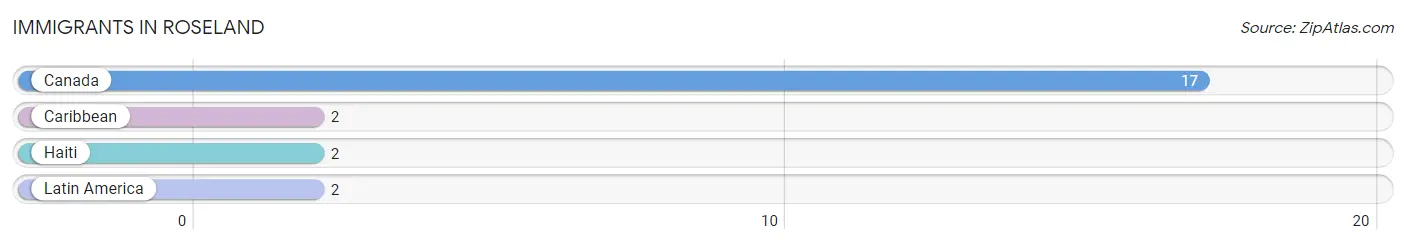
Immigrants in Roseland
The most numerous immigrant groups reported in Roseland came from Canada (17 | 1.2%), Caribbean (2 | 0.2%), Haiti (2 | 0.2%), and Latin America (2 | 0.2%), together accounting for 1.7% of all Roseland residents.
| Immigration Origin | # Population | % Population |
| Canada | 17 | 1.2% |
| Caribbean | 2 | 0.2% |
| Haiti | 2 | 0.2% |
| Latin America | 2 | 0.2% | View All 4 Rows |
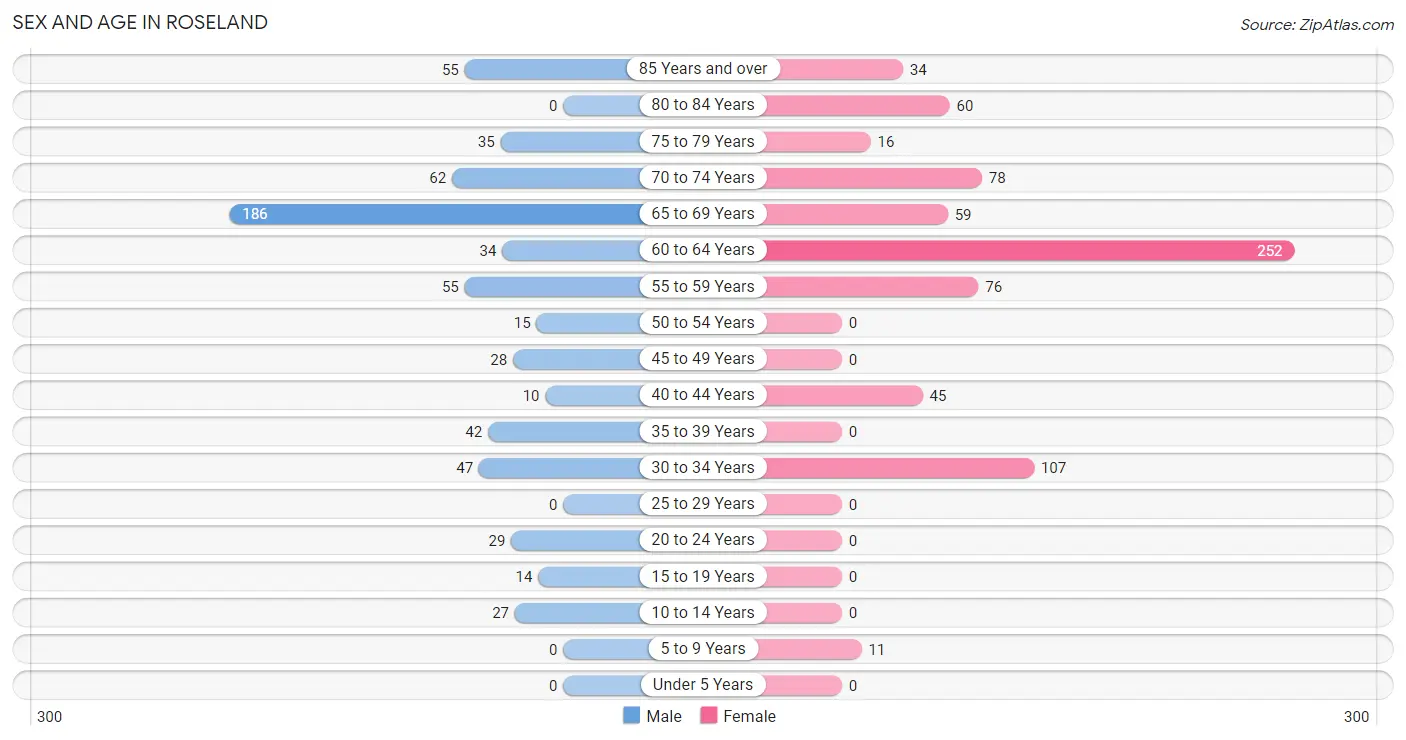
Sex and Age in Roseland
Sex and Age in Roseland
The most populous age groups in Roseland are 65 to 69 Years (186 | 29.1%) for men and 60 to 64 Years (252 | 34.2%) for women.
| Age Bracket | Male | Female |
| Under 5 Years | 0 (0.0%) | 0 (0.0%) |
| 5 to 9 Years | 0 (0.0%) | 11 (1.5%) |
| 10 to 14 Years | 27 (4.2%) | 0 (0.0%) |
| 15 to 19 Years | 14 (2.2%) | 0 (0.0%) |
| 20 to 24 Years | 29 (4.5%) | 0 (0.0%) |
| 25 to 29 Years | 0 (0.0%) | 0 (0.0%) |
| 30 to 34 Years | 47 (7.4%) | 107 (14.5%) |
| 35 to 39 Years | 42 (6.6%) | 0 (0.0%) |
| 40 to 44 Years | 10 (1.6%) | 45 (6.1%) |
| 45 to 49 Years | 28 (4.4%) | 0 (0.0%) |
| 50 to 54 Years | 15 (2.4%) | 0 (0.0%) |
| 55 to 59 Years | 55 (8.6%) | 76 (10.3%) |
| 60 to 64 Years | 34 (5.3%) | 252 (34.2%) |
| 65 to 69 Years | 186 (29.1%) | 59 (8.0%) |
| 70 to 74 Years | 62 (9.7%) | 78 (10.6%) |
| 75 to 79 Years | 35 (5.5%) | 16 (2.2%) |
| 80 to 84 Years | 0 (0.0%) | 60 (8.1%) |
| 85 Years and over | 55 (8.6%) | 34 (4.6%) |
| Total | 639 (100.0%) | 738 (100.0%) |
Families and Households in Roseland
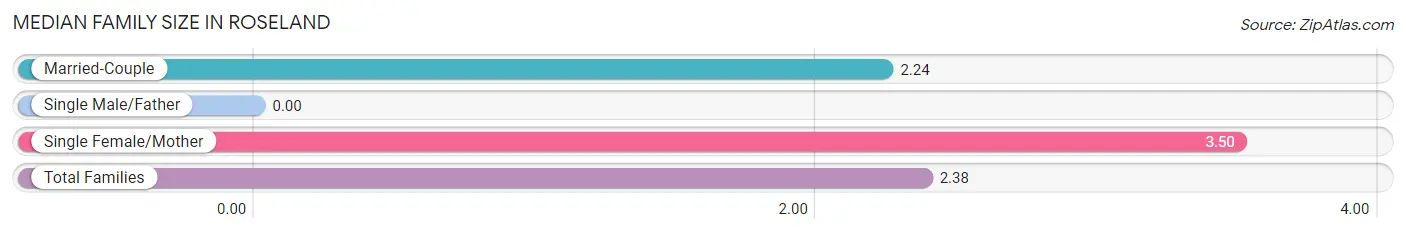
Median Family Size in Roseland
| Family Type | # Families | Family Size |
| Married-Couple | 377 (89.1%) | 2.24 |
| Single Male/Father | 0 (0.0%) | - |
| Single Female/Mother | 46 (10.9%) | 3.50 |
| Total Families | 423 (100.0%) | 2.38 |
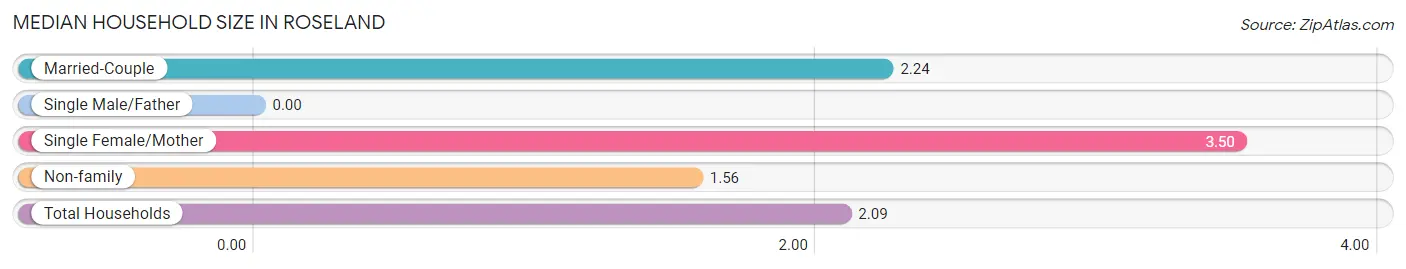
Median Household Size in Roseland
| Household Type | # Households | Household Size |
| Married-Couple | 377 (57.4%) | 2.24 |
| Single Male/Father | 0 (0.0%) | - |
| Single Female/Mother | 46 (7.0%) | 3.50 |
| Non-family | 234 (35.6%) | 1.56 |
| Total Households | 657 (100.0%) | 2.09 |
Household Size by Marriage Status in Roseland
Out of a total of 657 households in Roseland, 423 (64.4%) are family households, while 234 (35.6%) are nonfamily households. The most numerous type of family households are 2-person households, comprising 401, and the most common type of nonfamily households are 1-person households, comprising 155.
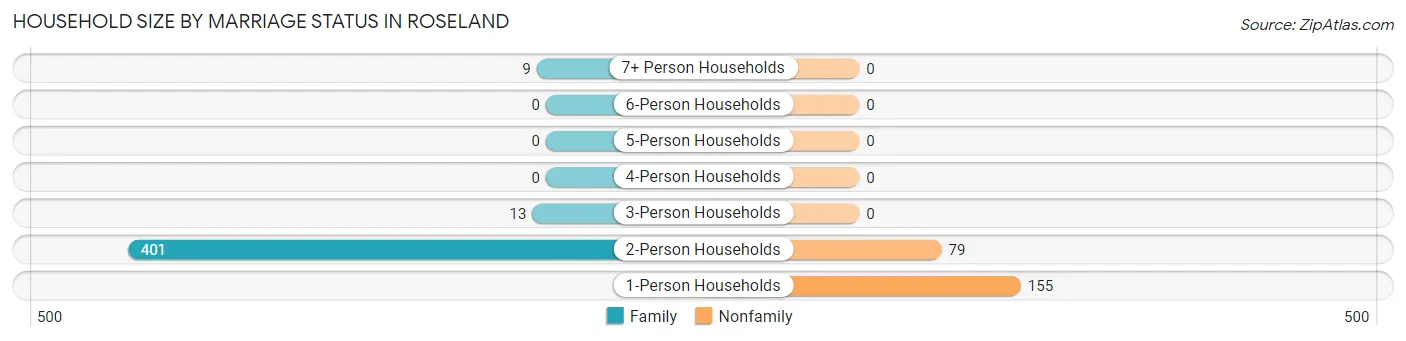
| Household Size | Family Households | Nonfamily Households |
| 1-Person Households | - | 155 (23.6%) |
| 2-Person Households | 401 (61.0%) | 79 (12.0%) |
| 3-Person Households | 13 (2.0%) | 0 (0.0%) |
| 4-Person Households | 0 (0.0%) | 0 (0.0%) |
| 5-Person Households | 0 (0.0%) | 0 (0.0%) |
| 6-Person Households | 0 (0.0%) | 0 (0.0%) |
| 7+ Person Households | 9 (1.4%) | 0 (0.0%) |
| Total | 423 (64.4%) | 234 (35.6%) |
Female Fertility in Roseland
Fertility by Age in Roseland
| Age Bracket | Women with Births | Births / 1,000 Women |
| 15 to 19 years | 0 (0.0%) | 0.0 |
| 20 to 34 years | 0 (0.0%) | 0.0 |
| 35 to 50 years | 0 (0.0%) | 0.0 |
| Total | 0 (0.0%) | 0.0 |
Fertility by Age by Marriage Status in Roseland
| Age Bracket | Married | Unmarried |
| 15 to 19 years | 0 (0.0%) | 0 (0.0%) |
| 20 to 34 years | 0 (0.0%) | 0 (0.0%) |
| 35 to 50 years | 0 (0.0%) | 0 (0.0%) |
| Total | 0 (0.0%) | 0 (0.0%) |
Fertility by Education in Roseland
| Educational Attainment | Women with Births | Births / 1,000 Women |
| Less than High School | 0 (0.0%) | 0.0 |
| High School Diploma | 0 (0.0%) | 0.0 |
| College or Associate's Degree | 0 (0.0%) | 0.0 |
| Bachelor's Degree | 0 (0.0%) | 0.0 |
| Graduate Degree | 0 (0.0%) | 0.0 |
| Total | 0 (0.0%) | 0.0 |
Fertility by Education by Marriage Status in Roseland
| Educational Attainment | Married | Unmarried |
| Less than High School | 0 (0.0%) | 0 (0.0%) |
| High School Diploma | 0 (0.0%) | 0 (0.0%) |
| College or Associate's Degree | 0 (0.0%) | 0 (0.0%) |
| Bachelor's Degree | 0 (0.0%) | 0 (0.0%) |
| Graduate Degree | 0 (0.0%) | 0 (0.0%) |
| Total | 0 (0.0%) | 0 (0.0%) |
Employment Characteristics in Roseland
Employment by Class of Employer in Roseland
Among the 667 employed individuals in Roseland, private company employees (365 | 54.7%), self-employed (incorporated) (142 | 21.3%), and self-employed (not incorporated) (111 | 16.6%) make up the most common classes of employment.
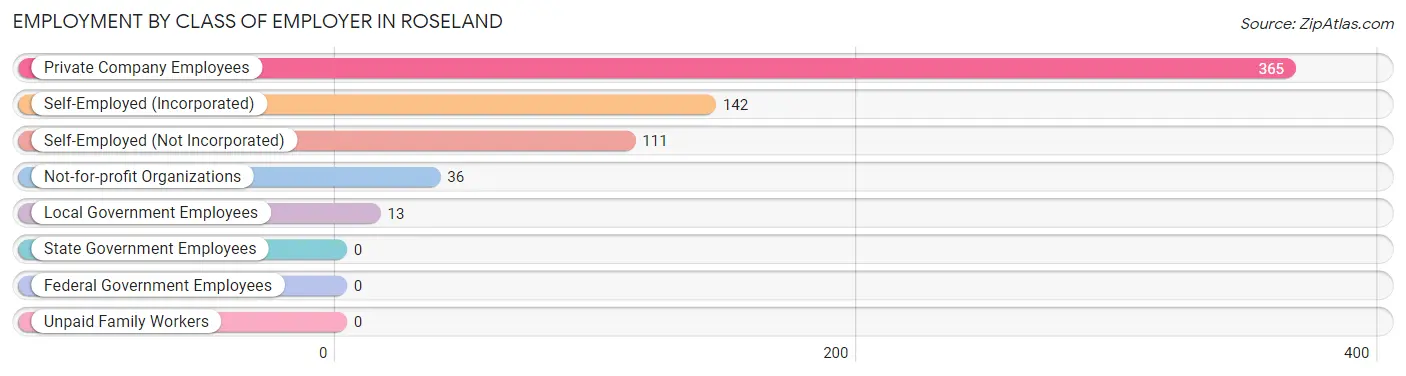
| Employer Class | # Employees | % Employees |
| Private Company Employees | 365 | 54.7% |
| Self-Employed (Incorporated) | 142 | 21.3% |
| Self-Employed (Not Incorporated) | 111 | 16.6% |
| Not-for-profit Organizations | 36 | 5.4% |
| Local Government Employees | 13 | 1.9% |
| State Government Employees | 0 | 0.0% |
| Federal Government Employees | 0 | 0.0% |
| Unpaid Family Workers | 0 | 0.0% |
| Total | 667 | 100.0% |
Employment Status by Age in Roseland
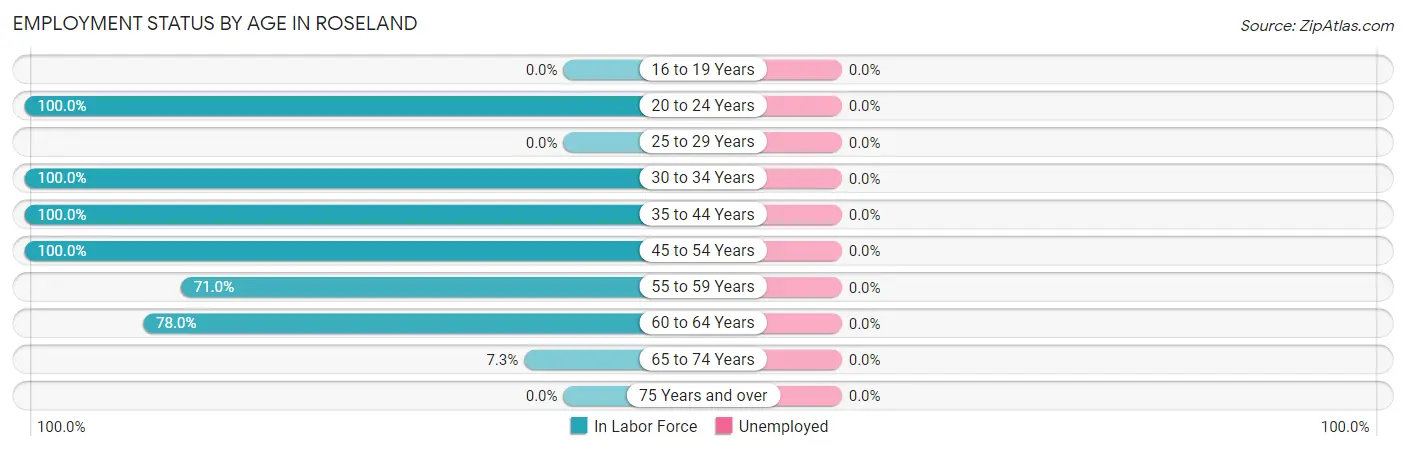
| Age Bracket | In Labor Force | Unemployed |
| 16 to 19 Years | 0 (0.0%) | 0 (0.0%) |
| 20 to 24 Years | 29 (100.0%) | 0 (0.0%) |
| 25 to 29 Years | 0 (0.0%) | 0 (0.0%) |
| 30 to 34 Years | 154 (100.0%) | 0 (0.0%) |
| 35 to 44 Years | 97 (100.0%) | 0 (0.0%) |
| 45 to 54 Years | 43 (100.0%) | 0 (0.0%) |
| 55 to 59 Years | 93 (71.0%) | 0 (0.0%) |
| 60 to 64 Years | 223 (78.0%) | 0 (0.0%) |
| 65 to 74 Years | 28 (7.3%) | 0 (0.0%) |
| 75 Years and over | 0 (0.0%) | 0 (0.0%) |
| Total | 666 (50.3%) | 0 (0.0%) |
Employment Status by Educational Attainment in Roseland
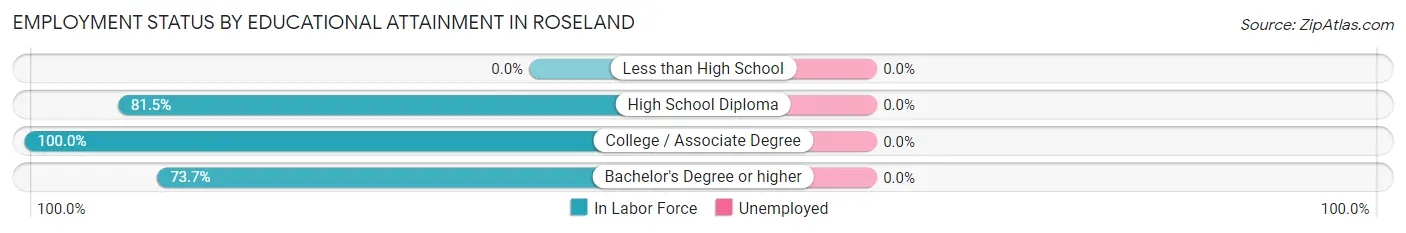
| Educational Attainment | In Labor Force | Unemployed |
| Less than High School | 0 (0.0%) | 0 (0.0%) |
| High School Diploma | 247 (81.5%) | 0 (0.0%) |
| College / Associate Degree | 279 (100.0%) | 0 (0.0%) |
| Bachelor's Degree or higher | 84 (73.7%) | 0 (0.0%) |
| Total | 610 (85.8%) | 0 (0.0%) |
Employment Occupations by Sex in Roseland
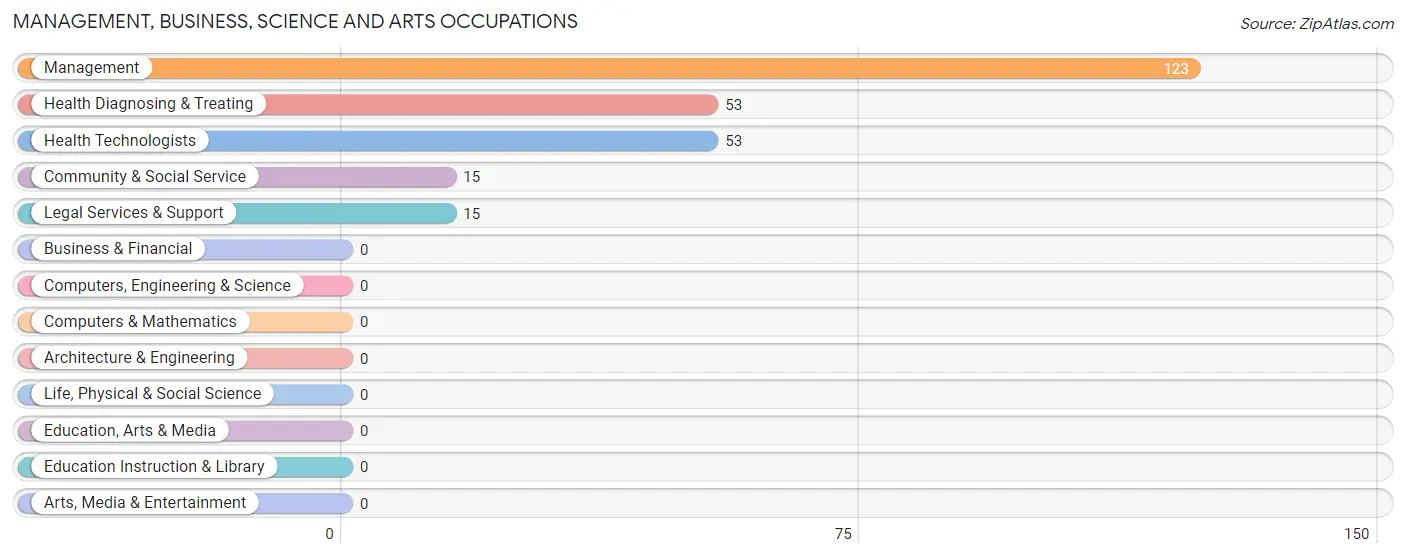
Management, Business, Science and Arts Occupations
The most common Management, Business, Science and Arts occupations in Roseland are Management (123 | 18.4%), Health Diagnosing & Treating (53 | 8.0%), Health Technologists (53 | 8.0%), Community & Social Service (15 | 2.2%), and Legal Services & Support (15 | 2.2%).
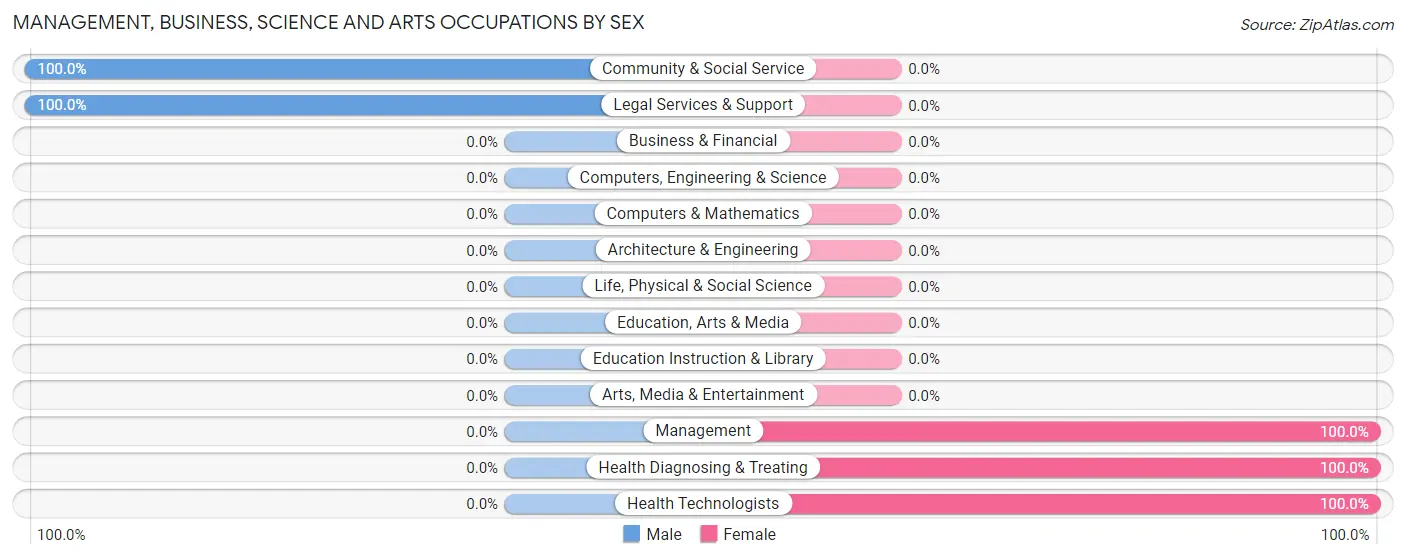
Management, Business, Science and Arts Occupations by Sex
Within the Management, Business, Science and Arts occupations in Roseland, the most male-oriented occupations are Community & Social Service (100.0%), and Legal Services & Support (100.0%), while the most female-oriented occupations are Management (100.0%), Health Diagnosing & Treating (100.0%), and Health Technologists (100.0%).
| Occupation | Male | Female |
| Management | 0 (0.0%) | 123 (100.0%) |
| Business & Financial | 0 (0.0%) | 0 (0.0%) |
| Computers, Engineering & Science | 0 (0.0%) | 0 (0.0%) |
| Computers & Mathematics | 0 (0.0%) | 0 (0.0%) |
| Architecture & Engineering | 0 (0.0%) | 0 (0.0%) |
| Life, Physical & Social Science | 0 (0.0%) | 0 (0.0%) |
| Community & Social Service | 15 (100.0%) | 0 (0.0%) |
| Education, Arts & Media | 0 (0.0%) | 0 (0.0%) |
| Legal Services & Support | 15 (100.0%) | 0 (0.0%) |
| Education Instruction & Library | 0 (0.0%) | 0 (0.0%) |
| Arts, Media & Entertainment | 0 (0.0%) | 0 (0.0%) |
| Health Diagnosing & Treating | 0 (0.0%) | 53 (100.0%) |
| Health Technologists | 0 (0.0%) | 53 (100.0%) |
| Total (Category) | 15 (7.9%) | 176 (92.1%) |
| Total (Overall) | 222 (33.3%) | 445 (66.7%) |
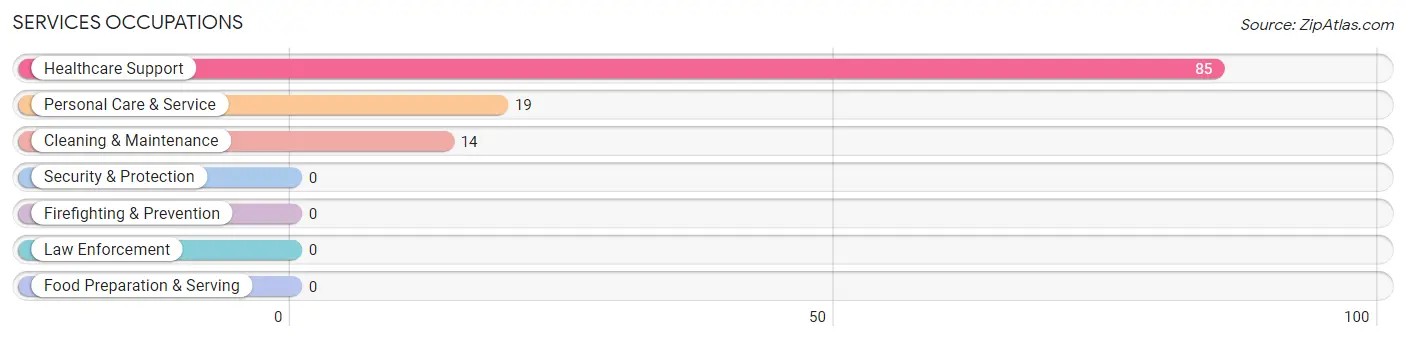
Services Occupations
The most common Services occupations in Roseland are Healthcare Support (85 | 12.7%), Personal Care & Service (19 | 2.9%), and Cleaning & Maintenance (14 | 2.1%).
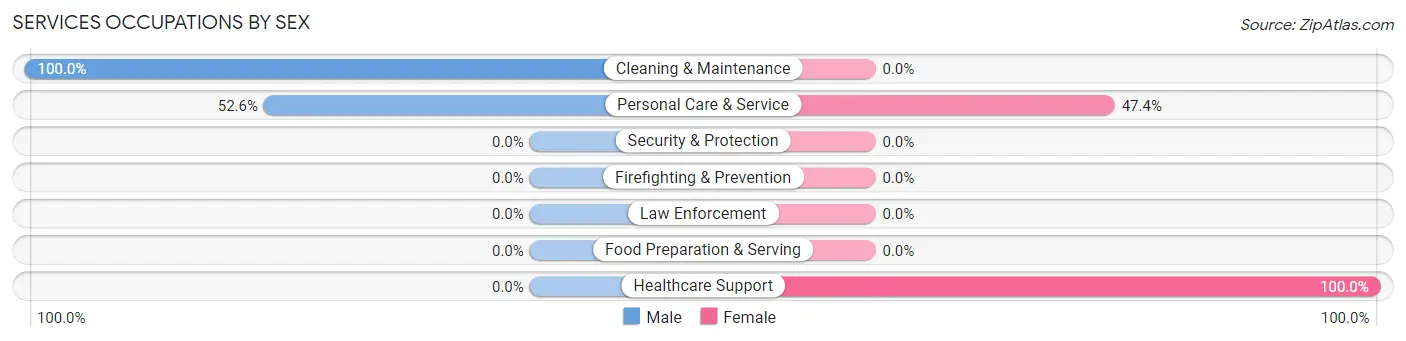
Services Occupations by Sex
Within the Services occupations in Roseland, the most male-oriented occupations are Cleaning & Maintenance (100.0%), and Personal Care & Service (52.6%), while the most female-oriented occupations are Healthcare Support (100.0%), and Personal Care & Service (47.4%).
| Occupation | Male | Female |
| Healthcare Support | 0 (0.0%) | 85 (100.0%) |
| Security & Protection | 0 (0.0%) | 0 (0.0%) |
| Firefighting & Prevention | 0 (0.0%) | 0 (0.0%) |
| Law Enforcement | 0 (0.0%) | 0 (0.0%) |
| Food Preparation & Serving | 0 (0.0%) | 0 (0.0%) |
| Cleaning & Maintenance | 14 (100.0%) | 0 (0.0%) |
| Personal Care & Service | 10 (52.6%) | 9 (47.4%) |
| Total (Category) | 24 (20.3%) | 94 (79.7%) |
| Total (Overall) | 222 (33.3%) | 445 (66.7%) |
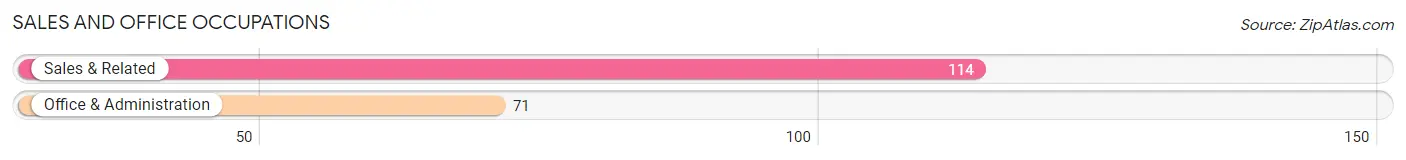
Sales and Office Occupations
The most common Sales and Office occupations in Roseland are Sales & Related (114 | 17.1%), and Office & Administration (71 | 10.6%).
Sales and Office Occupations by Sex
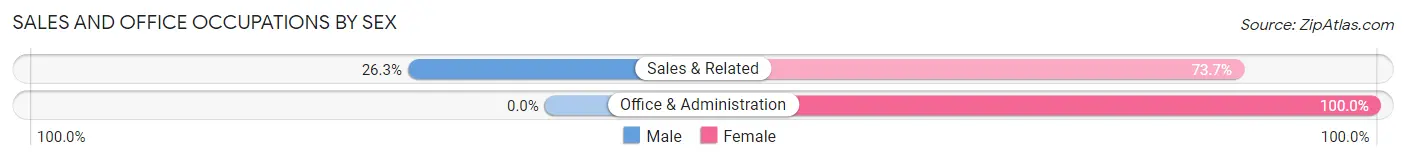
| Occupation | Male | Female |
| Sales & Related | 30 (26.3%) | 84 (73.7%) |
| Office & Administration | 0 (0.0%) | 71 (100.0%) |
| Total (Category) | 30 (16.2%) | 155 (83.8%) |
| Total (Overall) | 222 (33.3%) | 445 (66.7%) |
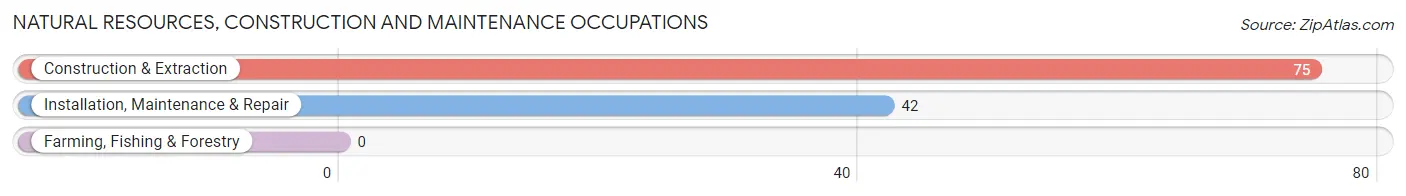
Natural Resources, Construction and Maintenance Occupations
The most common Natural Resources, Construction and Maintenance occupations in Roseland are Construction & Extraction (75 | 11.2%), and Installation, Maintenance & Repair (42 | 6.3%).
Natural Resources, Construction and Maintenance Occupations by Sex
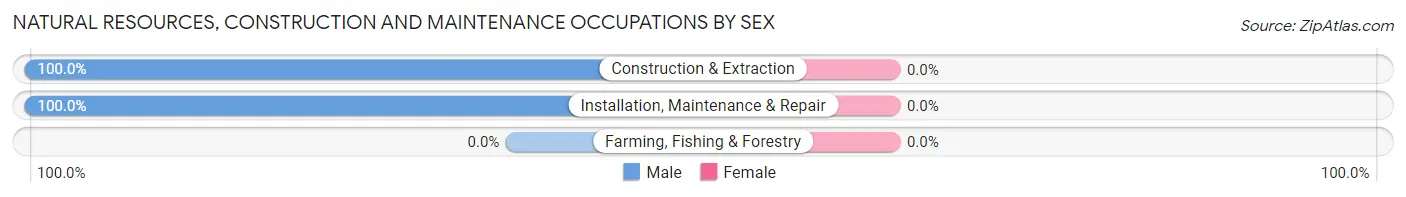
| Occupation | Male | Female |
| Farming, Fishing & Forestry | 0 (0.0%) | 0 (0.0%) |
| Construction & Extraction | 75 (100.0%) | 0 (0.0%) |
| Installation, Maintenance & Repair | 42 (100.0%) | 0 (0.0%) |
| Total (Category) | 117 (100.0%) | 0 (0.0%) |
| Total (Overall) | 222 (33.3%) | 445 (66.7%) |
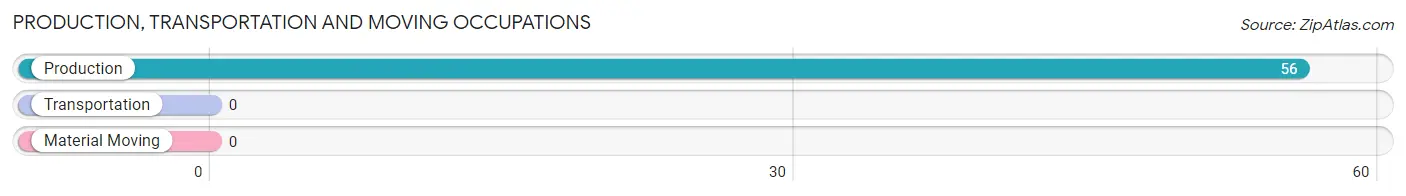
Production, Transportation and Moving Occupations
The most common Production, Transportation and Moving occupations in Roseland are , and Production (56 | 8.4%).
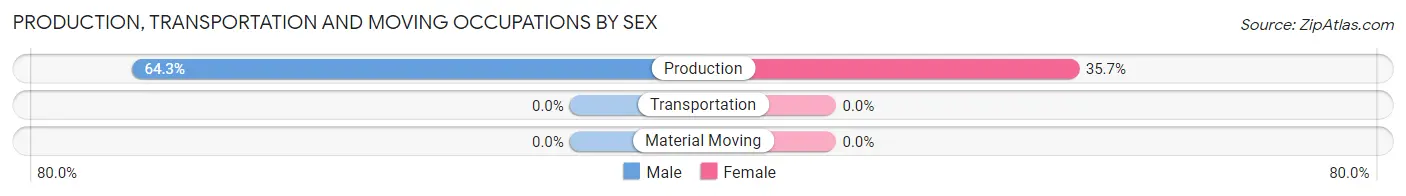
Production, Transportation and Moving Occupations by Sex
| Occupation | Male | Female |
| Production | 36 (64.3%) | 20 (35.7%) |
| Transportation | 0 (0.0%) | 0 (0.0%) |
| Material Moving | 0 (0.0%) | 0 (0.0%) |
| Total (Category) | 36 (64.3%) | 20 (35.7%) |
| Total (Overall) | 222 (33.3%) | 445 (66.7%) |
Employment Industries by Sex in Roseland
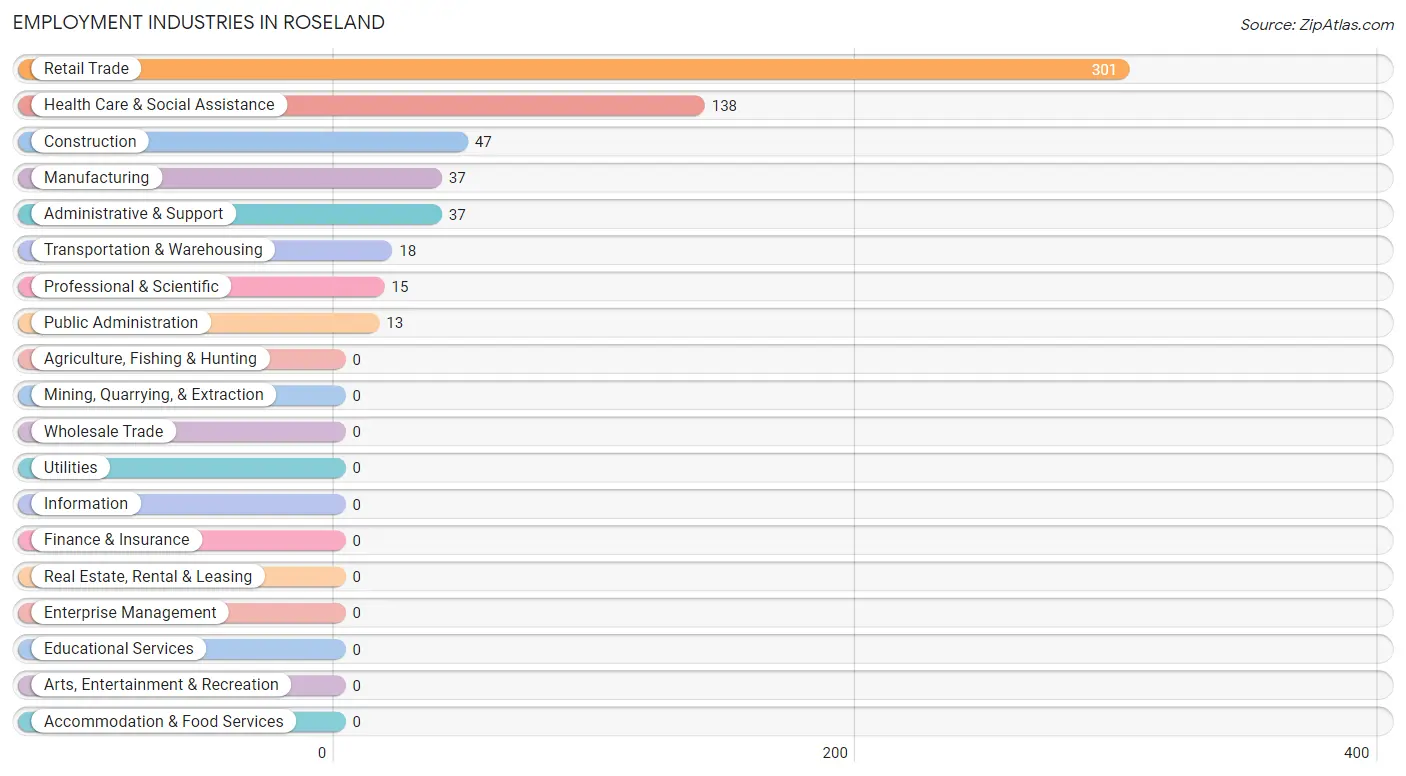
Employment Industries in Roseland
The major employment industries in Roseland include Retail Trade (301 | 45.1%), Health Care & Social Assistance (138 | 20.7%), Construction (47 | 7.0%), Manufacturing (37 | 5.6%), and Administrative & Support (37 | 5.6%).
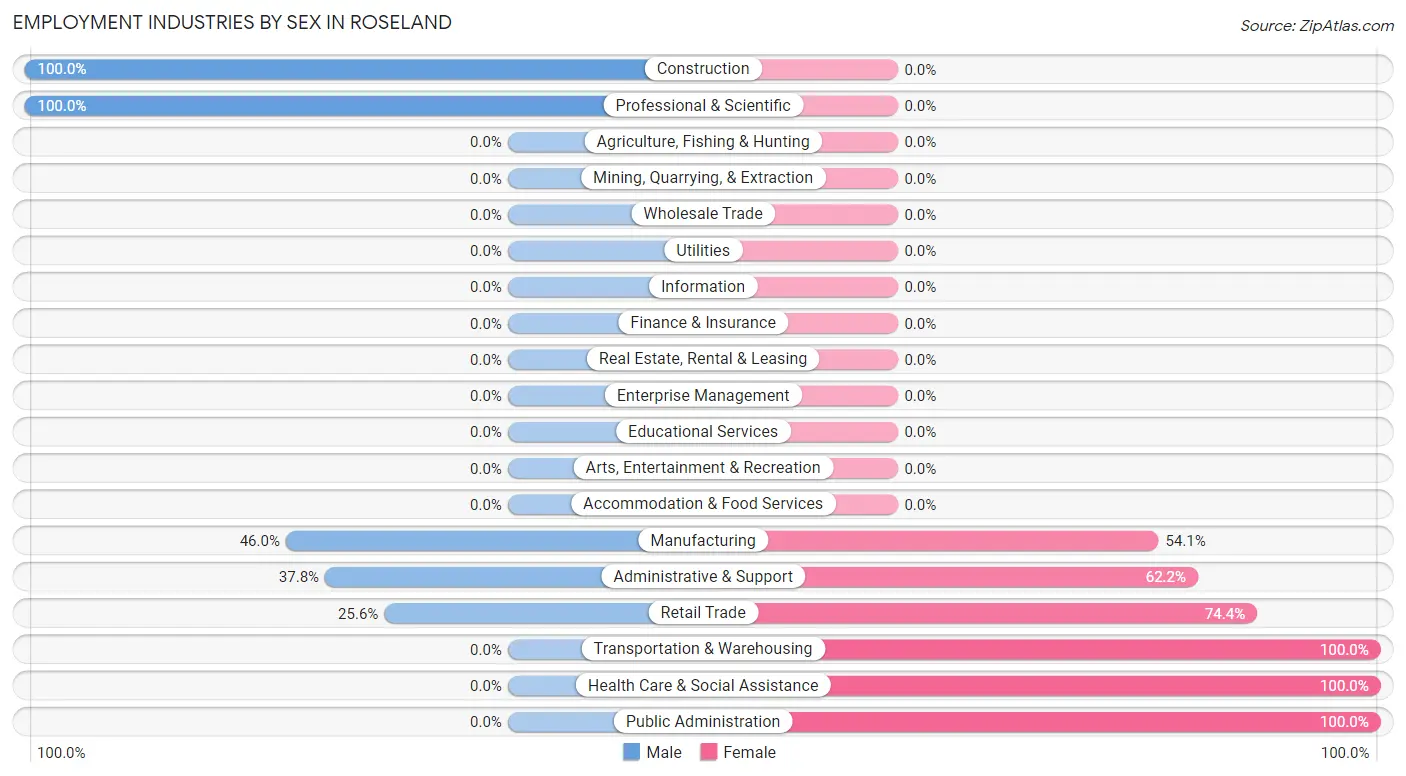
Employment Industries by Sex in Roseland
The Roseland industries that see more men than women are Construction (100.0%), Professional & Scientific (100.0%), and Manufacturing (46.0%), whereas the industries that tend to have a higher number of women are Transportation & Warehousing (100.0%), Health Care & Social Assistance (100.0%), and Public Administration (100.0%).
| Industry | Male | Female |
| Agriculture, Fishing & Hunting | 0 (0.0%) | 0 (0.0%) |
| Mining, Quarrying, & Extraction | 0 (0.0%) | 0 (0.0%) |
| Construction | 47 (100.0%) | 0 (0.0%) |
| Manufacturing | 17 (46.0%) | 20 (54.0%) |
| Wholesale Trade | 0 (0.0%) | 0 (0.0%) |
| Retail Trade | 77 (25.6%) | 224 (74.4%) |
| Transportation & Warehousing | 0 (0.0%) | 18 (100.0%) |
| Utilities | 0 (0.0%) | 0 (0.0%) |
| Information | 0 (0.0%) | 0 (0.0%) |
| Finance & Insurance | 0 (0.0%) | 0 (0.0%) |
| Real Estate, Rental & Leasing | 0 (0.0%) | 0 (0.0%) |
| Professional & Scientific | 15 (100.0%) | 0 (0.0%) |
| Enterprise Management | 0 (0.0%) | 0 (0.0%) |
| Administrative & Support | 14 (37.8%) | 23 (62.2%) |
| Educational Services | 0 (0.0%) | 0 (0.0%) |
| Health Care & Social Assistance | 0 (0.0%) | 138 (100.0%) |
| Arts, Entertainment & Recreation | 0 (0.0%) | 0 (0.0%) |
| Accommodation & Food Services | 0 (0.0%) | 0 (0.0%) |
| Public Administration | 0 (0.0%) | 13 (100.0%) |
| Total | 222 (33.3%) | 445 (66.7%) |
Education in Roseland
School Enrollment in Roseland
The most common levels of schooling among the 81 students in Roseland are college / undergraduate (29 | 35.8%), middle school (27 | 33.3%), and high school (14 | 17.3%).
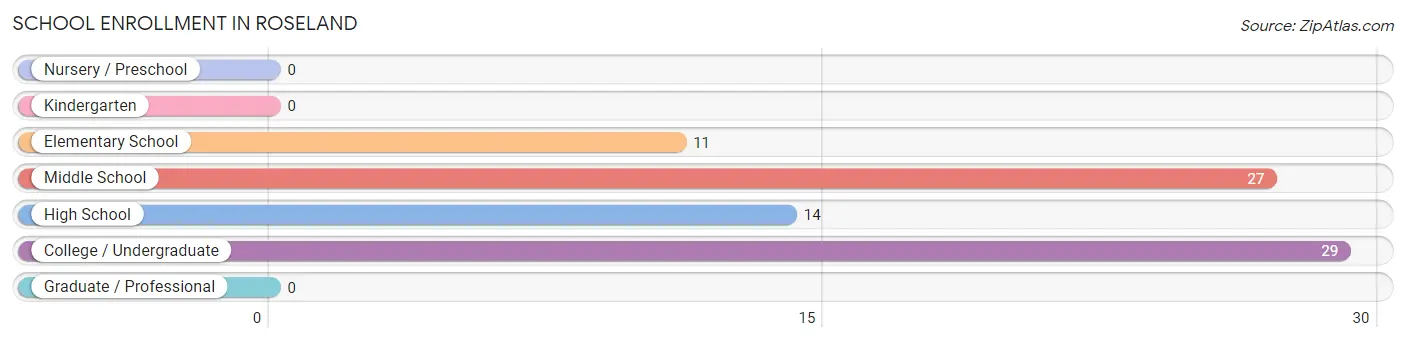
| School Level | # Students | % Students |
| Nursery / Preschool | 0 | 0.0% |
| Kindergarten | 0 | 0.0% |
| Elementary School | 11 | 13.6% |
| Middle School | 27 | 33.3% |
| High School | 14 | 17.3% |
| College / Undergraduate | 29 | 35.8% |
| Graduate / Professional | 0 | 0.0% |
| Total | 81 | 100.0% |
School Enrollment by Age by Funding Source in Roseland
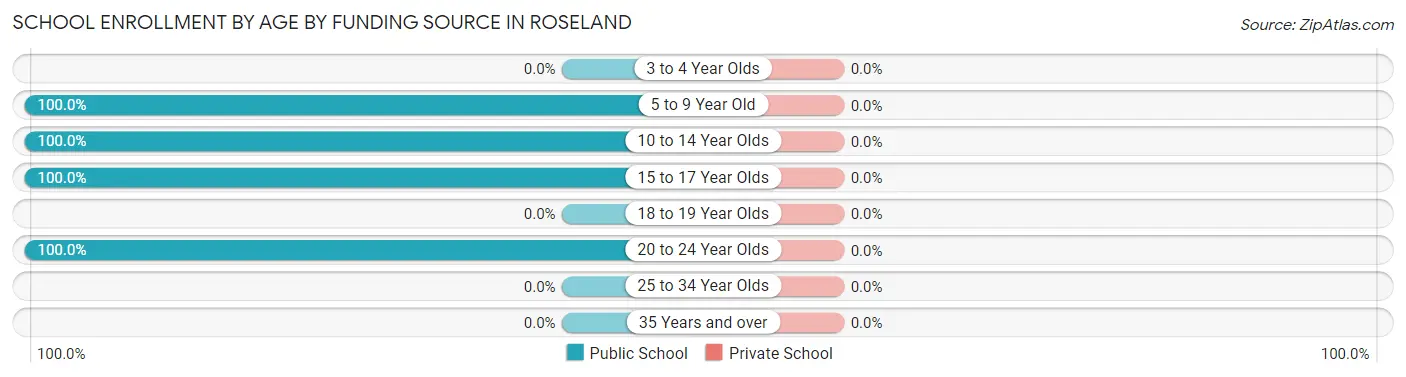
| Age Bracket | Public School | Private School |
| 3 to 4 Year Olds | 0 (0.0%) | 0 (0.0%) |
| 5 to 9 Year Old | 11 (100.0%) | 0 (0.0%) |
| 10 to 14 Year Olds | 27 (100.0%) | 0 (0.0%) |
| 15 to 17 Year Olds | 14 (100.0%) | 0 (0.0%) |
| 18 to 19 Year Olds | 0 (0.0%) | 0 (0.0%) |
| 20 to 24 Year Olds | 29 (100.0%) | 0 (0.0%) |
| 25 to 34 Year Olds | 0 (0.0%) | 0 (0.0%) |
| 35 Years and over | 0 (0.0%) | 0 (0.0%) |
| Total | 81 (100.0%) | 0 (0.0%) |
Educational Attainment by Field of Study in Roseland
Education (78 | 26.5%), science & technology (66 | 22.5%), business (51 | 17.3%), psychology (46 | 15.7%), and physical & health sciences (21 | 7.1%) are the most common fields of study among 294 individuals in Roseland who have obtained a bachelor's degree or higher.
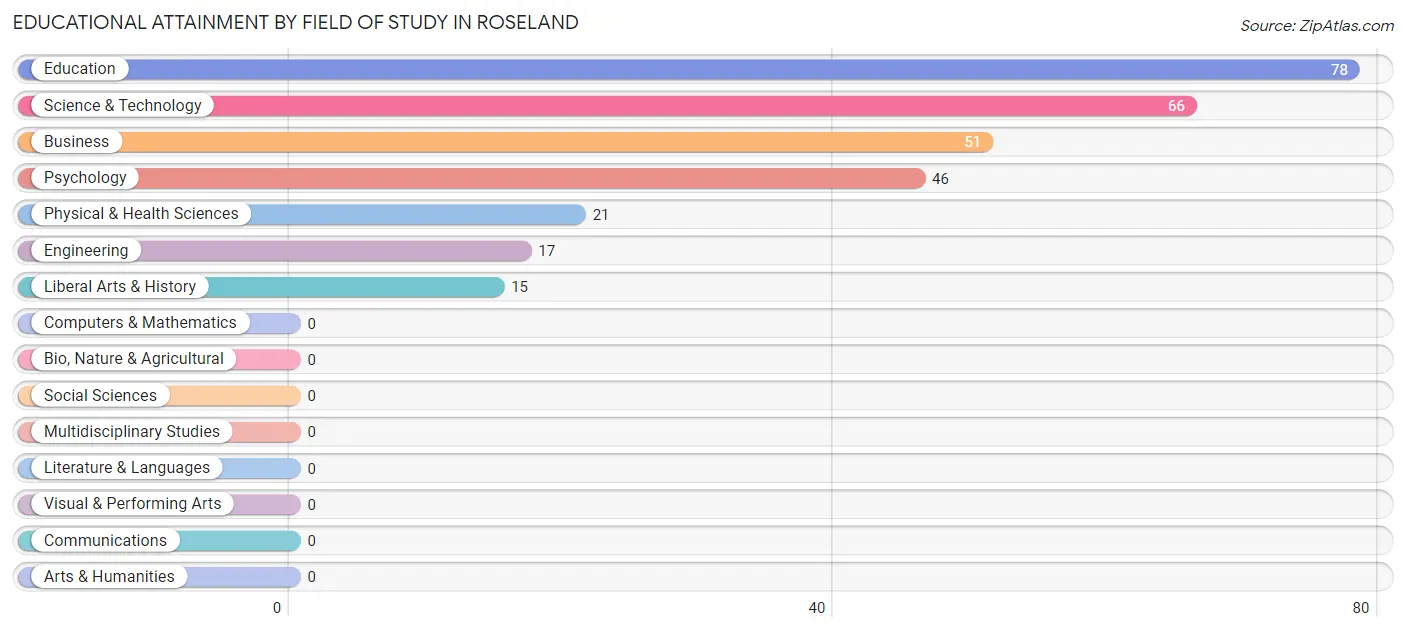
| Field of Study | # Graduates | % Graduates |
| Computers & Mathematics | 0 | 0.0% |
| Bio, Nature & Agricultural | 0 | 0.0% |
| Physical & Health Sciences | 21 | 7.1% |
| Psychology | 46 | 15.7% |
| Social Sciences | 0 | 0.0% |
| Engineering | 17 | 5.8% |
| Multidisciplinary Studies | 0 | 0.0% |
| Science & Technology | 66 | 22.5% |
| Business | 51 | 17.3% |
| Education | 78 | 26.5% |
| Literature & Languages | 0 | 0.0% |
| Liberal Arts & History | 15 | 5.1% |
| Visual & Performing Arts | 0 | 0.0% |
| Communications | 0 | 0.0% |
| Arts & Humanities | 0 | 0.0% |
| Total | 294 | 100.0% |
Transportation & Commute in Roseland
Vehicle Availability by Sex in Roseland
The most prevalent vehicle ownership categories in Roseland are males with 1 vehicle (81, accounting for 36.5%) and females with 1 vehicle (164, making up 18.2%).
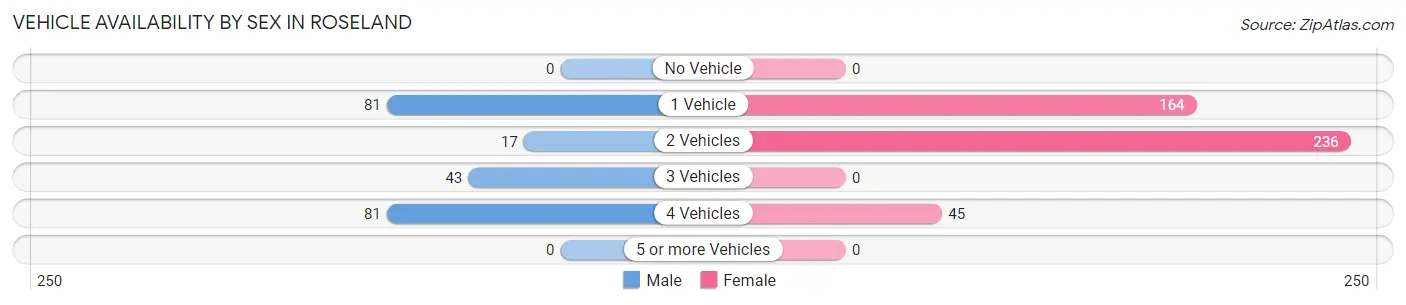
| Vehicles Available | Male | Female |
| No Vehicle | 0 (0.0%) | 0 (0.0%) |
| 1 Vehicle | 81 (36.5%) | 164 (36.8%) |
| 2 Vehicles | 17 (7.7%) | 236 (53.0%) |
| 3 Vehicles | 43 (19.4%) | 0 (0.0%) |
| 4 Vehicles | 81 (36.5%) | 45 (10.1%) |
| 5 or more Vehicles | 0 (0.0%) | 0 (0.0%) |
| Total | 222 (100.0%) | 445 (100.0%) |
Commute Time in Roseland
The most frequently occuring commute durations in Roseland are 10 to 14 minutes (189 commuters, 29.5%), 15 to 19 minutes (121 commuters, 18.9%), and 45 to 59 minutes (117 commuters, 18.3%).
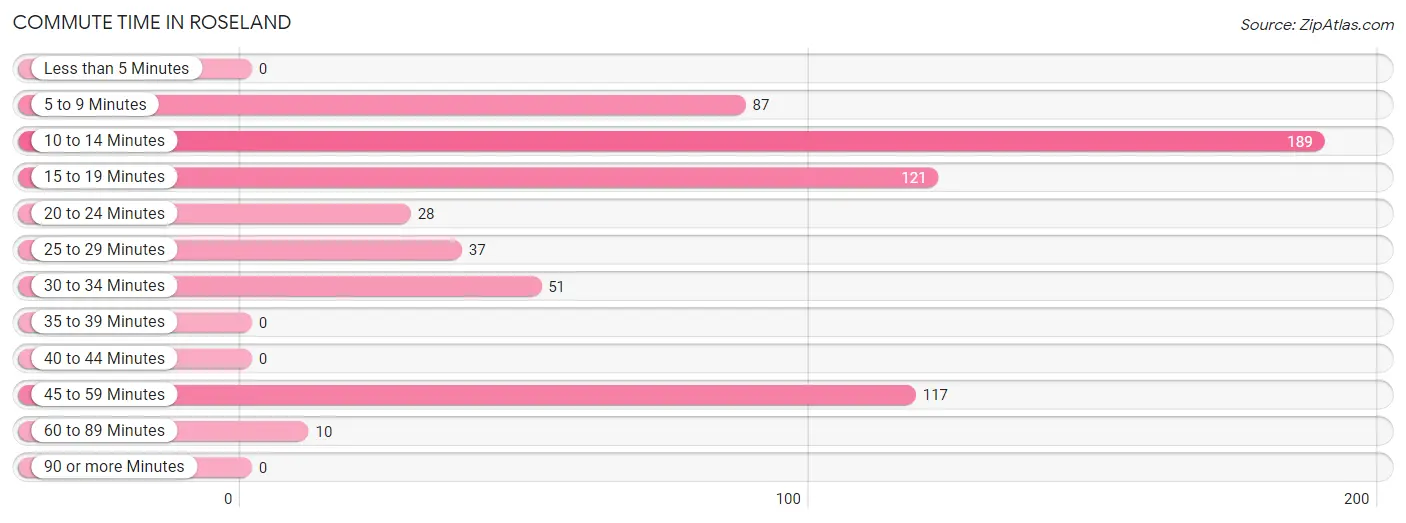
| Commute Time | # Commuters | % Commuters |
| Less than 5 Minutes | 0 | 0.0% |
| 5 to 9 Minutes | 87 | 13.6% |
| 10 to 14 Minutes | 189 | 29.5% |
| 15 to 19 Minutes | 121 | 18.9% |
| 20 to 24 Minutes | 28 | 4.4% |
| 25 to 29 Minutes | 37 | 5.8% |
| 30 to 34 Minutes | 51 | 8.0% |
| 35 to 39 Minutes | 0 | 0.0% |
| 40 to 44 Minutes | 0 | 0.0% |
| 45 to 59 Minutes | 117 | 18.3% |
| 60 to 89 Minutes | 10 | 1.6% |
| 90 or more Minutes | 0 | 0.0% |
Commute Time by Sex in Roseland
The most common commute times in Roseland are 10 to 14 minutes (66 commuters, 29.7%) for males and 10 to 14 minutes (123 commuters, 29.4%) for females.
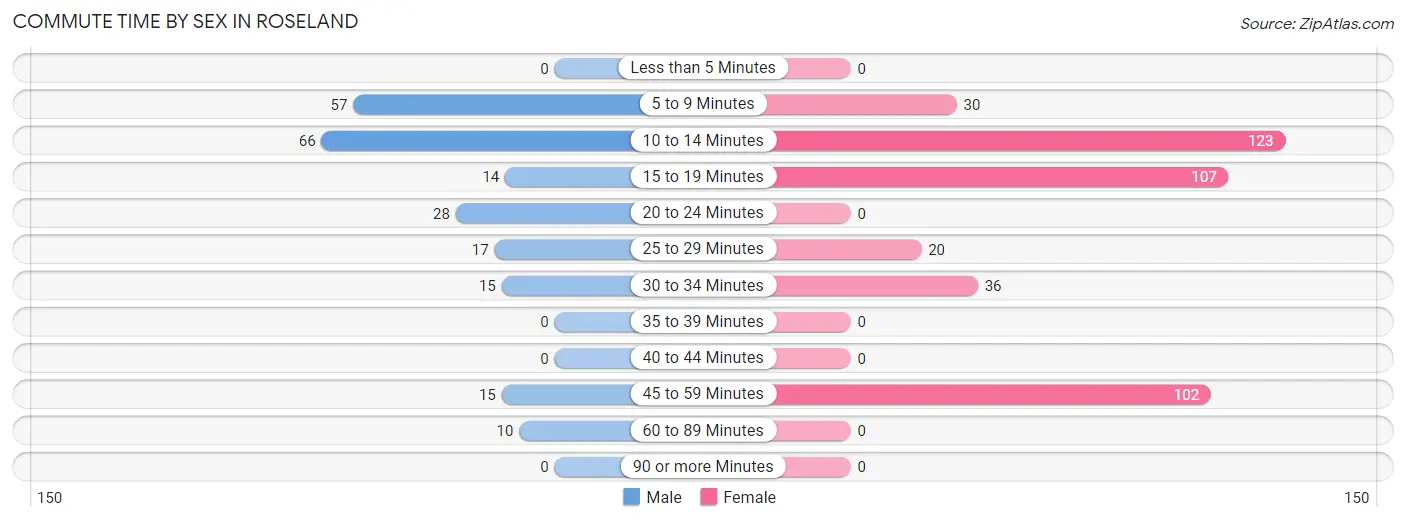
| Commute Time | Male | Female |
| Less than 5 Minutes | 0 (0.0%) | 0 (0.0%) |
| 5 to 9 Minutes | 57 (25.7%) | 30 (7.2%) |
| 10 to 14 Minutes | 66 (29.7%) | 123 (29.4%) |
| 15 to 19 Minutes | 14 (6.3%) | 107 (25.6%) |
| 20 to 24 Minutes | 28 (12.6%) | 0 (0.0%) |
| 25 to 29 Minutes | 17 (7.7%) | 20 (4.8%) |
| 30 to 34 Minutes | 15 (6.8%) | 36 (8.6%) |
| 35 to 39 Minutes | 0 (0.0%) | 0 (0.0%) |
| 40 to 44 Minutes | 0 (0.0%) | 0 (0.0%) |
| 45 to 59 Minutes | 15 (6.8%) | 102 (24.4%) |
| 60 to 89 Minutes | 10 (4.5%) | 0 (0.0%) |
| 90 or more Minutes | 0 (0.0%) | 0 (0.0%) |
Time of Departure to Work by Sex in Roseland
The most frequent times of departure to work in Roseland are 7:30 AM to 7:59 AM (79, 35.6%) for males and 7:00 AM to 7:29 AM (170, 40.7%) for females.
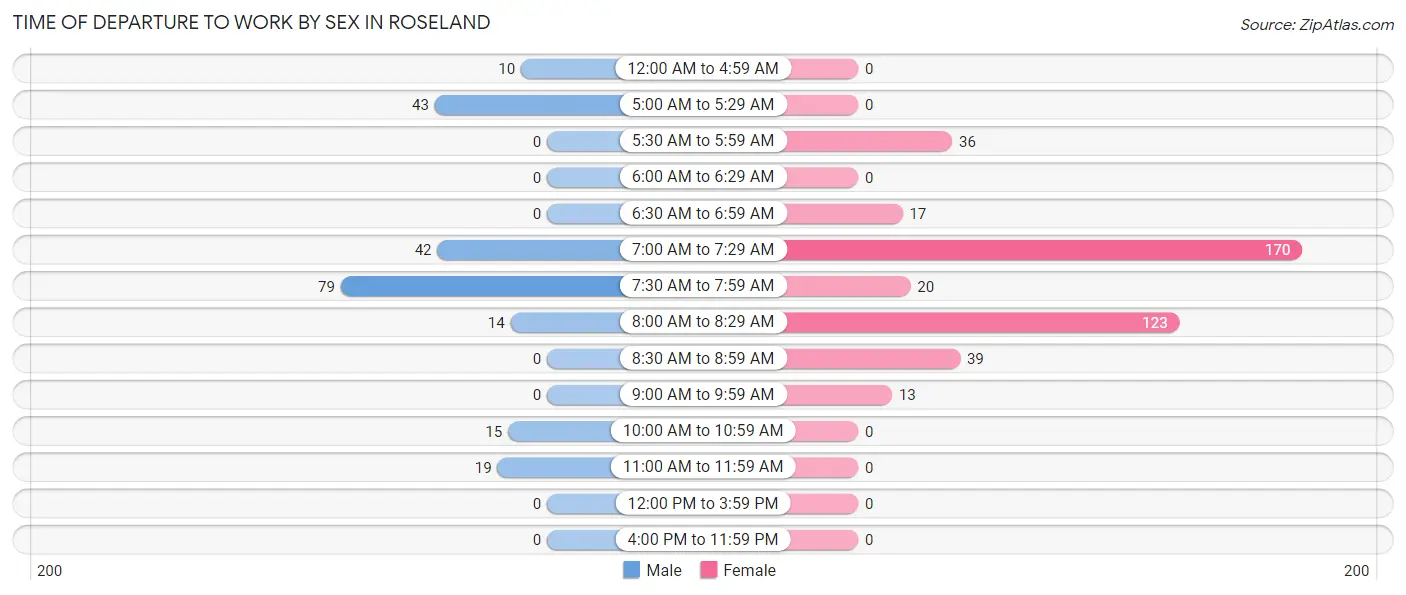
| Time of Departure | Male | Female |
| 12:00 AM to 4:59 AM | 10 (4.5%) | 0 (0.0%) |
| 5:00 AM to 5:29 AM | 43 (19.4%) | 0 (0.0%) |
| 5:30 AM to 5:59 AM | 0 (0.0%) | 36 (8.6%) |
| 6:00 AM to 6:29 AM | 0 (0.0%) | 0 (0.0%) |
| 6:30 AM to 6:59 AM | 0 (0.0%) | 17 (4.1%) |
| 7:00 AM to 7:29 AM | 42 (18.9%) | 170 (40.7%) |
| 7:30 AM to 7:59 AM | 79 (35.6%) | 20 (4.8%) |
| 8:00 AM to 8:29 AM | 14 (6.3%) | 123 (29.4%) |
| 8:30 AM to 8:59 AM | 0 (0.0%) | 39 (9.3%) |
| 9:00 AM to 9:59 AM | 0 (0.0%) | 13 (3.1%) |
| 10:00 AM to 10:59 AM | 15 (6.8%) | 0 (0.0%) |
| 11:00 AM to 11:59 AM | 19 (8.6%) | 0 (0.0%) |
| 12:00 PM to 3:59 PM | 0 (0.0%) | 0 (0.0%) |
| 4:00 PM to 11:59 PM | 0 (0.0%) | 0 (0.0%) |
| Total | 222 (100.0%) | 418 (100.0%) |
Housing Occupancy in Roseland
Occupancy by Ownership in Roseland
Of the total 657 dwellings in Roseland, owner-occupied units account for 563 (85.7%), while renter-occupied units make up 94 (14.3%).
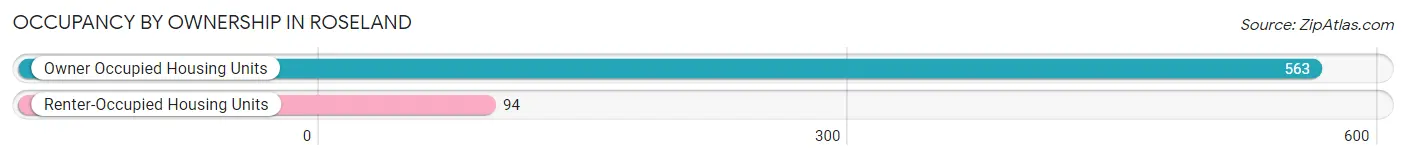
| Occupancy | # Housing Units | % Housing Units |
| Owner Occupied Housing Units | 563 | 85.7% |
| Renter-Occupied Housing Units | 94 | 14.3% |
| Total Occupied Housing Units | 657 | 100.0% |
Occupancy by Household Size in Roseland
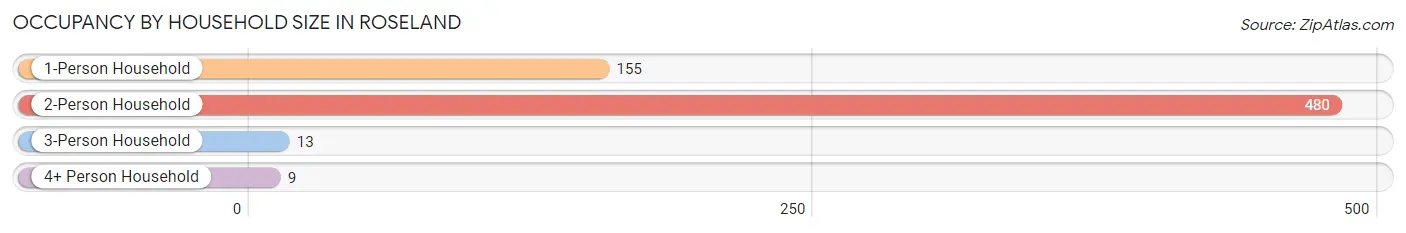
| Household Size | # Housing Units | % Housing Units |
| 1-Person Household | 155 | 23.6% |
| 2-Person Household | 480 | 73.1% |
| 3-Person Household | 13 | 2.0% |
| 4+ Person Household | 9 | 1.4% |
| Total Housing Units | 657 | 100.0% |
Occupancy by Ownership by Household Size in Roseland
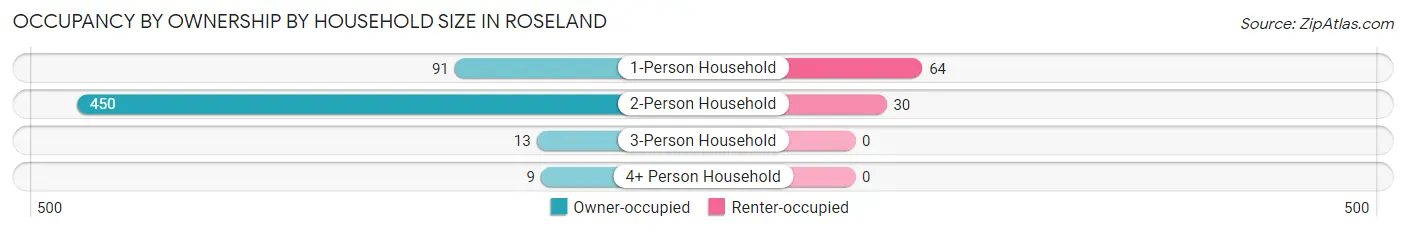
| Household Size | Owner-occupied | Renter-occupied |
| 1-Person Household | 91 (58.7%) | 64 (41.3%) |
| 2-Person Household | 450 (93.8%) | 30 (6.2%) |
| 3-Person Household | 13 (100.0%) | 0 (0.0%) |
| 4+ Person Household | 9 (100.0%) | 0 (0.0%) |
| Total Housing Units | 563 (85.7%) | 94 (14.3%) |
Occupancy by Educational Attainment in Roseland
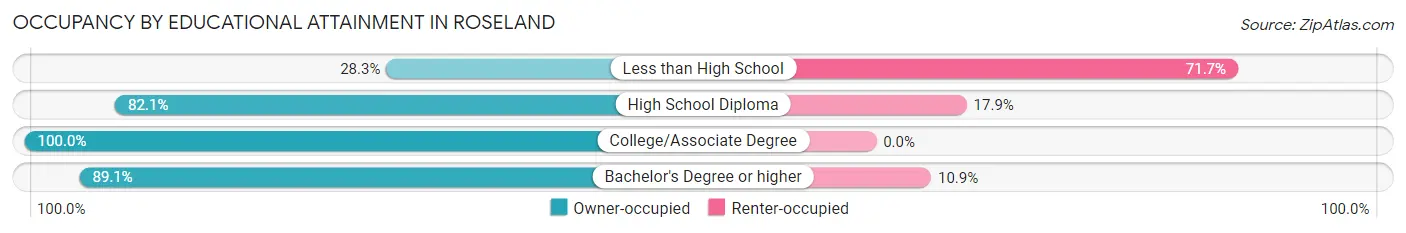
| Household Size | Owner-occupied | Renter-occupied |
| Less than High School | 15 (28.3%) | 38 (71.7%) |
| High School Diploma | 183 (82.1%) | 40 (17.9%) |
| College/Associate Degree | 234 (100.0%) | 0 (0.0%) |
| Bachelor's Degree or higher | 131 (89.1%) | 16 (10.9%) |
Occupancy by Age of Householder in Roseland
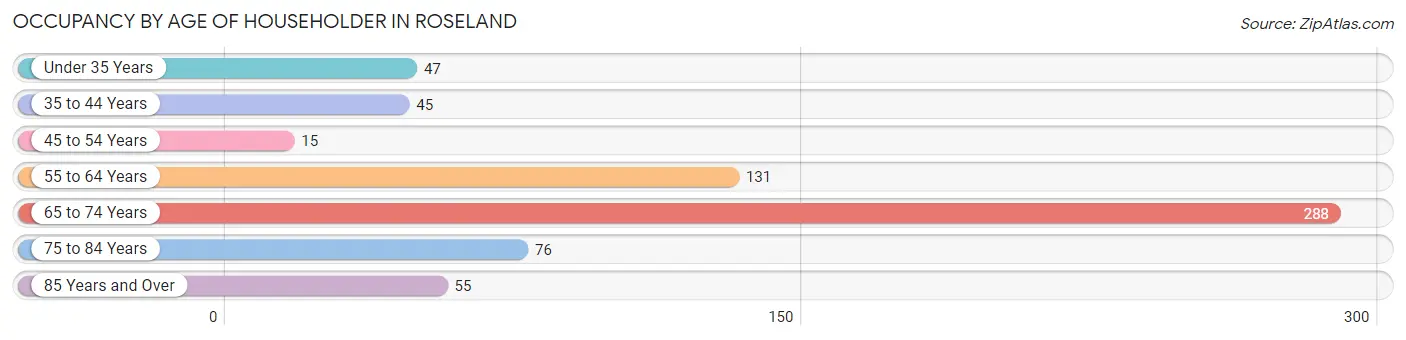
| Age Bracket | # Households | % Households |
| Under 35 Years | 47 | 7.1% |
| 35 to 44 Years | 45 | 6.9% |
| 45 to 54 Years | 15 | 2.3% |
| 55 to 64 Years | 131 | 19.9% |
| 65 to 74 Years | 288 | 43.8% |
| 75 to 84 Years | 76 | 11.6% |
| 85 Years and Over | 55 | 8.4% |
| Total | 657 | 100.0% |
Housing Finances in Roseland
Median Income by Occupancy in Roseland
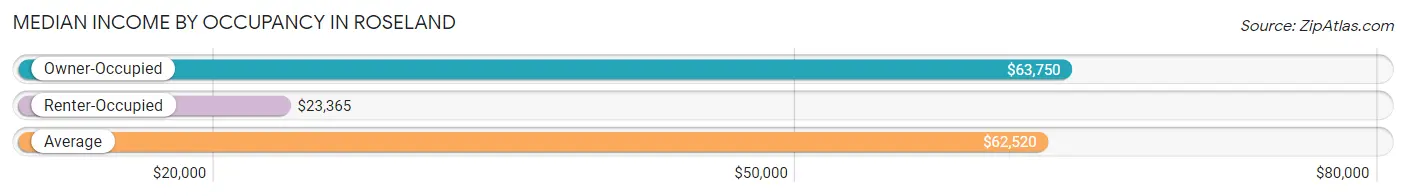
| Occupancy Type | # Households | Median Income |
| Owner-Occupied | 563 (85.7%) | $63,750 |
| Renter-Occupied | 94 (14.3%) | $23,365 |
| Average | 657 (100.0%) | $62,520 |
Occupancy by Householder Income Bracket in Roseland
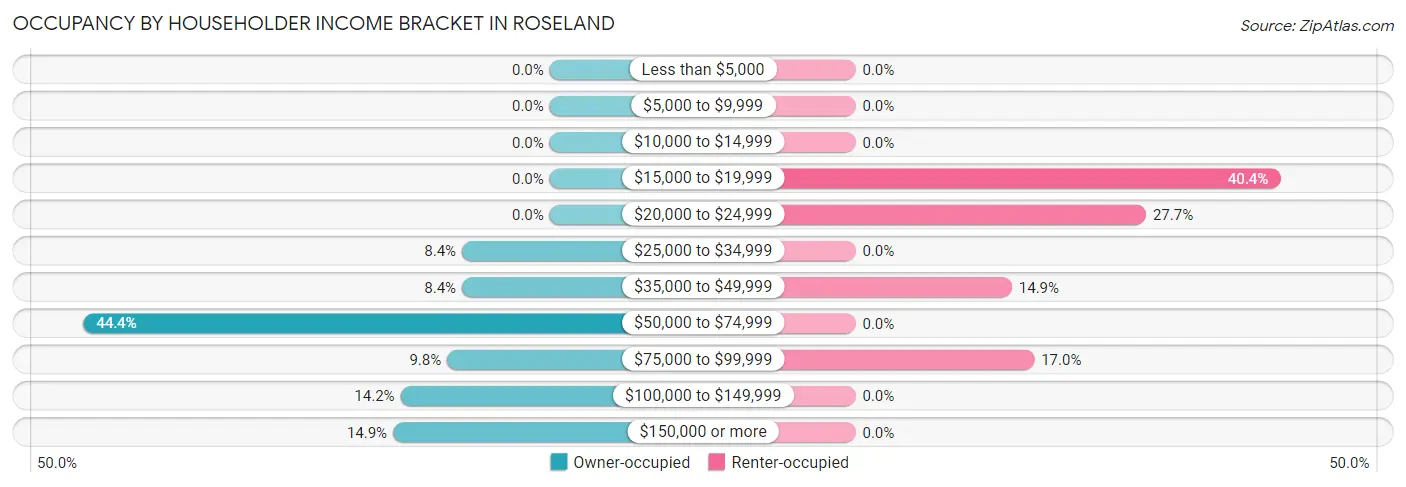
| Income Bracket | Owner-occupied | Renter-occupied |
| Less than $5,000 | 0 (0.0%) | 0 (0.0%) |
| $5,000 to $9,999 | 0 (0.0%) | 0 (0.0%) |
| $10,000 to $14,999 | 0 (0.0%) | 0 (0.0%) |
| $15,000 to $19,999 | 0 (0.0%) | 38 (40.4%) |
| $20,000 to $24,999 | 0 (0.0%) | 26 (27.7%) |
| $25,000 to $34,999 | 47 (8.4%) | 0 (0.0%) |
| $35,000 to $49,999 | 47 (8.4%) | 14 (14.9%) |
| $50,000 to $74,999 | 250 (44.4%) | 0 (0.0%) |
| $75,000 to $99,999 | 55 (9.8%) | 16 (17.0%) |
| $100,000 to $149,999 | 80 (14.2%) | 0 (0.0%) |
| $150,000 or more | 84 (14.9%) | 0 (0.0%) |
| Total | 563 (100.0%) | 94 (100.0%) |
Monthly Housing Cost Tiers in Roseland
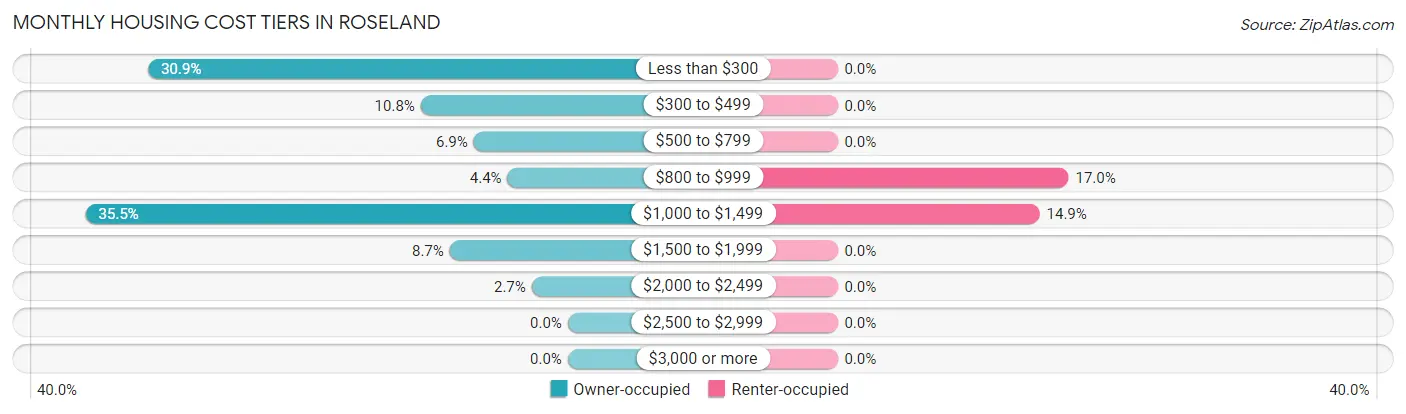
| Monthly Cost | Owner-occupied | Renter-occupied |
| Less than $300 | 174 (30.9%) | 0 (0.0%) |
| $300 to $499 | 61 (10.8%) | 0 (0.0%) |
| $500 to $799 | 39 (6.9%) | 0 (0.0%) |
| $800 to $999 | 25 (4.4%) | 16 (17.0%) |
| $1,000 to $1,499 | 200 (35.5%) | 14 (14.9%) |
| $1,500 to $1,999 | 49 (8.7%) | 0 (0.0%) |
| $2,000 to $2,499 | 15 (2.7%) | 0 (0.0%) |
| $2,500 to $2,999 | 0 (0.0%) | 0 (0.0%) |
| $3,000 or more | 0 (0.0%) | 0 (0.0%) |
| Total | 563 (100.0%) | 94 (100.0%) |
Physical Housing Characteristics in Roseland
Housing Structures in Roseland
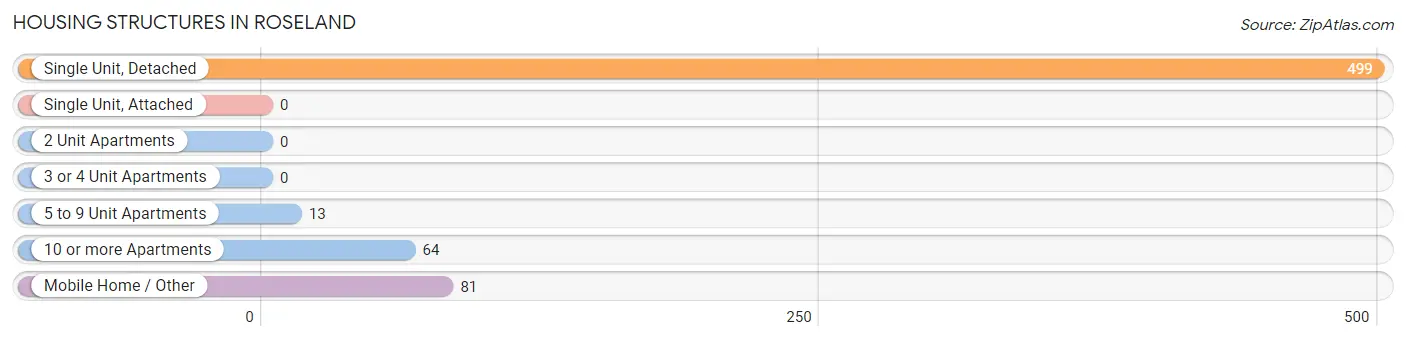
| Structure Type | # Housing Units | % Housing Units |
| Single Unit, Detached | 499 | 75.9% |
| Single Unit, Attached | 0 | 0.0% |
| 2 Unit Apartments | 0 | 0.0% |
| 3 or 4 Unit Apartments | 0 | 0.0% |
| 5 to 9 Unit Apartments | 13 | 2.0% |
| 10 or more Apartments | 64 | 9.7% |
| Mobile Home / Other | 81 | 12.3% |
| Total | 657 | 100.0% |
Housing Structures by Occupancy in Roseland
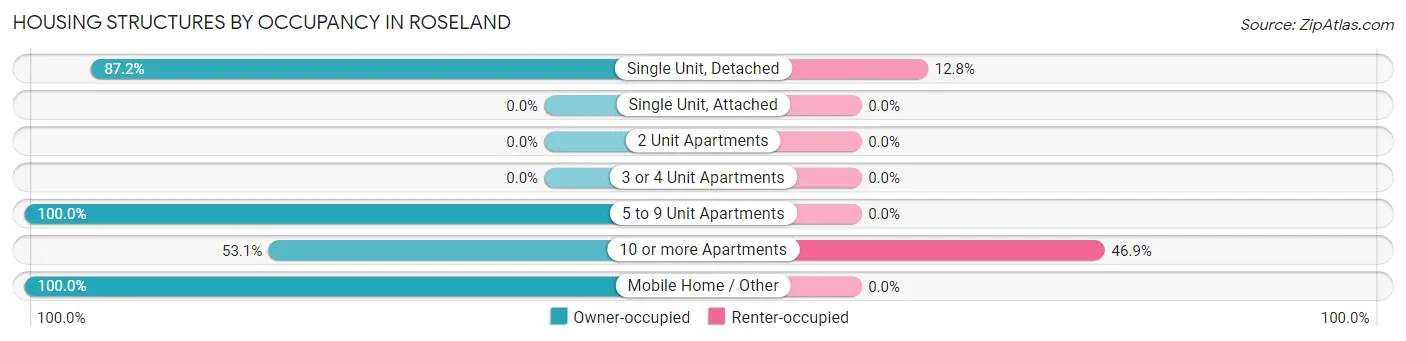
| Structure Type | Owner-occupied | Renter-occupied |
| Single Unit, Detached | 435 (87.2%) | 64 (12.8%) |
| Single Unit, Attached | 0 (0.0%) | 0 (0.0%) |
| 2 Unit Apartments | 0 (0.0%) | 0 (0.0%) |
| 3 or 4 Unit Apartments | 0 (0.0%) | 0 (0.0%) |
| 5 to 9 Unit Apartments | 13 (100.0%) | 0 (0.0%) |
| 10 or more Apartments | 34 (53.1%) | 30 (46.9%) |
| Mobile Home / Other | 81 (100.0%) | 0 (0.0%) |
| Total | 563 (85.7%) | 94 (14.3%) |
Housing Structures by Number of Rooms in Roseland
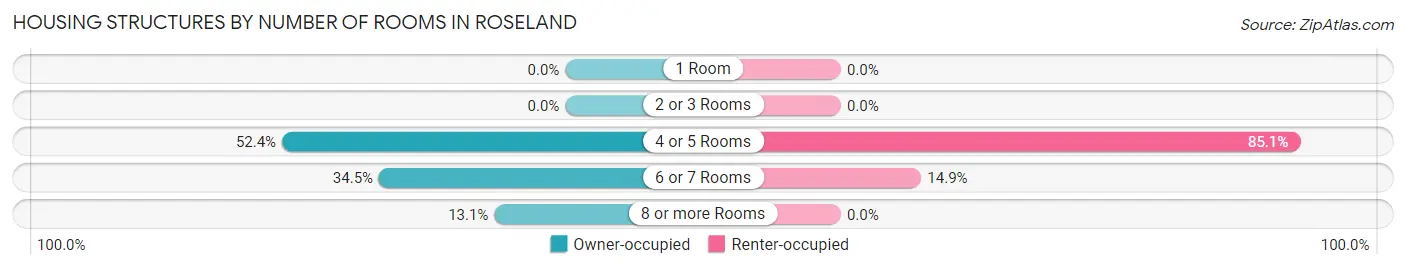
| Number of Rooms | Owner-occupied | Renter-occupied |
| 1 Room | 0 (0.0%) | 0 (0.0%) |
| 2 or 3 Rooms | 0 (0.0%) | 0 (0.0%) |
| 4 or 5 Rooms | 295 (52.4%) | 80 (85.1%) |
| 6 or 7 Rooms | 194 (34.5%) | 14 (14.9%) |
| 8 or more Rooms | 74 (13.1%) | 0 (0.0%) |
| Total | 563 (100.0%) | 94 (100.0%) |
Housing Structure by Heating Type in Roseland
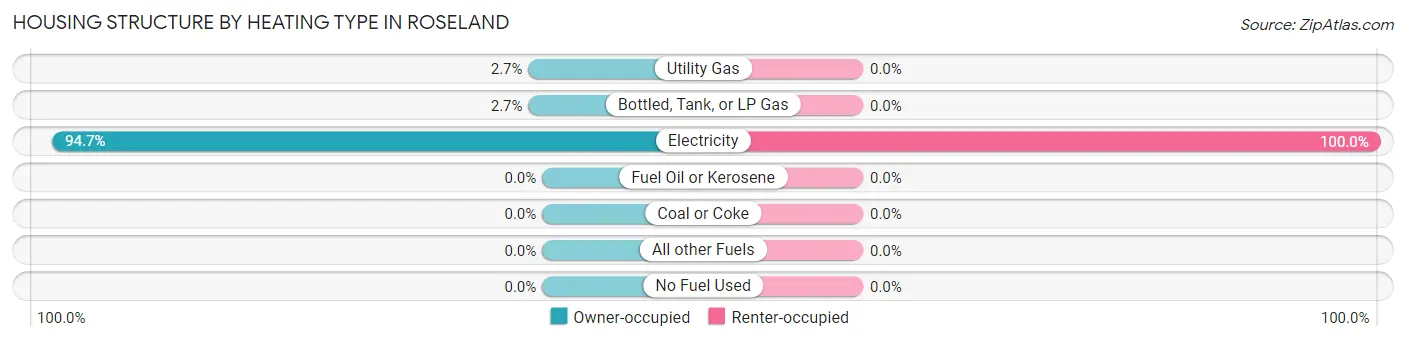
| Heating Type | Owner-occupied | Renter-occupied |
| Utility Gas | 15 (2.7%) | 0 (0.0%) |
| Bottled, Tank, or LP Gas | 15 (2.7%) | 0 (0.0%) |
| Electricity | 533 (94.7%) | 94 (100.0%) |
| Fuel Oil or Kerosene | 0 (0.0%) | 0 (0.0%) |
| Coal or Coke | 0 (0.0%) | 0 (0.0%) |
| All other Fuels | 0 (0.0%) | 0 (0.0%) |
| No Fuel Used | 0 (0.0%) | 0 (0.0%) |
| Total | 563 (100.0%) | 94 (100.0%) |
Household Vehicle Usage in Roseland
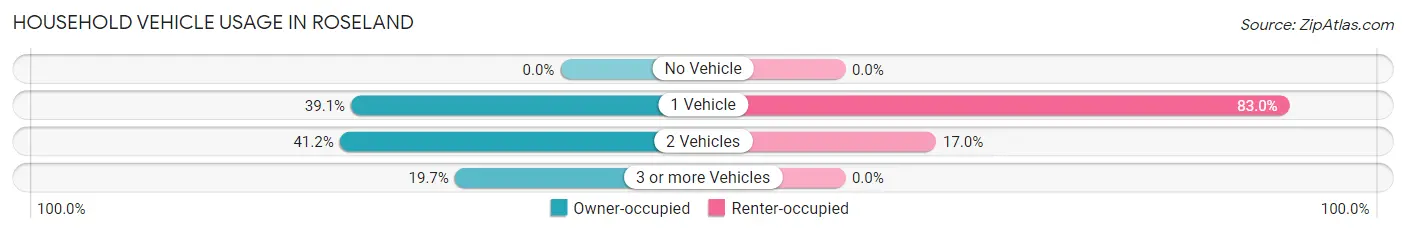
| Vehicles per Household | Owner-occupied | Renter-occupied |
| No Vehicle | 0 (0.0%) | 0 (0.0%) |
| 1 Vehicle | 220 (39.1%) | 78 (83.0%) |
| 2 Vehicles | 232 (41.2%) | 16 (17.0%) |
| 3 or more Vehicles | 111 (19.7%) | 0 (0.0%) |
| Total | 563 (100.0%) | 94 (100.0%) |
Real Estate & Mortgages in Roseland
Real Estate and Mortgage Overview in Roseland
| Characteristic | Without Mortgage | With Mortgage |
| Housing Units | 374 | 189 |
| Median Property Value | $187,700 | $343,000 |
| Median Household Income | $63,929 | $17 |
| Monthly Housing Costs | $323 | $0 |
| Real Estate Taxes | - | - |
Property Value by Mortgage Status in Roseland
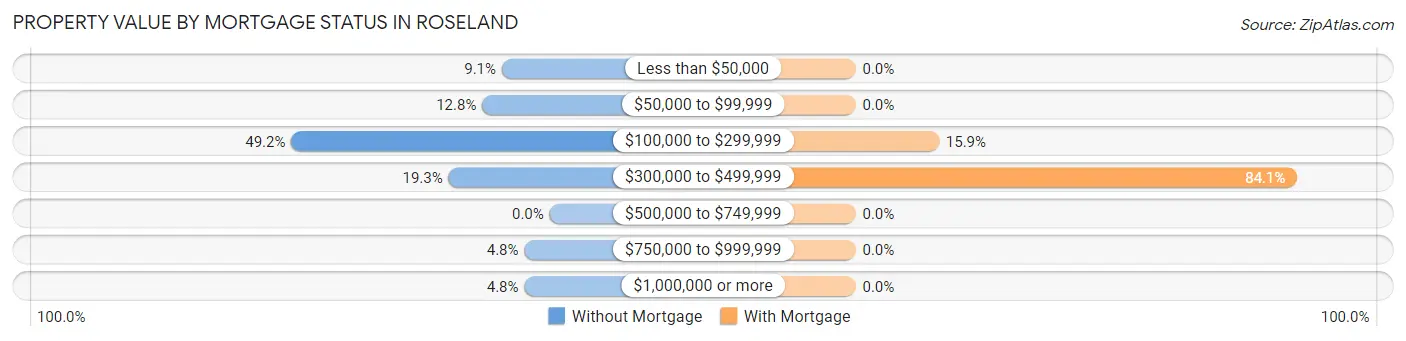
| Property Value | Without Mortgage | With Mortgage |
| Less than $50,000 | 34 (9.1%) | 0 (0.0%) |
| $50,000 to $99,999 | 48 (12.8%) | 0 (0.0%) |
| $100,000 to $299,999 | 184 (49.2%) | 30 (15.9%) |
| $300,000 to $499,999 | 72 (19.3%) | 159 (84.1%) |
| $500,000 to $749,999 | 0 (0.0%) | 0 (0.0%) |
| $750,000 to $999,999 | 18 (4.8%) | 0 (0.0%) |
| $1,000,000 or more | 18 (4.8%) | 0 (0.0%) |
| Total | 374 (100.0%) | 189 (100.0%) |
Household Income by Mortgage Status in Roseland
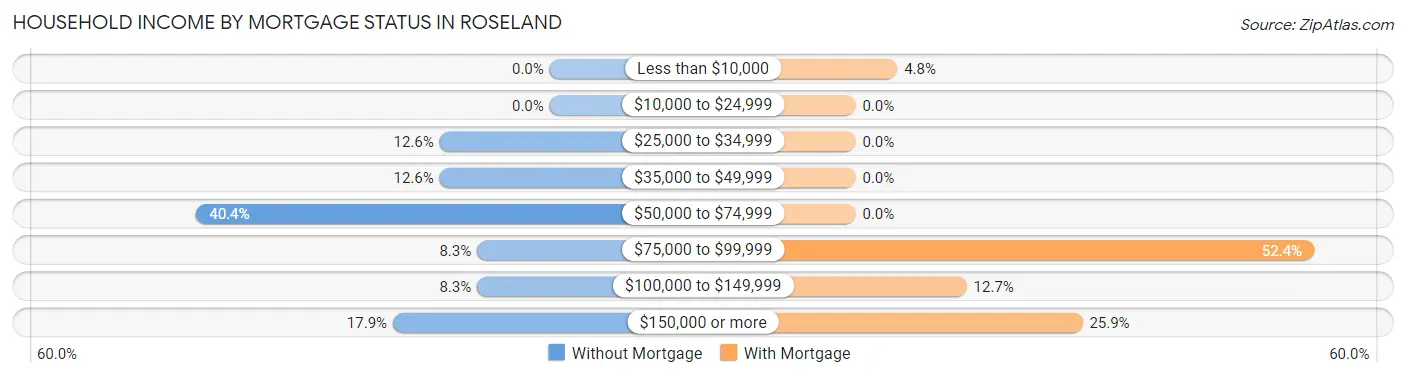
| Household Income | Without Mortgage | With Mortgage |
| Less than $10,000 | 0 (0.0%) | 9 (4.8%) |
| $10,000 to $24,999 | 0 (0.0%) | 0 (0.0%) |
| $25,000 to $34,999 | 47 (12.6%) | 0 (0.0%) |
| $35,000 to $49,999 | 47 (12.6%) | 0 (0.0%) |
| $50,000 to $74,999 | 151 (40.4%) | 0 (0.0%) |
| $75,000 to $99,999 | 31 (8.3%) | 99 (52.4%) |
| $100,000 to $149,999 | 31 (8.3%) | 24 (12.7%) |
| $150,000 or more | 67 (17.9%) | 49 (25.9%) |
| Total | 374 (100.0%) | 189 (100.0%) |
Property Value to Household Income Ratio in Roseland
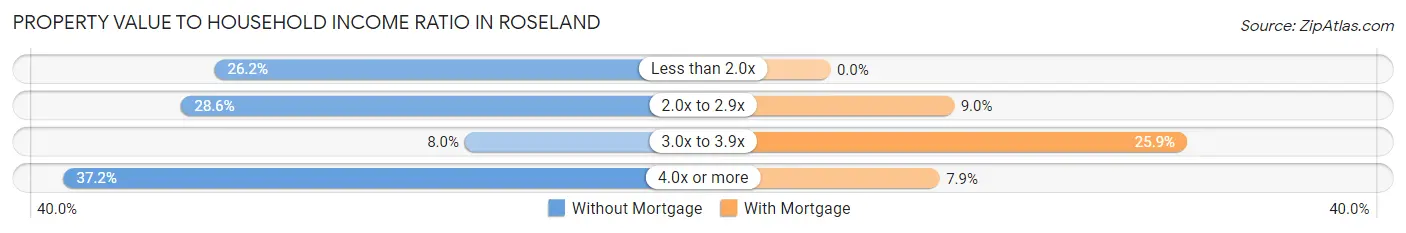
| Value-to-Income Ratio | Without Mortgage | With Mortgage |
| Less than 2.0x | 98 (26.2%) | 0 (0.0%) |
| 2.0x to 2.9x | 107 (28.6%) | 17 (9.0%) |
| 3.0x to 3.9x | 30 (8.0%) | 49 (25.9%) |
| 4.0x or more | 139 (37.2%) | 15 (7.9%) |
| Total | 374 (100.0%) | 189 (100.0%) |
Real Estate Taxes by Mortgage Status in Roseland
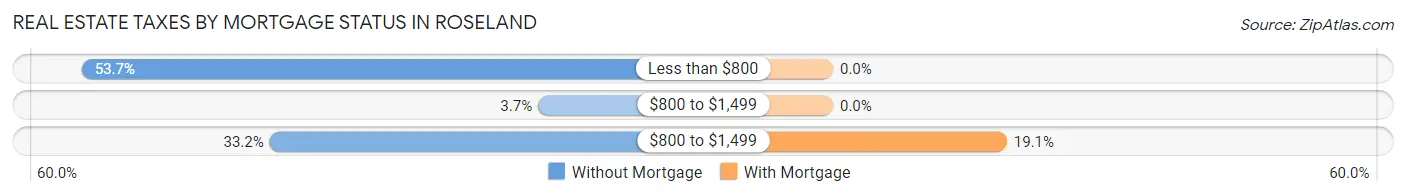
| Property Taxes | Without Mortgage | With Mortgage |
| Less than $800 | 201 (53.7%) | 0 (0.0%) |
| $800 to $1,499 | 14 (3.7%) | 0 (0.0%) |
| $800 to $1,499 | 124 (33.2%) | 36 (19.1%) |
| Total | 374 (100.0%) | 189 (100.0%) |
Health & Disability in Roseland
Health Insurance Coverage by Age in Roseland
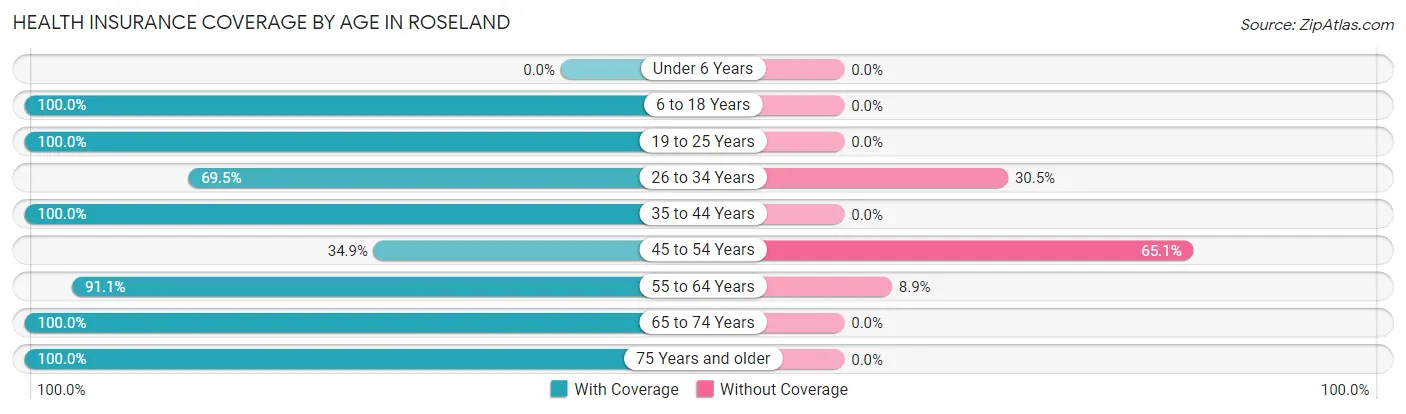
| Age Bracket | With Coverage | Without Coverage |
| Under 6 Years | 0 (0.0%) | 0 (0.0%) |
| 6 to 18 Years | 52 (100.0%) | 0 (0.0%) |
| 19 to 25 Years | 29 (100.0%) | 0 (0.0%) |
| 26 to 34 Years | 107 (69.5%) | 47 (30.5%) |
| 35 to 44 Years | 97 (100.0%) | 0 (0.0%) |
| 45 to 54 Years | 15 (34.9%) | 28 (65.1%) |
| 55 to 64 Years | 380 (91.1%) | 37 (8.9%) |
| 65 to 74 Years | 383 (100.0%) | 0 (0.0%) |
| 75 Years and older | 198 (100.0%) | 0 (0.0%) |
| Total | 1,261 (91.8%) | 112 (8.2%) |
Health Insurance Coverage by Citizenship Status in Roseland
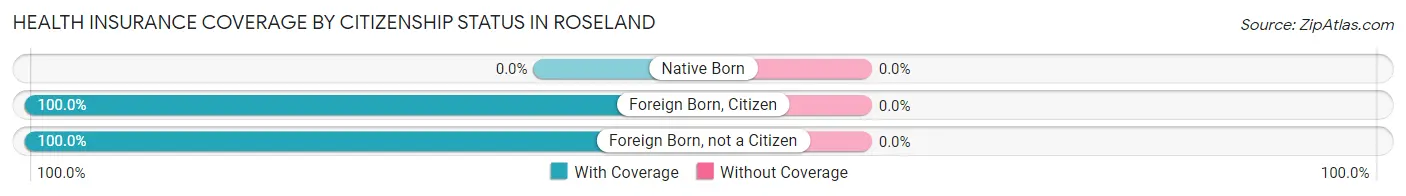
| Citizenship Status | With Coverage | Without Coverage |
| Native Born | 0 (0.0%) | 0 (0.0%) |
| Foreign Born, Citizen | 52 (100.0%) | 0 (0.0%) |
| Foreign Born, not a Citizen | 29 (100.0%) | 0 (0.0%) |
Health Insurance Coverage by Household Income in Roseland
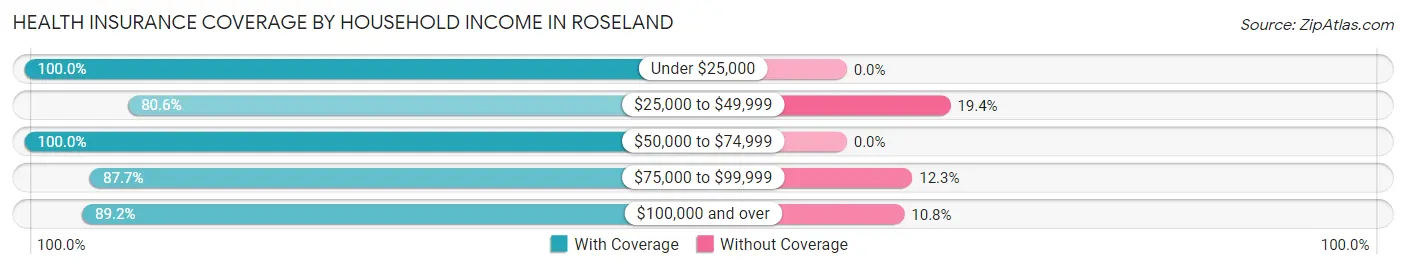
| Household Income | With Coverage | Without Coverage |
| Under $25,000 | 64 (100.0%) | 0 (0.0%) |
| $25,000 to $49,999 | 195 (80.6%) | 47 (19.4%) |
| $50,000 to $74,999 | 496 (100.0%) | 0 (0.0%) |
| $75,000 to $99,999 | 200 (87.7%) | 28 (12.3%) |
| $100,000 and over | 306 (89.2%) | 37 (10.8%) |
Public vs Private Health Insurance Coverage by Age in Roseland
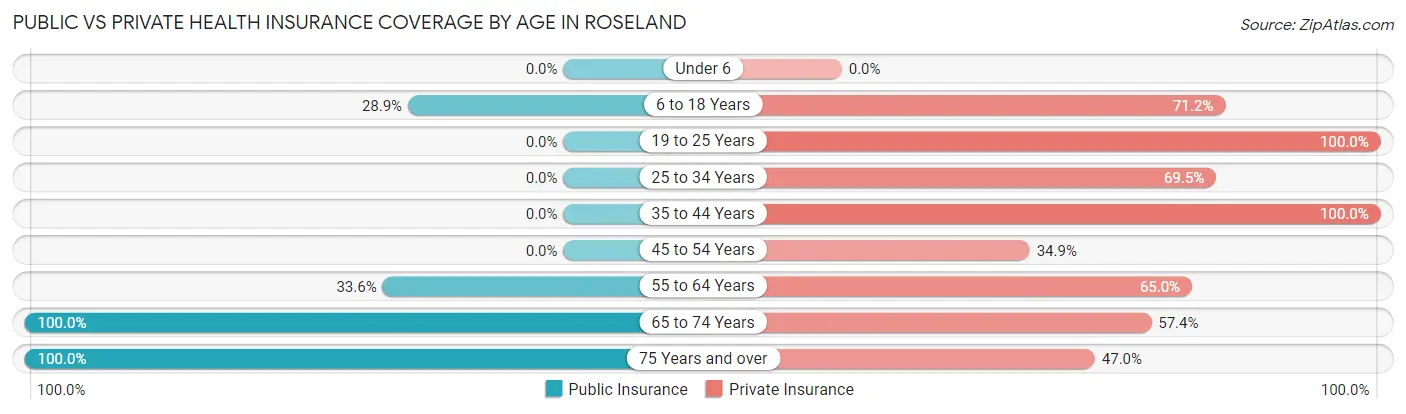
| Age Bracket | Public Insurance | Private Insurance |
| Under 6 | 0 (0.0%) | 0 (0.0%) |
| 6 to 18 Years | 15 (28.8%) | 37 (71.2%) |
| 19 to 25 Years | 0 (0.0%) | 29 (100.0%) |
| 25 to 34 Years | 0 (0.0%) | 107 (69.5%) |
| 35 to 44 Years | 0 (0.0%) | 97 (100.0%) |
| 45 to 54 Years | 0 (0.0%) | 15 (34.9%) |
| 55 to 64 Years | 140 (33.6%) | 271 (65.0%) |
| 65 to 74 Years | 383 (100.0%) | 220 (57.4%) |
| 75 Years and over | 198 (100.0%) | 93 (47.0%) |
| Total | 736 (53.6%) | 869 (63.3%) |
Disability Status by Sex by Age in Roseland
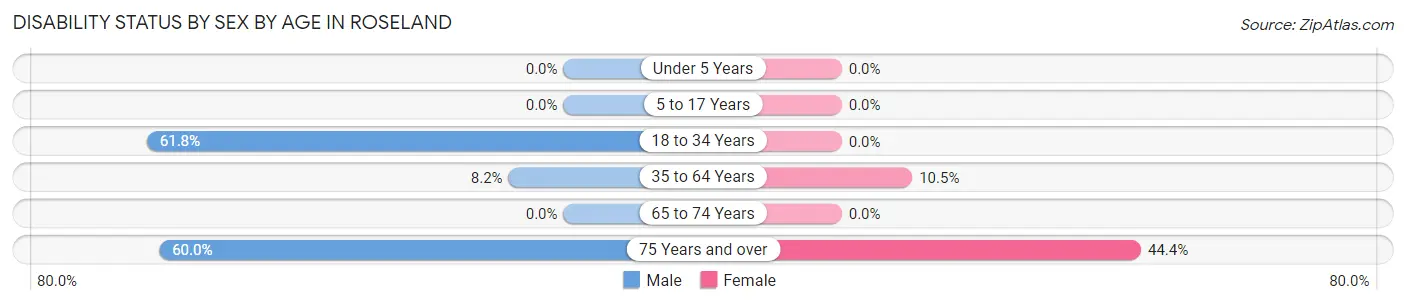
| Age Bracket | Male | Female |
| Under 5 Years | 0 (0.0%) | 0 (0.0%) |
| 5 to 17 Years | 0 (0.0%) | 0 (0.0%) |
| 18 to 34 Years | 47 (61.8%) | 0 (0.0%) |
| 35 to 64 Years | 15 (8.2%) | 39 (10.5%) |
| 65 to 74 Years | 0 (0.0%) | 0 (0.0%) |
| 75 Years and over | 54 (60.0%) | 48 (44.4%) |
Disability Class by Sex by Age in Roseland
Disability Class: Hearing Difficulty
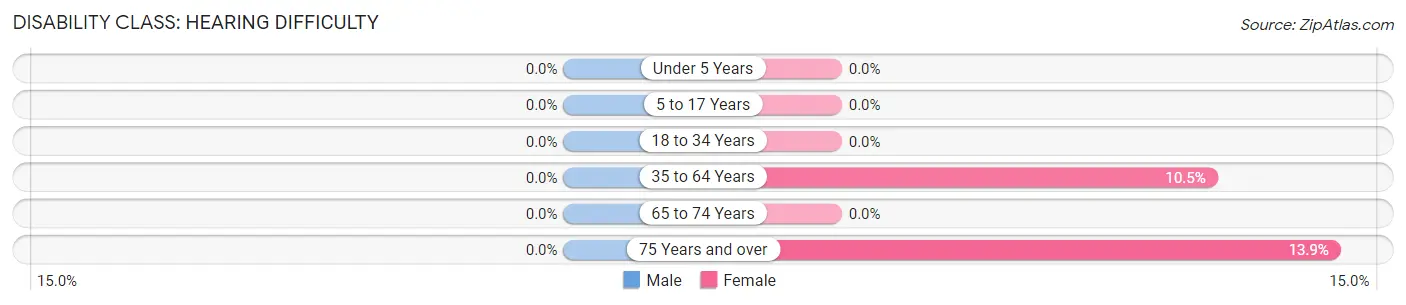
| Age Bracket | Male | Female |
| Under 5 Years | 0 (0.0%) | 0 (0.0%) |
| 5 to 17 Years | 0 (0.0%) | 0 (0.0%) |
| 18 to 34 Years | 0 (0.0%) | 0 (0.0%) |
| 35 to 64 Years | 0 (0.0%) | 39 (10.5%) |
| 65 to 74 Years | 0 (0.0%) | 0 (0.0%) |
| 75 Years and over | 0 (0.0%) | 15 (13.9%) |
Disability Class: Vision Difficulty
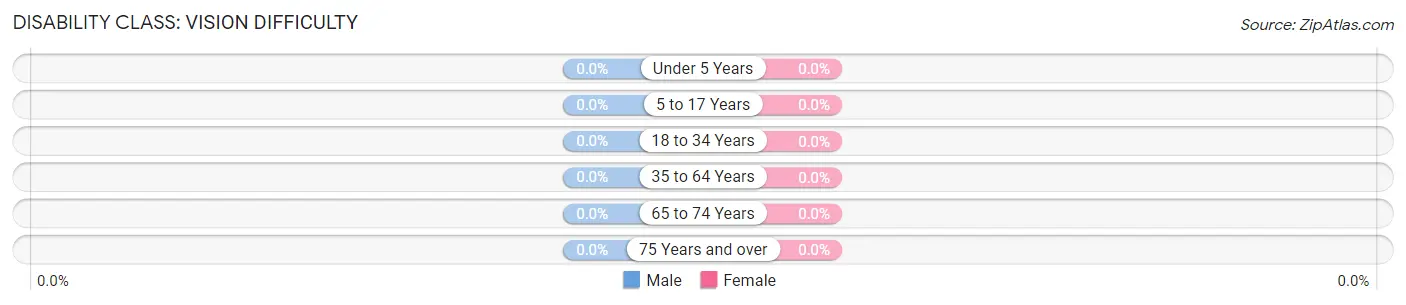
| Age Bracket | Male | Female |
| Under 5 Years | 0 (0.0%) | 0 (0.0%) |
| 5 to 17 Years | 0 (0.0%) | 0 (0.0%) |
| 18 to 34 Years | 0 (0.0%) | 0 (0.0%) |
| 35 to 64 Years | 0 (0.0%) | 0 (0.0%) |
| 65 to 74 Years | 0 (0.0%) | 0 (0.0%) |
| 75 Years and over | 0 (0.0%) | 0 (0.0%) |
Disability Class: Cognitive Difficulty
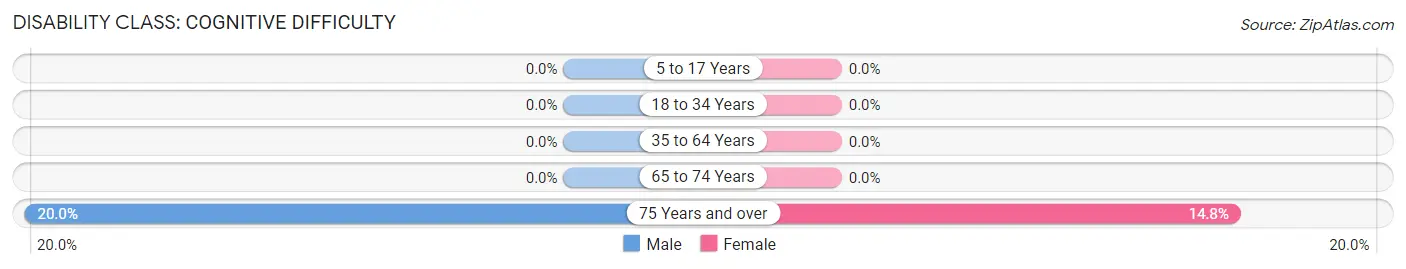
| Age Bracket | Male | Female |
| 5 to 17 Years | 0 (0.0%) | 0 (0.0%) |
| 18 to 34 Years | 0 (0.0%) | 0 (0.0%) |
| 35 to 64 Years | 0 (0.0%) | 0 (0.0%) |
| 65 to 74 Years | 0 (0.0%) | 0 (0.0%) |
| 75 Years and over | 18 (20.0%) | 16 (14.8%) |
Disability Class: Ambulatory Difficulty
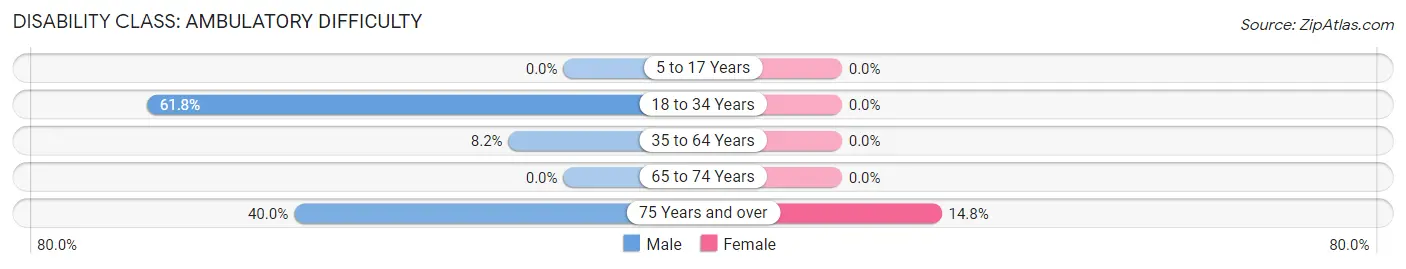
| Age Bracket | Male | Female |
| 5 to 17 Years | 0 (0.0%) | 0 (0.0%) |
| 18 to 34 Years | 47 (61.8%) | 0 (0.0%) |
| 35 to 64 Years | 15 (8.2%) | 0 (0.0%) |
| 65 to 74 Years | 0 (0.0%) | 0 (0.0%) |
| 75 Years and over | 36 (40.0%) | 16 (14.8%) |
Disability Class: Self-Care Difficulty
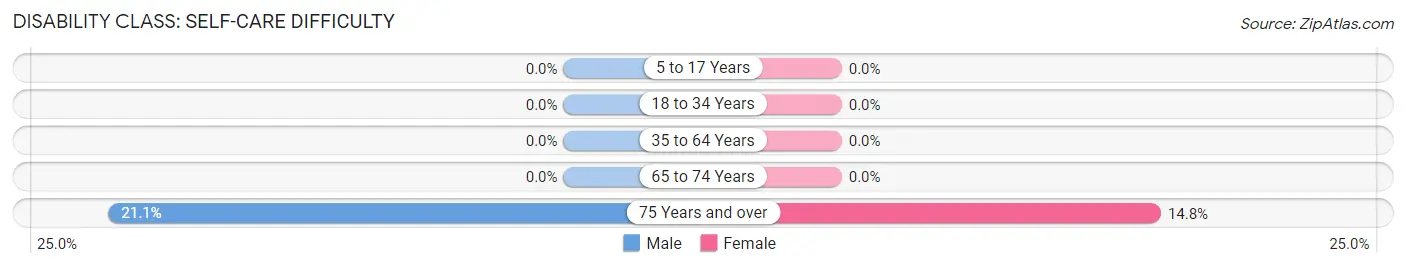
| Age Bracket | Male | Female |
| 5 to 17 Years | 0 (0.0%) | 0 (0.0%) |
| 18 to 34 Years | 0 (0.0%) | 0 (0.0%) |
| 35 to 64 Years | 0 (0.0%) | 0 (0.0%) |
| 65 to 74 Years | 0 (0.0%) | 0 (0.0%) |
| 75 Years and over | 19 (21.1%) | 16 (14.8%) |
Technology Access in Roseland
Computing Device Access in Roseland
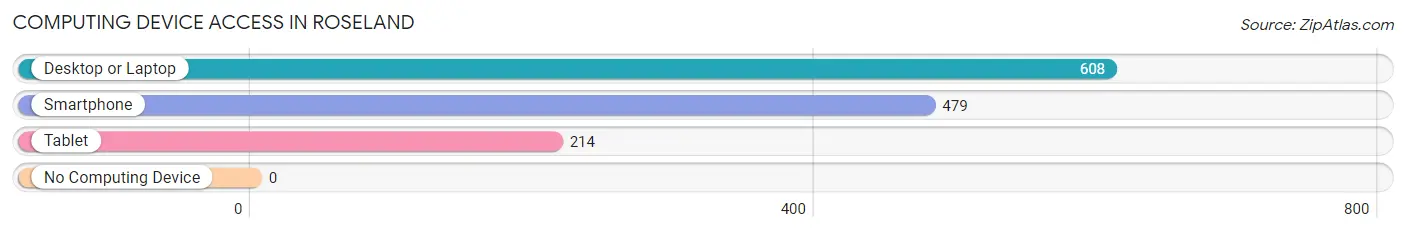
| Device Type | # Households | % Households |
| Desktop or Laptop | 608 | 92.5% |
| Smartphone | 479 | 72.9% |
| Tablet | 214 | 32.6% |
| No Computing Device | 0 | 0.0% |
| Total | 657 | 100.0% |
Internet Access in Roseland
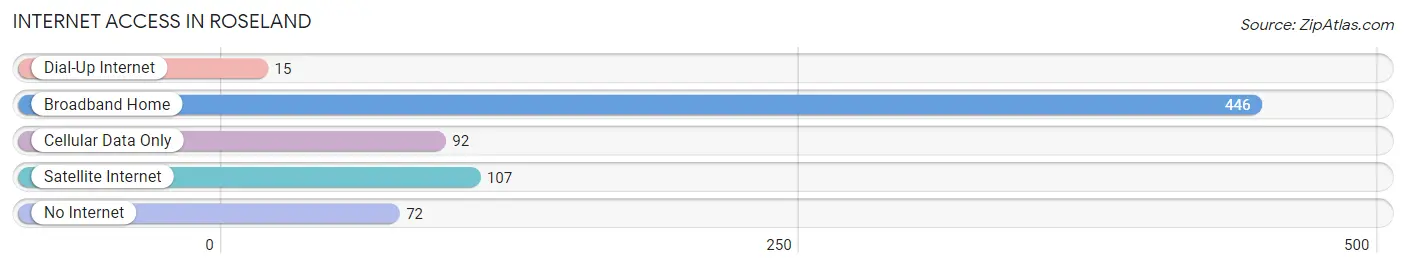
| Internet Type | # Households | % Households |
| Dial-Up Internet | 15 | 2.3% |
| Broadband Home | 446 | 67.9% |
| Cellular Data Only | 92 | 14.0% |
| Satellite Internet | 107 | 16.3% |
| No Internet | 72 | 11.0% |
| Total | 657 | 100.0% |
Roseland Summary
History
The small town of Roseland, Florida is located in Indian River County, in the Treasure Coast region of the state. The area was first settled in the late 1800s by a group of settlers from the nearby town of Vero Beach. The settlers were attracted to the area due to its abundance of natural resources, including timber, fish, and game. The town was officially established in 1891 and was named after the wild roses that grew in the area.
The town of Roseland was originally a farming community, with the main crops being citrus, vegetables, and sugar cane. The town also had a thriving lumber industry, with several sawmills located in the area. In the early 1900s, the town began to grow and develop, with the construction of a railroad line and the opening of a post office.
In the 1920s, the town experienced a period of growth and prosperity, with the opening of several stores, a bank, and a hotel. The town also had a movie theater and a bowling alley. The town continued to grow and develop throughout the 20th century, with the opening of a library, a hospital, and a community center.
Geography
Roseland is located in Indian River County, in the Treasure Coast region of Florida. The town is situated on the Indian River Lagoon, which is part of the Intracoastal Waterway. The town is bordered by the cities of Vero Beach to the north, Sebastian to the south, and Fort Pierce to the east.
The town of Roseland covers an area of approximately 1.5 square miles, with a population of approximately 1,500 people. The town is located at an elevation of 10 feet above sea level. The climate in Roseland is subtropical, with hot, humid summers and mild winters.
Economy
The economy of Roseland is largely based on tourism and agriculture. The town is home to several tourist attractions, including the Indian River Lagoon, the Sebastian Inlet State Park, and the Pelican Island National Wildlife Refuge. The town also has several marinas, boat ramps, and fishing charters.
Agriculture is also an important part of the local economy, with the main crops being citrus, vegetables, and sugar cane. The town also has several nurseries and greenhouses.
Demographics
As of the 2010 census, the population of Roseland was 1,500 people. The racial makeup of the town was 94.7% White, 1.3% African American, 0.7% Native American, 0.7% Asian, 0.3% Pacific Islander, and 2.0% from other races. The median household income in Roseland was $41,250, and the median family income was $50,000. The per capita income in Roseland was $20,000.
Common Questions
What is Per Capita Income in Roseland?
Per Capita income in Roseland is $40,186.
What is the Median Family Income in Roseland?
Median Family Income in Roseland is $63,750.
What is the Median Household income in Roseland?
Median Household Income in Roseland is $62,520.
What is Inequality or Gini Index in Roseland?
Inequality or Gini Index in Roseland is 0.33.
What is the Total Population of Roseland?
Total Population of Roseland is 1,377.
What is the Total Male Population of Roseland?
Total Male Population of Roseland is 639.
What is the Total Female Population of Roseland?
Total Female Population of Roseland is 738.
What is the Ratio of Males per 100 Females in Roseland?
There are 86.59 Males per 100 Females in Roseland.
What is the Ratio of Females per 100 Males in Roseland?
There are 115.49 Females per 100 Males in Roseland.
What is the Median Population Age in Roseland?
Median Population Age in Roseland is 63.2 Years.
What is the Average Family Size in Roseland
Average Family Size in Roseland is 2.4 People.
What is the Average Household Size in Roseland
Average Household Size in Roseland is 2.1 People.
How Large is the Labor Force in Roseland?
There are 666 People in the Labor Forcein in Roseland.
What is the Percentage of People in the Labor Force in Roseland?
50.3% of People are in the Labor Force in Roseland.