Somali vs Immigrants from Vietnam Disability Age 5 to 17
COMPARE
Somali
Immigrants from Vietnam
Disability Age 5 to 17
Disability Age 5 to 17 Comparison
Somalis
Immigrants from Vietnam
5.9%
DISABILITY AGE 5 TO 17
0.8/ 100
METRIC RATING
260th/ 347
METRIC RANK
5.2%
DISABILITY AGE 5 TO 17
99.7/ 100
METRIC RATING
72nd/ 347
METRIC RANK
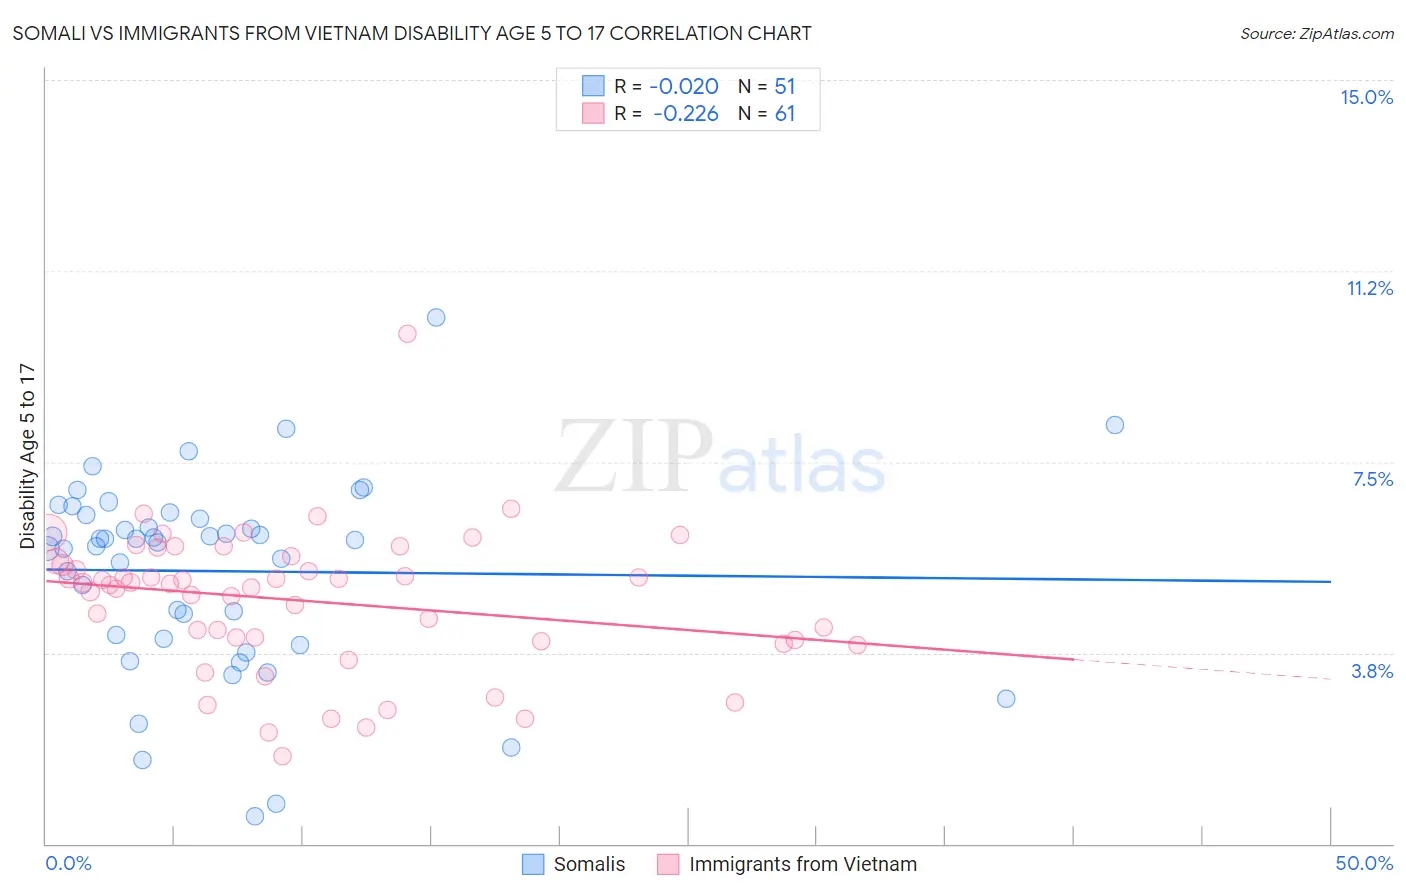
Somali vs Immigrants from Vietnam Disability Age 5 to 17 Correlation Chart
The statistical analysis conducted on geographies consisting of 99,029,276 people shows no correlation between the proportion of Somalis and percentage of population with a disability between the ages 5 and 17 in the United States with a correlation coefficient (R) of -0.020 and weighted average of 5.9%. Similarly, the statistical analysis conducted on geographies consisting of 402,102,659 people shows a weak negative correlation between the proportion of Immigrants from Vietnam and percentage of population with a disability between the ages 5 and 17 in the United States with a correlation coefficient (R) of -0.226 and weighted average of 5.2%, a difference of 14.1%.
Disability Age 5 to 17 Correlation Summary
| Measurement | Somali | Immigrants from Vietnam |
| Minimum | 0.54% | 1.7% |
| Maximum | 10.3% | 10.0% |
| Range | 9.8% | 8.3% |
| Mean | 5.4% | 4.8% |
| Median | 6.0% | 5.1% |
| Interquartile 25% (IQ1) | 4.0% | 4.0% |
| Interquartile 75% (IQ3) | 6.5% | 5.6% |
| Interquartile Range (IQR) | 2.4% | 1.6% |
| Standard Deviation (Sample) | 1.9% | 1.4% |
| Standard Deviation (Population) | 1.9% | 1.4% |
Similar Demographics by Disability Age 5 to 17
Demographics Similar to Somalis by Disability Age 5 to 17
In terms of disability age 5 to 17, the demographic groups most similar to Somalis are Immigrants from Middle Africa (5.9%, a difference of 0.070%), Immigrants from Western Africa (5.9%, a difference of 0.10%), Slavic (5.9%, a difference of 0.13%), Czechoslovakian (5.9%, a difference of 0.18%), and Brazilian (5.9%, a difference of 0.19%).
| Demographics | Rating | Rank | Disability Age 5 to 17 |
| Scandinavians | 1.4 /100 | #253 | Tragic 5.9% |
| Barbadians | 1.3 /100 | #254 | Tragic 5.9% |
| Italians | 1.2 /100 | #255 | Tragic 5.9% |
| Hopi | 1.0 /100 | #256 | Tragic 5.9% |
| Hispanics or Latinos | 1.0 /100 | #257 | Tragic 5.9% |
| Brazilians | 0.9 /100 | #258 | Tragic 5.9% |
| Slavs | 0.9 /100 | #259 | Tragic 5.9% |
| Somalis | 0.8 /100 | #260 | Tragic 5.9% |
| Immigrants | Middle Africa | 0.7 /100 | #261 | Tragic 5.9% |
| Immigrants | Western Africa | 0.7 /100 | #262 | Tragic 5.9% |
| Czechoslovakians | 0.7 /100 | #263 | Tragic 5.9% |
| Canadians | 0.6 /100 | #264 | Tragic 6.0% |
| Panamanians | 0.6 /100 | #265 | Tragic 6.0% |
| Slovenes | 0.6 /100 | #266 | Tragic 6.0% |
| Spanish | 0.5 /100 | #267 | Tragic 6.0% |
Demographics Similar to Immigrants from Vietnam by Disability Age 5 to 17
In terms of disability age 5 to 17, the demographic groups most similar to Immigrants from Vietnam are Jordanian (5.2%, a difference of 0.020%), Immigrants from Czechoslovakia (5.2%, a difference of 0.020%), Immigrants from Belgium (5.2%, a difference of 0.070%), Immigrants from Romania (5.2%, a difference of 0.090%), and Guyanese (5.2%, a difference of 0.11%).
| Demographics | Rating | Rank | Disability Age 5 to 17 |
| Immigrants | Greece | 99.8 /100 | #65 | Exceptional 5.2% |
| Palestinians | 99.8 /100 | #66 | Exceptional 5.2% |
| Macedonians | 99.8 /100 | #67 | Exceptional 5.2% |
| Immigrants | Syria | 99.7 /100 | #68 | Exceptional 5.2% |
| Guyanese | 99.7 /100 | #69 | Exceptional 5.2% |
| Immigrants | Belgium | 99.7 /100 | #70 | Exceptional 5.2% |
| Jordanians | 99.7 /100 | #71 | Exceptional 5.2% |
| Immigrants | Vietnam | 99.7 /100 | #72 | Exceptional 5.2% |
| Immigrants | Czechoslovakia | 99.7 /100 | #73 | Exceptional 5.2% |
| Immigrants | Romania | 99.7 /100 | #74 | Exceptional 5.2% |
| Immigrants | Moldova | 99.6 /100 | #75 | Exceptional 5.2% |
| Immigrants | Guyana | 99.6 /100 | #76 | Exceptional 5.2% |
| Immigrants | Kazakhstan | 99.6 /100 | #77 | Exceptional 5.2% |
| Immigrants | Cuba | 99.6 /100 | #78 | Exceptional 5.2% |
| Afghans | 99.6 /100 | #79 | Exceptional 5.2% |