Somali vs Immigrants from Netherlands Disability Age 5 to 17
COMPARE
Somali
Immigrants from Netherlands
Disability Age 5 to 17
Disability Age 5 to 17 Comparison
Somalis
Immigrants from Netherlands
5.9%
DISABILITY AGE 5 TO 17
0.8/ 100
METRIC RATING
260th/ 347
METRIC RANK
5.4%
DISABILITY AGE 5 TO 17
90.5/ 100
METRIC RATING
140th/ 347
METRIC RANK
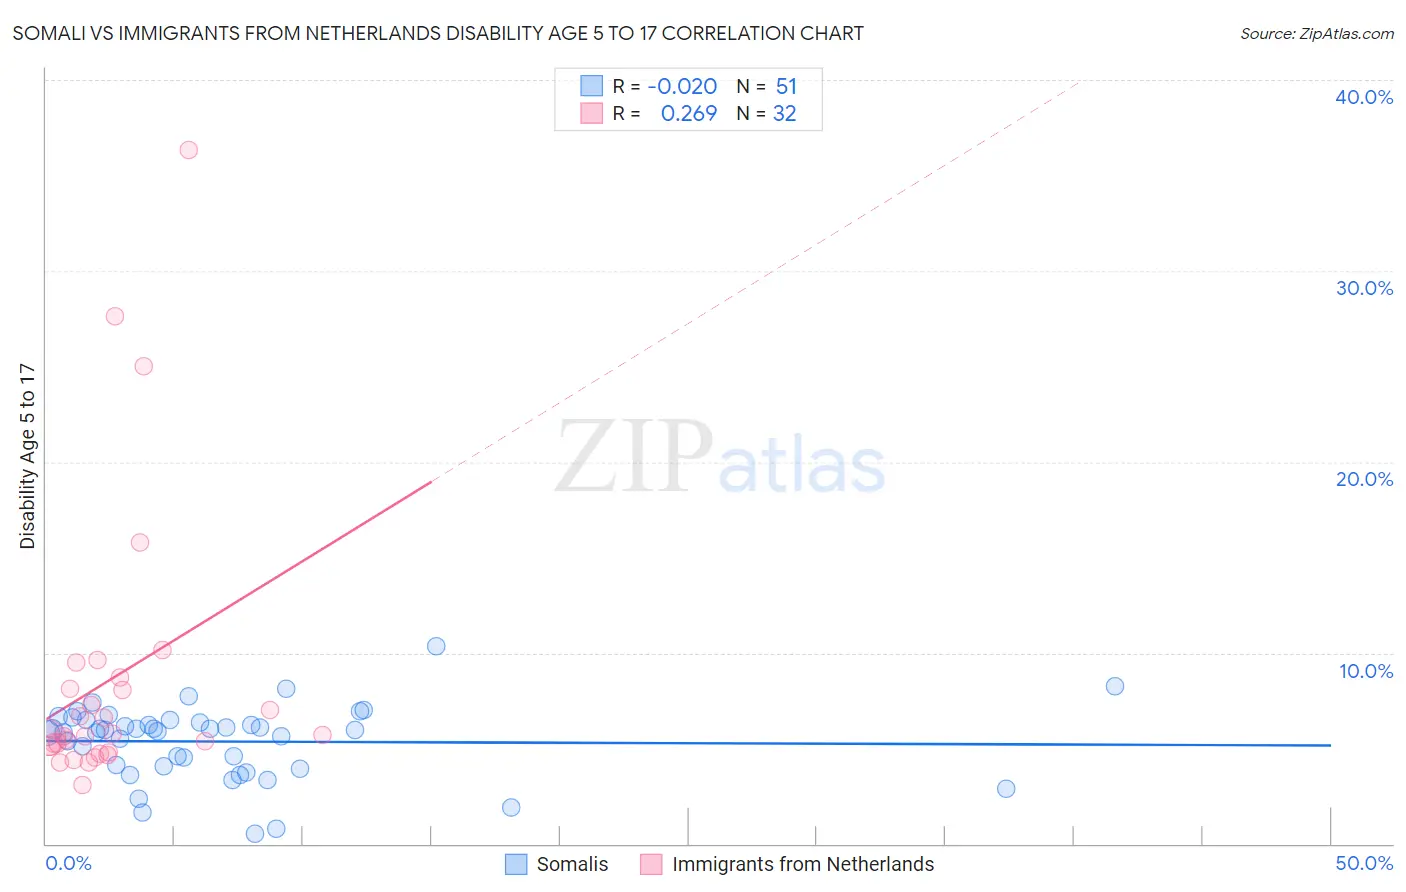
Somali vs Immigrants from Netherlands Disability Age 5 to 17 Correlation Chart
The statistical analysis conducted on geographies consisting of 99,029,276 people shows no correlation between the proportion of Somalis and percentage of population with a disability between the ages 5 and 17 in the United States with a correlation coefficient (R) of -0.020 and weighted average of 5.9%. Similarly, the statistical analysis conducted on geographies consisting of 236,298,961 people shows a weak positive correlation between the proportion of Immigrants from Netherlands and percentage of population with a disability between the ages 5 and 17 in the United States with a correlation coefficient (R) of 0.269 and weighted average of 5.4%, a difference of 9.0%.
Disability Age 5 to 17 Correlation Summary
| Measurement | Somali | Immigrants from Netherlands |
| Minimum | 0.54% | 3.1% |
| Maximum | 10.3% | 36.4% |
| Range | 9.8% | 33.3% |
| Mean | 5.4% | 8.6% |
| Median | 6.0% | 5.7% |
| Interquartile 25% (IQ1) | 4.0% | 5.0% |
| Interquartile 75% (IQ3) | 6.5% | 8.4% |
| Interquartile Range (IQR) | 2.4% | 3.5% |
| Standard Deviation (Sample) | 1.9% | 7.4% |
| Standard Deviation (Population) | 1.9% | 7.3% |
Similar Demographics by Disability Age 5 to 17
Demographics Similar to Somalis by Disability Age 5 to 17
In terms of disability age 5 to 17, the demographic groups most similar to Somalis are Immigrants from Middle Africa (5.9%, a difference of 0.070%), Immigrants from Western Africa (5.9%, a difference of 0.10%), Slavic (5.9%, a difference of 0.13%), Czechoslovakian (5.9%, a difference of 0.18%), and Brazilian (5.9%, a difference of 0.19%).
| Demographics | Rating | Rank | Disability Age 5 to 17 |
| Scandinavians | 1.4 /100 | #253 | Tragic 5.9% |
| Barbadians | 1.3 /100 | #254 | Tragic 5.9% |
| Italians | 1.2 /100 | #255 | Tragic 5.9% |
| Hopi | 1.0 /100 | #256 | Tragic 5.9% |
| Hispanics or Latinos | 1.0 /100 | #257 | Tragic 5.9% |
| Brazilians | 0.9 /100 | #258 | Tragic 5.9% |
| Slavs | 0.9 /100 | #259 | Tragic 5.9% |
| Somalis | 0.8 /100 | #260 | Tragic 5.9% |
| Immigrants | Middle Africa | 0.7 /100 | #261 | Tragic 5.9% |
| Immigrants | Western Africa | 0.7 /100 | #262 | Tragic 5.9% |
| Czechoslovakians | 0.7 /100 | #263 | Tragic 5.9% |
| Canadians | 0.6 /100 | #264 | Tragic 6.0% |
| Panamanians | 0.6 /100 | #265 | Tragic 6.0% |
| Slovenes | 0.6 /100 | #266 | Tragic 6.0% |
| Spanish | 0.5 /100 | #267 | Tragic 6.0% |
Demographics Similar to Immigrants from Netherlands by Disability Age 5 to 17
In terms of disability age 5 to 17, the demographic groups most similar to Immigrants from Netherlands are Immigrants from Oceania (5.4%, a difference of 0.050%), Belizean (5.4%, a difference of 0.050%), Navajo (5.4%, a difference of 0.060%), Immigrants from Denmark (5.4%, a difference of 0.14%), and South American Indian (5.5%, a difference of 0.17%).
| Demographics | Rating | Rank | Disability Age 5 to 17 |
| Venezuelans | 92.7 /100 | #133 | Exceptional 5.4% |
| Yuman | 92.3 /100 | #134 | Exceptional 5.4% |
| Immigrants | Belize | 91.7 /100 | #135 | Exceptional 5.4% |
| Immigrants | Denmark | 91.4 /100 | #136 | Exceptional 5.4% |
| Navajo | 90.9 /100 | #137 | Exceptional 5.4% |
| Immigrants | Oceania | 90.8 /100 | #138 | Exceptional 5.4% |
| Belizeans | 90.8 /100 | #139 | Exceptional 5.4% |
| Immigrants | Netherlands | 90.5 /100 | #140 | Exceptional 5.4% |
| South American Indians | 89.3 /100 | #141 | Excellent 5.5% |
| Colombians | 88.0 /100 | #142 | Excellent 5.5% |
| Immigrants | Hungary | 87.9 /100 | #143 | Excellent 5.5% |
| Pakistanis | 87.3 /100 | #144 | Excellent 5.5% |
| Immigrants | Guatemala | 86.6 /100 | #145 | Excellent 5.5% |
| Albanians | 83.7 /100 | #146 | Excellent 5.5% |
| Immigrants | Albania | 83.1 /100 | #147 | Excellent 5.5% |