Somali 2 or more Vehicles in Household
COMPARE
Somali
Select to Compare
2 or more Vehicles in Household
Somali 2 or more Vehicles in Household
51.1%
2+ VEHICLES AVAILABLE
0.0/ 100
METRIC RATING
289th/ 347
METRIC RANK
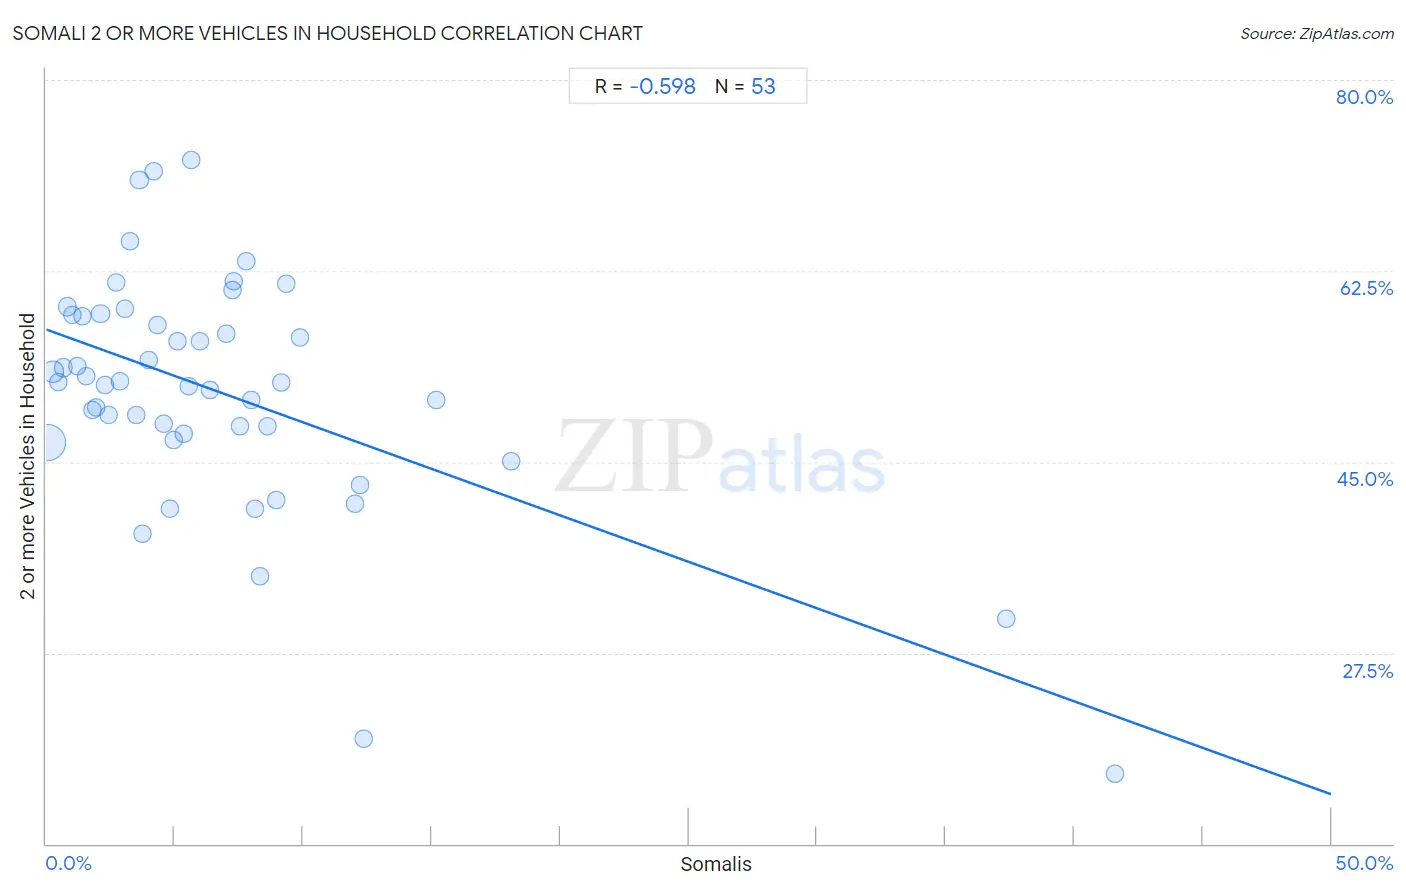
Somali 2 or more Vehicles in Household Correlation Chart
The statistical analysis conducted on geographies consisting of 99,288,956 people shows a substantial negative correlation between the proportion of Somalis and percentage of households with 2 or more vehicles available in the United States with a correlation coefficient (R) of -0.598 and weighted average of 51.1%. On average, for every 1% (one percent) increase in Somalis within a typical geography, there is a decrease of 0.85% in percentage of households with 2 or more vehicles available.
It is essential to understand that the correlation between the percentage of Somalis and percentage of households with 2 or more vehicles available does not imply a direct cause-and-effect relationship. It remains uncertain whether the presence of Somalis influences an upward or downward trend in the level of percentage of households with 2 or more vehicles available within an area, or if Somalis simply ended up residing in those areas with higher or lower levels of percentage of households with 2 or more vehicles available due to other factors.
Demographics Similar to Somalis by 2 or more Vehicles in Household
In terms of 2 or more vehicles in household, the demographic groups most similar to Somalis are Immigrants from Panama (51.1%, a difference of 0.060%), Belizean (51.0%, a difference of 0.10%), Okinawan (51.2%, a difference of 0.28%), Immigrants from Serbia (51.3%, a difference of 0.40%), and Immigrants from Liberia (51.3%, a difference of 0.42%).
| Demographics | Rating | Rank | 2 or more Vehicles in Household |
| Bahamians | 0.1 /100 | #282 | Tragic 51.5% |
| Immigrants from China | 0.1 /100 | #283 | Tragic 51.5% |
| Immigrants from Zaire | 0.1 /100 | #284 | Tragic 51.5% |
| Immigrants from Uruguay | 0.1 /100 | #285 | Tragic 51.4% |
| Immigrants from Liberia | 0.1 /100 | #286 | Tragic 51.3% |
| Immigrants from Serbia | 0.1 /100 | #287 | Tragic 51.3% |
| Okinawans | 0.1 /100 | #288 | Tragic 51.2% |
| Somalis | 0.0 /100 | #289 | Tragic 51.1% |
| Immigrants from Panama | 0.0 /100 | #290 | Tragic 51.1% |
| Belizeans | 0.0 /100 | #291 | Tragic 51.0% |
| Immigrants from Ukraine | 0.0 /100 | #292 | Tragic 50.9% |
| Blacks/African Americans | 0.0 /100 | #293 | Tragic 50.9% |
| Bermudans | 0.0 /100 | #294 | Tragic 50.6% |
| Cypriots | 0.0 /100 | #295 | Tragic 50.6% |
| Immigrants from Somalia | 0.0 /100 | #296 | Tragic 50.5% |
Somali 2 or more Vehicles in Household Correlation Summary
| Measurement | Somali Data | 2 or more Vehicles in Household Data |
| Minimum | 0.041% | 16.4% |
| Maximum | 41.6% | 72.6% |
| Range | 41.5% | 56.2% |
| Mean | 6.7% | 51.4% |
| Median | 4.9% | 52.2% |
| Interquartile 25% (IQ1) | 2.4% | 47.3% |
| Interquartile 75% (IQ3) | 8.2% | 58.4% |
| Interquartile Range (IQR) | 5.8% | 11.1% |
| Standard Deviation (Sample) | 7.6% | 10.9% |
| Standard Deviation (Population) | 7.6% | 10.8% |
Correlation Details
| Somali Percentile | Sample Size | 2 or more Vehicles in Household |
[ 0.0% - 0.5% ] 0.041% | 72,714,347 | 46.8% |
[ 0.0% - 0.5% ] 0.26% | 10,918,541 | 53.3% |
[ 0.0% - 0.5% ] 0.47% | 3,159,487 | 52.3% |
[ 0.5% - 1.0% ] 0.66% | 3,143,096 | 53.7% |
[ 0.5% - 1.0% ] 0.82% | 1,264,222 | 59.2% |
[ 1.0% - 1.5% ] 1.04% | 1,007,768 | 58.5% |
[ 1.0% - 1.5% ] 1.20% | 1,110,250 | 53.8% |
[ 1.0% - 1.5% ] 1.40% | 449,700 | 58.4% |
[ 1.5% - 2.0% ] 1.57% | 659,255 | 52.9% |
[ 1.5% - 2.0% ] 1.78% | 187,013 | 49.8% |
[ 1.5% - 2.0% ] 1.95% | 580,421 | 50.0% |
[ 2.0% - 2.5% ] 2.11% | 250,869 | 58.6% |
[ 2.0% - 2.5% ] 2.28% | 145,273 | 52.1% |
[ 2.0% - 2.5% ] 2.44% | 970,275 | 49.3% |
[ 2.5% - 3.0% ] 2.72% | 220,129 | 61.4% |
[ 2.5% - 3.0% ] 2.86% | 236,661 | 52.4% |
[ 3.0% - 3.5% ] 3.06% | 186,812 | 59.0% |
[ 3.0% - 3.5% ] 3.24% | 143,512 | 65.3% |
[ 3.5% - 4.0% ] 3.51% | 172,840 | 49.3% |
[ 3.5% - 4.0% ] 3.62% | 104,916 | 70.9% |
[ 3.5% - 4.0% ] 3.74% | 17,641 | 38.4% |
[ 3.5% - 4.0% ] 3.99% | 205,658 | 54.4% |
[ 4.0% - 4.5% ] 4.17% | 3,548 | 71.6% |
[ 4.0% - 4.5% ] 4.33% | 54,028 | 57.6% |
[ 4.5% - 5.0% ] 4.58% | 21,569 | 48.5% |
[ 4.5% - 5.0% ] 4.80% | 510,556 | 40.7% |
[ 4.5% - 5.0% ] 4.95% | 122,965 | 47.1% |
[ 5.0% - 5.5% ] 5.11% | 17,532 | 56.1% |
[ 5.0% - 5.5% ] 5.36% | 30,641 | 47.6% |
[ 5.5% - 6.0% ] 5.57% | 88,768 | 51.9% |
[ 5.5% - 6.0% ] 5.65% | 177 | 72.6% |
[ 5.5% - 6.0% ] 5.97% | 23,433 | 56.1% |
[ 6.0% - 6.5% ] 6.37% | 68,910 | 51.6% |
[ 7.0% - 7.5% ] 7.01% | 67,999 | 56.8% |
[ 7.0% - 7.5% ] 7.23% | 42,581 | 60.8% |
[ 7.0% - 7.5% ] 7.31% | 26,760 | 61.6% |
[ 7.5% - 8.0% ] 7.53% | 32,681 | 48.3% |
[ 7.5% - 8.0% ] 7.77% | 30,973 | 63.4% |
[ 7.5% - 8.0% ] 7.98% | 61,423 | 50.7% |
[ 8.0% - 8.5% ] 8.11% | 13,956 | 40.8% |
[ 8.0% - 8.5% ] 8.30% | 24,067 | 34.6% |
[ 8.5% - 9.0% ] 8.63% | 22,827 | 48.3% |
[ 8.5% - 9.0% ] 8.95% | 14,759 | 41.5% |
[ 9.0% - 9.5% ] 9.13% | 23,110 | 52.2% |
[ 9.0% - 9.5% ] 9.36% | 5,984 | 61.3% |
[ 9.5% - 10.0% ] 9.85% | 24,418 | 56.4% |
[ 12.0% - 12.5% ] 12.03% | 32,136 | 41.1% |
[ 12.0% - 12.5% ] 12.22% | 30,625 | 42.9% |
[ 12.0% - 12.5% ] 12.34% | 28,172 | 19.7% |
[ 15.0% - 15.5% ] 15.16% | 3,693 | 50.7% |
[ 18.0% - 18.5% ] 18.08% | 1,930 | 45.1% |
[ 37.0% - 37.5% ] 37.34% | 1,157 | 30.6% |
[ 41.5% - 42.0% ] 41.59% | 8,892 | 16.4% |