Somali vs Immigrants from Hong Kong Disability Age 5 to 17
COMPARE
Somali
Immigrants from Hong Kong
Disability Age 5 to 17
Disability Age 5 to 17 Comparison
Somalis
Immigrants from Hong Kong
5.9%
DISABILITY AGE 5 TO 17
0.8/ 100
METRIC RATING
260th/ 347
METRIC RANK
4.3%
DISABILITY AGE 5 TO 17
100.0/ 100
METRIC RATING
3rd/ 347
METRIC RANK
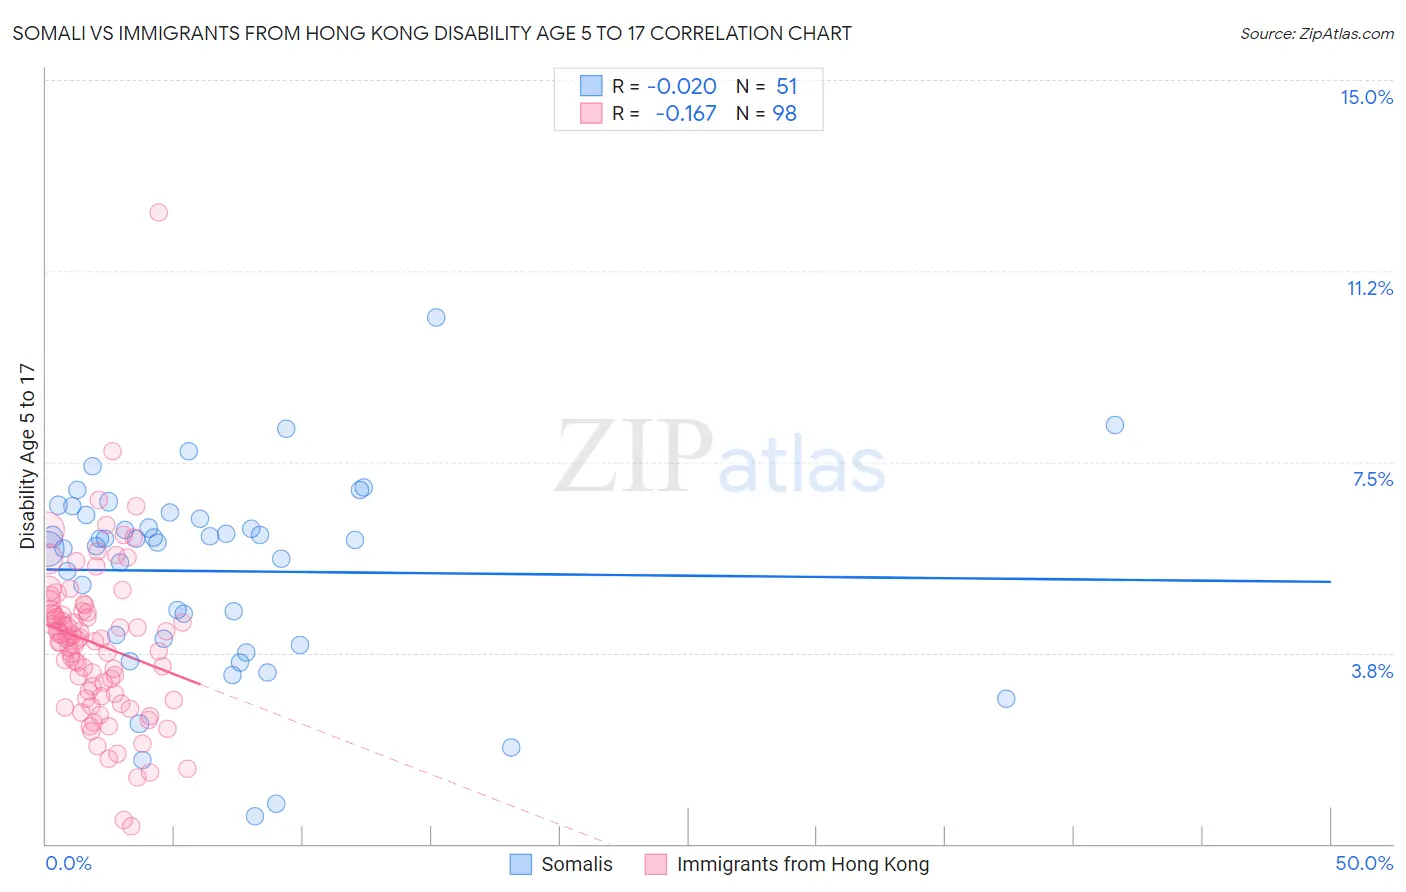
Somali vs Immigrants from Hong Kong Disability Age 5 to 17 Correlation Chart
The statistical analysis conducted on geographies consisting of 99,029,276 people shows no correlation between the proportion of Somalis and percentage of population with a disability between the ages 5 and 17 in the United States with a correlation coefficient (R) of -0.020 and weighted average of 5.9%. Similarly, the statistical analysis conducted on geographies consisting of 252,525,907 people shows a poor negative correlation between the proportion of Immigrants from Hong Kong and percentage of population with a disability between the ages 5 and 17 in the United States with a correlation coefficient (R) of -0.167 and weighted average of 4.3%, a difference of 38.2%.
Disability Age 5 to 17 Correlation Summary
| Measurement | Somali | Immigrants from Hong Kong |
| Minimum | 0.54% | 0.35% |
| Maximum | 10.3% | 12.4% |
| Range | 9.8% | 12.0% |
| Mean | 5.4% | 3.9% |
| Median | 6.0% | 4.0% |
| Interquartile 25% (IQ1) | 4.0% | 2.9% |
| Interquartile 75% (IQ3) | 6.5% | 4.5% |
| Interquartile Range (IQR) | 2.4% | 1.6% |
| Standard Deviation (Sample) | 1.9% | 1.6% |
| Standard Deviation (Population) | 1.9% | 1.6% |
Similar Demographics by Disability Age 5 to 17
Demographics Similar to Somalis by Disability Age 5 to 17
In terms of disability age 5 to 17, the demographic groups most similar to Somalis are Immigrants from Middle Africa (5.9%, a difference of 0.070%), Immigrants from Western Africa (5.9%, a difference of 0.10%), Slavic (5.9%, a difference of 0.13%), Czechoslovakian (5.9%, a difference of 0.18%), and Brazilian (5.9%, a difference of 0.19%).
| Demographics | Rating | Rank | Disability Age 5 to 17 |
| Scandinavians | 1.4 /100 | #253 | Tragic 5.9% |
| Barbadians | 1.3 /100 | #254 | Tragic 5.9% |
| Italians | 1.2 /100 | #255 | Tragic 5.9% |
| Hopi | 1.0 /100 | #256 | Tragic 5.9% |
| Hispanics or Latinos | 1.0 /100 | #257 | Tragic 5.9% |
| Brazilians | 0.9 /100 | #258 | Tragic 5.9% |
| Slavs | 0.9 /100 | #259 | Tragic 5.9% |
| Somalis | 0.8 /100 | #260 | Tragic 5.9% |
| Immigrants | Middle Africa | 0.7 /100 | #261 | Tragic 5.9% |
| Immigrants | Western Africa | 0.7 /100 | #262 | Tragic 5.9% |
| Czechoslovakians | 0.7 /100 | #263 | Tragic 5.9% |
| Canadians | 0.6 /100 | #264 | Tragic 6.0% |
| Panamanians | 0.6 /100 | #265 | Tragic 6.0% |
| Slovenes | 0.6 /100 | #266 | Tragic 6.0% |
| Spanish | 0.5 /100 | #267 | Tragic 6.0% |
Demographics Similar to Immigrants from Hong Kong by Disability Age 5 to 17
In terms of disability age 5 to 17, the demographic groups most similar to Immigrants from Hong Kong are Filipino (4.3%, a difference of 1.0%), Immigrants from Iran (4.4%, a difference of 1.5%), Immigrants from Taiwan (4.2%, a difference of 2.5%), Immigrants from Israel (4.5%, a difference of 5.0%), and Immigrants from China (4.5%, a difference of 5.3%).
| Demographics | Rating | Rank | Disability Age 5 to 17 |
| Immigrants | Armenia | 100.0 /100 | #1 | Exceptional 4.1% |
| Immigrants | Taiwan | 100.0 /100 | #2 | Exceptional 4.2% |
| Immigrants | Hong Kong | 100.0 /100 | #3 | Exceptional 4.3% |
| Filipinos | 100.0 /100 | #4 | Exceptional 4.3% |
| Immigrants | Iran | 100.0 /100 | #5 | Exceptional 4.4% |
| Immigrants | Israel | 100.0 /100 | #6 | Exceptional 4.5% |
| Immigrants | China | 100.0 /100 | #7 | Exceptional 4.5% |
| Indians (Asian) | 100.0 /100 | #8 | Exceptional 4.6% |
| Immigrants | Eastern Asia | 100.0 /100 | #9 | Exceptional 4.6% |
| Immigrants | India | 100.0 /100 | #10 | Exceptional 4.6% |
| Armenians | 100.0 /100 | #11 | Exceptional 4.6% |
| Iranians | 100.0 /100 | #12 | Exceptional 4.6% |
| Thais | 100.0 /100 | #13 | Exceptional 4.7% |
| Immigrants | Korea | 100.0 /100 | #14 | Exceptional 4.7% |
| Chinese | 100.0 /100 | #15 | Exceptional 4.7% |