Immigrants from Sri Lanka vs Brazilian Disability Age 5 to 17
COMPARE
Immigrants from Sri Lanka
Brazilian
Disability Age 5 to 17
Disability Age 5 to 17 Comparison
Immigrants from Sri Lanka
Brazilians
5.0%
DISABILITY AGE 5 TO 17
100.0/ 100
METRIC RATING
42nd/ 347
METRIC RANK
5.9%
DISABILITY AGE 5 TO 17
0.9/ 100
METRIC RATING
258th/ 347
METRIC RANK
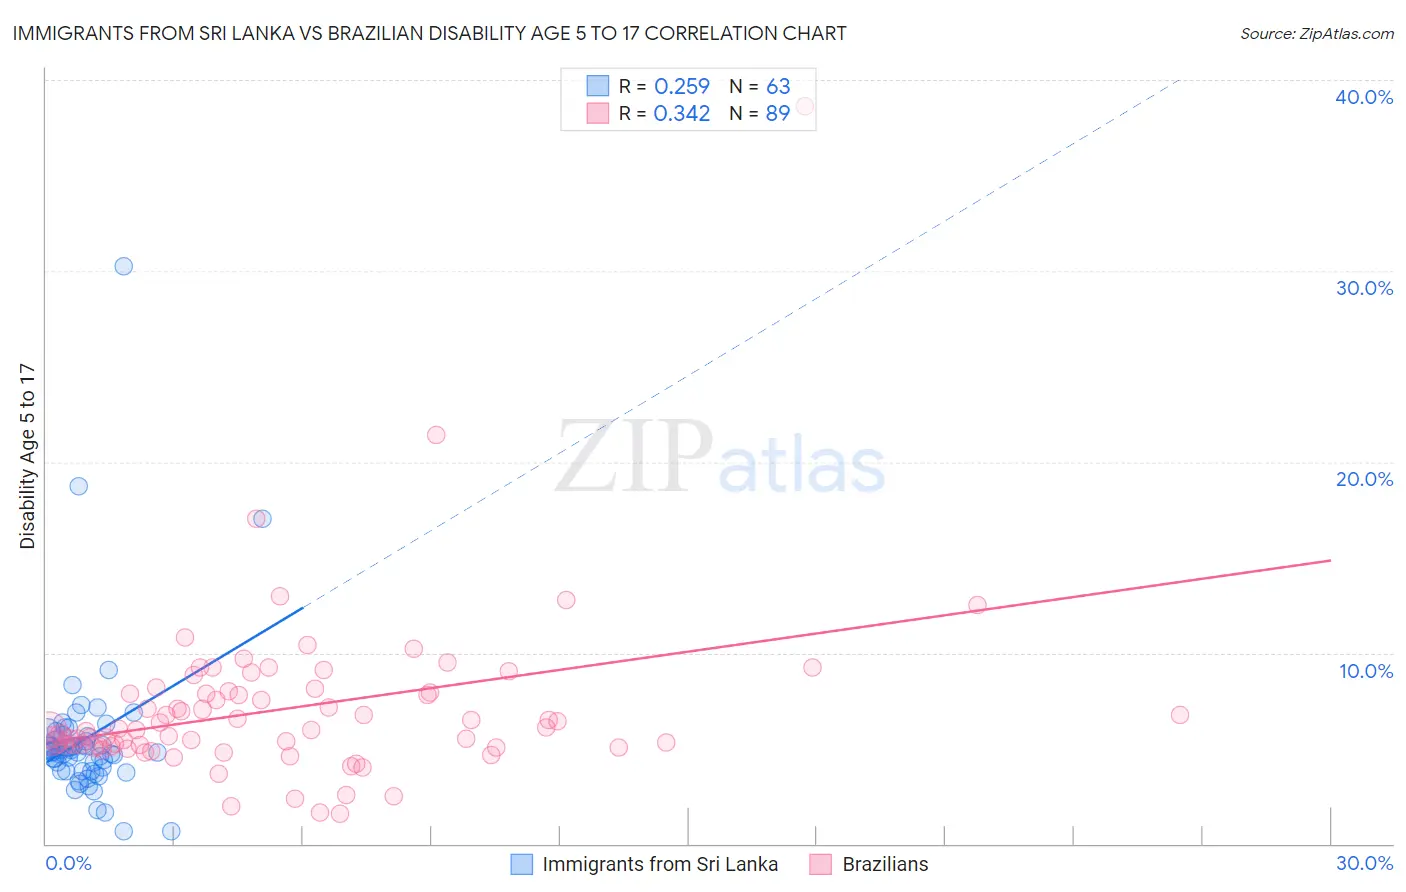
Immigrants from Sri Lanka vs Brazilian Disability Age 5 to 17 Correlation Chart
The statistical analysis conducted on geographies consisting of 149,300,989 people shows a weak positive correlation between the proportion of Immigrants from Sri Lanka and percentage of population with a disability between the ages 5 and 17 in the United States with a correlation coefficient (R) of 0.259 and weighted average of 5.0%. Similarly, the statistical analysis conducted on geographies consisting of 321,958,150 people shows a mild positive correlation between the proportion of Brazilians and percentage of population with a disability between the ages 5 and 17 in the United States with a correlation coefficient (R) of 0.342 and weighted average of 5.9%, a difference of 18.0%.
Disability Age 5 to 17 Correlation Summary
| Measurement | Immigrants from Sri Lanka | Brazilian |
| Minimum | 0.62% | 1.6% |
| Maximum | 30.2% | 38.7% |
| Range | 29.6% | 37.1% |
| Mean | 5.5% | 7.1% |
| Median | 4.8% | 6.0% |
| Interquartile 25% (IQ1) | 3.8% | 5.1% |
| Interquartile 75% (IQ3) | 5.7% | 8.0% |
| Interquartile Range (IQR) | 1.9% | 2.8% |
| Standard Deviation (Sample) | 4.2% | 4.5% |
| Standard Deviation (Population) | 4.2% | 4.5% |
Similar Demographics by Disability Age 5 to 17
Demographics Similar to Immigrants from Sri Lanka by Disability Age 5 to 17
In terms of disability age 5 to 17, the demographic groups most similar to Immigrants from Sri Lanka are Immigrants from Australia (5.0%, a difference of 0.010%), Okinawan (5.0%, a difference of 0.090%), Immigrants from Philippines (5.0%, a difference of 0.17%), Immigrants from Argentina (5.0%, a difference of 0.17%), and Immigrants from Belarus (5.0%, a difference of 0.21%).
| Demographics | Rating | Rank | Disability Age 5 to 17 |
| Bolivians | 100.0 /100 | #35 | Exceptional 5.0% |
| Immigrants | Egypt | 100.0 /100 | #36 | Exceptional 5.0% |
| Immigrants | Belarus | 100.0 /100 | #37 | Exceptional 5.0% |
| Immigrants | Philippines | 100.0 /100 | #38 | Exceptional 5.0% |
| Immigrants | Argentina | 100.0 /100 | #39 | Exceptional 5.0% |
| Okinawans | 100.0 /100 | #40 | Exceptional 5.0% |
| Immigrants | Australia | 100.0 /100 | #41 | Exceptional 5.0% |
| Immigrants | Sri Lanka | 100.0 /100 | #42 | Exceptional 5.0% |
| Immigrants | Russia | 100.0 /100 | #43 | Exceptional 5.0% |
| Egyptians | 100.0 /100 | #44 | Exceptional 5.0% |
| Tongans | 100.0 /100 | #45 | Exceptional 5.0% |
| Assyrians/Chaldeans/Syriacs | 100.0 /100 | #46 | Exceptional 5.0% |
| Vietnamese | 100.0 /100 | #47 | Exceptional 5.1% |
| Koreans | 100.0 /100 | #48 | Exceptional 5.1% |
| Immigrants | Western Asia | 100.0 /100 | #49 | Exceptional 5.1% |
Demographics Similar to Brazilians by Disability Age 5 to 17
In terms of disability age 5 to 17, the demographic groups most similar to Brazilians are Hispanic or Latino (5.9%, a difference of 0.040%), Slavic (5.9%, a difference of 0.060%), Hopi (5.9%, a difference of 0.13%), Somali (5.9%, a difference of 0.19%), and Immigrants from Middle Africa (5.9%, a difference of 0.26%).
| Demographics | Rating | Rank | Disability Age 5 to 17 |
| Immigrants | Cambodia | 1.5 /100 | #251 | Tragic 5.9% |
| Hondurans | 1.5 /100 | #252 | Tragic 5.9% |
| Scandinavians | 1.4 /100 | #253 | Tragic 5.9% |
| Barbadians | 1.3 /100 | #254 | Tragic 5.9% |
| Italians | 1.2 /100 | #255 | Tragic 5.9% |
| Hopi | 1.0 /100 | #256 | Tragic 5.9% |
| Hispanics or Latinos | 1.0 /100 | #257 | Tragic 5.9% |
| Brazilians | 0.9 /100 | #258 | Tragic 5.9% |
| Slavs | 0.9 /100 | #259 | Tragic 5.9% |
| Somalis | 0.8 /100 | #260 | Tragic 5.9% |
| Immigrants | Middle Africa | 0.7 /100 | #261 | Tragic 5.9% |
| Immigrants | Western Africa | 0.7 /100 | #262 | Tragic 5.9% |
| Czechoslovakians | 0.7 /100 | #263 | Tragic 5.9% |
| Canadians | 0.6 /100 | #264 | Tragic 6.0% |
| Panamanians | 0.6 /100 | #265 | Tragic 6.0% |