Immigrants from Sri Lanka vs Belizean Disability Age 5 to 17
COMPARE
Immigrants from Sri Lanka
Belizean
Disability Age 5 to 17
Disability Age 5 to 17 Comparison
Immigrants from Sri Lanka
Belizeans
5.0%
DISABILITY AGE 5 TO 17
100.0/ 100
METRIC RATING
42nd/ 347
METRIC RANK
5.4%
DISABILITY AGE 5 TO 17
90.8/ 100
METRIC RATING
139th/ 347
METRIC RANK
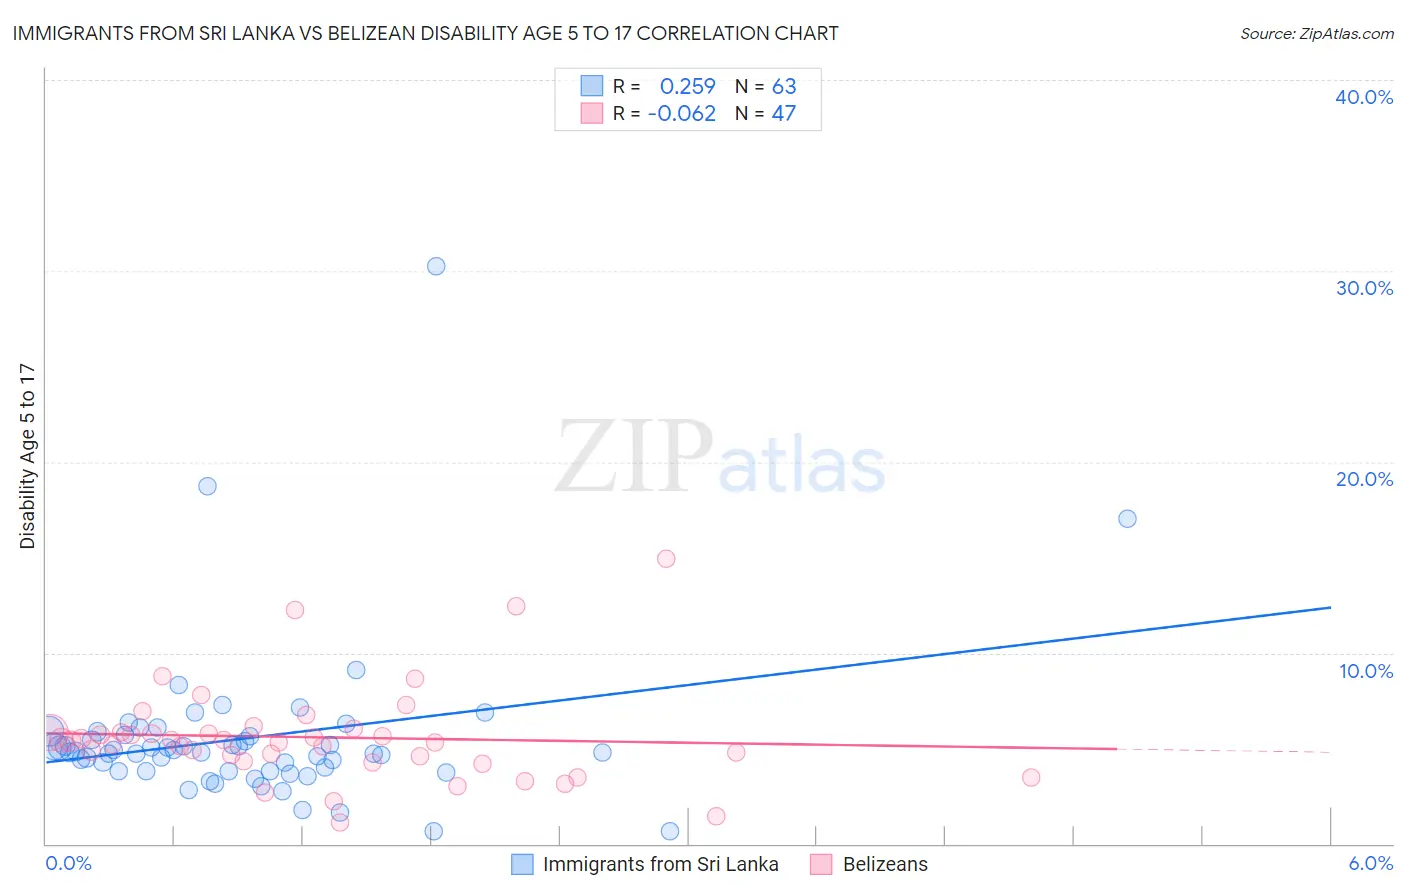
Immigrants from Sri Lanka vs Belizean Disability Age 5 to 17 Correlation Chart
The statistical analysis conducted on geographies consisting of 149,300,989 people shows a weak positive correlation between the proportion of Immigrants from Sri Lanka and percentage of population with a disability between the ages 5 and 17 in the United States with a correlation coefficient (R) of 0.259 and weighted average of 5.0%. Similarly, the statistical analysis conducted on geographies consisting of 143,880,682 people shows a slight negative correlation between the proportion of Belizeans and percentage of population with a disability between the ages 5 and 17 in the United States with a correlation coefficient (R) of -0.062 and weighted average of 5.4%, a difference of 8.4%.
Disability Age 5 to 17 Correlation Summary
| Measurement | Immigrants from Sri Lanka | Belizean |
| Minimum | 0.62% | 1.1% |
| Maximum | 30.2% | 14.9% |
| Range | 29.6% | 13.9% |
| Mean | 5.5% | 5.6% |
| Median | 4.8% | 5.4% |
| Interquartile 25% (IQ1) | 3.8% | 4.3% |
| Interquartile 75% (IQ3) | 5.7% | 5.9% |
| Interquartile Range (IQR) | 1.9% | 1.5% |
| Standard Deviation (Sample) | 4.2% | 2.6% |
| Standard Deviation (Population) | 4.2% | 2.5% |
Similar Demographics by Disability Age 5 to 17
Demographics Similar to Immigrants from Sri Lanka by Disability Age 5 to 17
In terms of disability age 5 to 17, the demographic groups most similar to Immigrants from Sri Lanka are Immigrants from Australia (5.0%, a difference of 0.010%), Okinawan (5.0%, a difference of 0.090%), Immigrants from Philippines (5.0%, a difference of 0.17%), Immigrants from Argentina (5.0%, a difference of 0.17%), and Immigrants from Belarus (5.0%, a difference of 0.21%).
| Demographics | Rating | Rank | Disability Age 5 to 17 |
| Bolivians | 100.0 /100 | #35 | Exceptional 5.0% |
| Immigrants | Egypt | 100.0 /100 | #36 | Exceptional 5.0% |
| Immigrants | Belarus | 100.0 /100 | #37 | Exceptional 5.0% |
| Immigrants | Philippines | 100.0 /100 | #38 | Exceptional 5.0% |
| Immigrants | Argentina | 100.0 /100 | #39 | Exceptional 5.0% |
| Okinawans | 100.0 /100 | #40 | Exceptional 5.0% |
| Immigrants | Australia | 100.0 /100 | #41 | Exceptional 5.0% |
| Immigrants | Sri Lanka | 100.0 /100 | #42 | Exceptional 5.0% |
| Immigrants | Russia | 100.0 /100 | #43 | Exceptional 5.0% |
| Egyptians | 100.0 /100 | #44 | Exceptional 5.0% |
| Tongans | 100.0 /100 | #45 | Exceptional 5.0% |
| Assyrians/Chaldeans/Syriacs | 100.0 /100 | #46 | Exceptional 5.0% |
| Vietnamese | 100.0 /100 | #47 | Exceptional 5.1% |
| Koreans | 100.0 /100 | #48 | Exceptional 5.1% |
| Immigrants | Western Asia | 100.0 /100 | #49 | Exceptional 5.1% |
Demographics Similar to Belizeans by Disability Age 5 to 17
In terms of disability age 5 to 17, the demographic groups most similar to Belizeans are Immigrants from Oceania (5.4%, a difference of 0.0%), Navajo (5.4%, a difference of 0.010%), Immigrants from Netherlands (5.4%, a difference of 0.050%), Immigrants from Denmark (5.4%, a difference of 0.090%), and Immigrants from Belize (5.4%, a difference of 0.14%).
| Demographics | Rating | Rank | Disability Age 5 to 17 |
| Immigrants | Colombia | 92.9 /100 | #132 | Exceptional 5.4% |
| Venezuelans | 92.7 /100 | #133 | Exceptional 5.4% |
| Yuman | 92.3 /100 | #134 | Exceptional 5.4% |
| Immigrants | Belize | 91.7 /100 | #135 | Exceptional 5.4% |
| Immigrants | Denmark | 91.4 /100 | #136 | Exceptional 5.4% |
| Navajo | 90.9 /100 | #137 | Exceptional 5.4% |
| Immigrants | Oceania | 90.8 /100 | #138 | Exceptional 5.4% |
| Belizeans | 90.8 /100 | #139 | Exceptional 5.4% |
| Immigrants | Netherlands | 90.5 /100 | #140 | Exceptional 5.4% |
| South American Indians | 89.3 /100 | #141 | Excellent 5.5% |
| Colombians | 88.0 /100 | #142 | Excellent 5.5% |
| Immigrants | Hungary | 87.9 /100 | #143 | Excellent 5.5% |
| Pakistanis | 87.3 /100 | #144 | Excellent 5.5% |
| Immigrants | Guatemala | 86.6 /100 | #145 | Excellent 5.5% |
| Albanians | 83.7 /100 | #146 | Excellent 5.5% |