Immigrants from Micronesia GED/Equivalency
COMPARE
Immigrants from Micronesia
Select to Compare
GED/Equivalency
Immigrants from Micronesia GED/Equivalency
84.7%
GED/EQUIVALENCY
8.7/ 100
METRIC RATING
216th/ 347
METRIC RANK
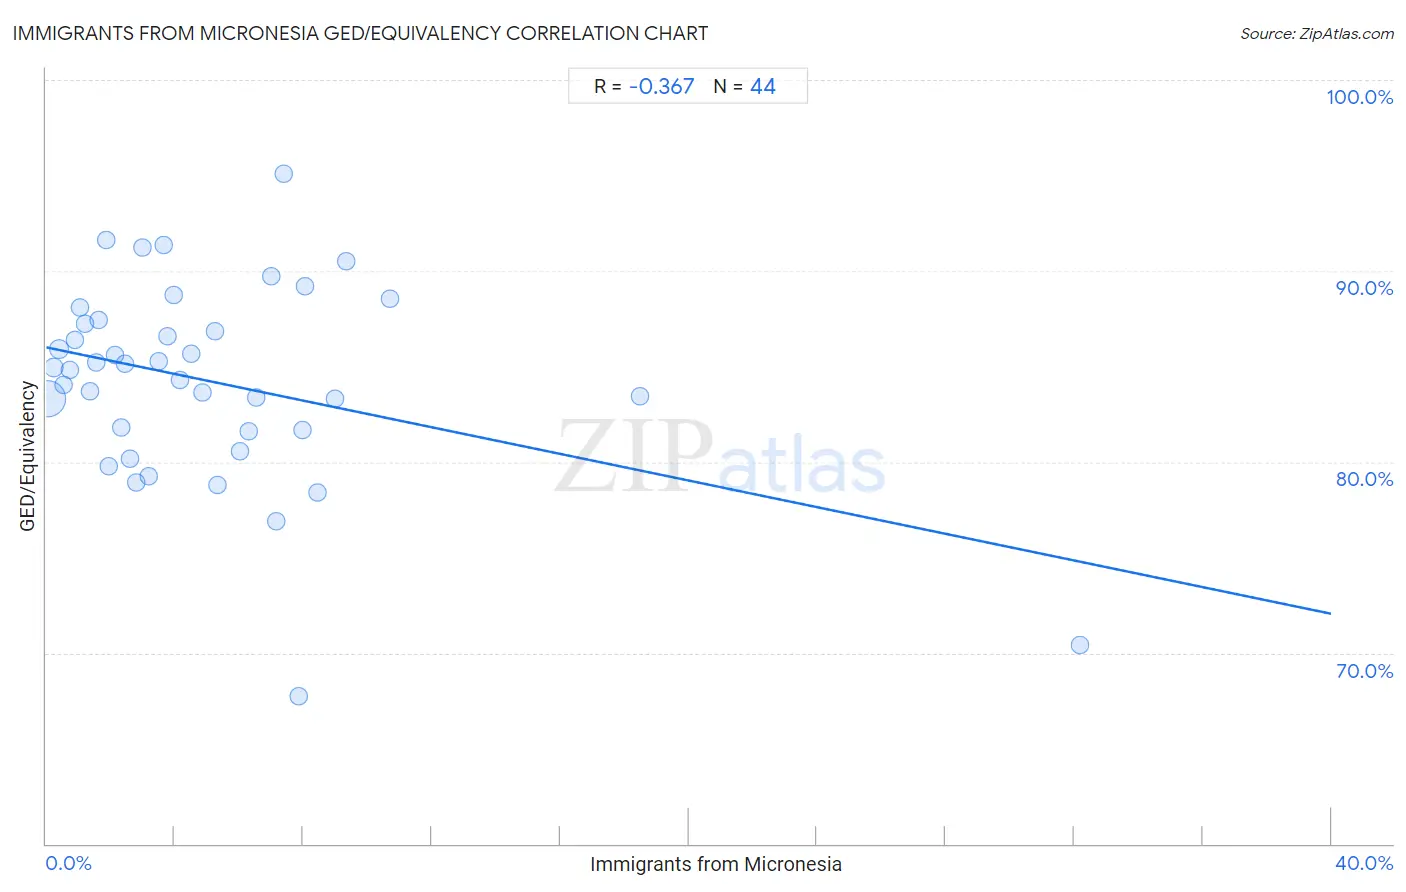
Immigrants from Micronesia GED/Equivalency Correlation Chart
The statistical analysis conducted on geographies consisting of 61,609,499 people shows a mild negative correlation between the proportion of Immigrants from Micronesia and percentage of population with at least ged/equivalency education in the United States with a correlation coefficient (R) of -0.367 and weighted average of 84.7%. On average, for every 1% (one percent) increase in Immigrants from Micronesia within a typical geography, there is a decrease of 0.35% in percentage of population with at least ged/equivalency education.
It is essential to understand that the correlation between the percentage of Immigrants from Micronesia and percentage of population with at least ged/equivalency education does not imply a direct cause-and-effect relationship. It remains uncertain whether the presence of Immigrants from Micronesia influences an upward or downward trend in the level of percentage of population with at least ged/equivalency education within an area, or if Immigrants from Micronesia simply ended up residing in those areas with higher or lower levels of percentage of population with at least ged/equivalency education due to other factors.
Demographics Similar to Immigrants from Micronesia by GED/Equivalency
In terms of ged/equivalency, the demographic groups most similar to Immigrants from Micronesia are Nigerian (84.7%, a difference of 0.0%), Alaska Native (84.7%, a difference of 0.0%), Peruvian (84.7%, a difference of 0.030%), Potawatomi (84.7%, a difference of 0.030%), and American (84.7%, a difference of 0.030%).
| Demographics | Rating | Rank | GED/Equivalency |
| Colombians | 12.3 /100 | #209 | Poor 84.9% |
| Immigrants from Cameroon | 12.1 /100 | #210 | Poor 84.9% |
| South Americans | 10.9 /100 | #211 | Poor 84.8% |
| Immigrants from Somalia | 10.6 /100 | #212 | Poor 84.8% |
| Immigrants from Philippines | 10.0 /100 | #213 | Poor 84.8% |
| Osage | 9.5 /100 | #214 | Tragic 84.8% |
| Peruvians | 9.2 /100 | #215 | Tragic 84.7% |
| Immigrants from Micronesia | 8.7 /100 | #216 | Tragic 84.7% |
| Nigerians | 8.6 /100 | #217 | Tragic 84.7% |
| Alaska Natives | 8.6 /100 | #218 | Tragic 84.7% |
| Potawatomi | 8.2 /100 | #219 | Tragic 84.7% |
| Americans | 8.2 /100 | #220 | Tragic 84.7% |
| Taiwanese | 8.1 /100 | #221 | Tragic 84.7% |
| Iroquois | 7.5 /100 | #222 | Tragic 84.6% |
| Immigrants from Uzbekistan | 7.1 /100 | #223 | Tragic 84.6% |
Immigrants from Micronesia GED/Equivalency Correlation Summary
| Measurement | Immigrants from Micronesia Data | GED/Equivalency Data |
| Minimum | 0.022% | 67.7% |
| Maximum | 32.2% | 95.1% |
| Range | 32.1% | 27.3% |
| Mean | 5.1% | 84.2% |
| Median | 3.7% | 84.9% |
| Interquartile 25% (IQ1) | 1.7% | 81.6% |
| Interquartile 75% (IQ3) | 7.1% | 87.3% |
| Interquartile Range (IQR) | 5.3% | 5.7% |
| Standard Deviation (Sample) | 5.5% | 5.2% |
| Standard Deviation (Population) | 5.4% | 5.2% |
Correlation Details
| Immigrants from Micronesia Percentile | Sample Size | GED/Equivalency |
[ 0.0% - 0.5% ] 0.022% | 53,368,899 | 83.3% |
[ 0.0% - 0.5% ] 0.22% | 3,463,820 | 84.9% |
[ 0.0% - 0.5% ] 0.39% | 1,633,111 | 85.9% |
[ 0.5% - 1.0% ] 0.54% | 911,219 | 84.0% |
[ 0.5% - 1.0% ] 0.73% | 522,252 | 84.8% |
[ 0.5% - 1.0% ] 0.90% | 465,458 | 86.4% |
[ 1.0% - 1.5% ] 1.05% | 183,115 | 88.1% |
[ 1.0% - 1.5% ] 1.22% | 79,622 | 87.2% |
[ 1.0% - 1.5% ] 1.35% | 37,868 | 83.7% |
[ 1.5% - 2.0% ] 1.56% | 130,257 | 85.2% |
[ 1.5% - 2.0% ] 1.63% | 382,524 | 87.4% |
[ 1.5% - 2.0% ] 1.86% | 10,989 | 91.6% |
[ 1.5% - 2.0% ] 1.95% | 667 | 79.8% |
[ 2.0% - 2.5% ] 2.13% | 133,478 | 85.6% |
[ 2.0% - 2.5% ] 2.33% | 78,526 | 81.8% |
[ 2.0% - 2.5% ] 2.46% | 1,907 | 85.1% |
[ 2.5% - 3.0% ] 2.59% | 55,473 | 80.2% |
[ 2.5% - 3.0% ] 2.81% | 3,701 | 78.9% |
[ 2.5% - 3.0% ] 2.99% | 8,254 | 91.2% |
[ 3.0% - 3.5% ] 3.19% | 58,742 | 79.2% |
[ 3.0% - 3.5% ] 3.48% | 9,702 | 85.3% |
[ 3.5% - 4.0% ] 3.66% | 9,383 | 91.4% |
[ 3.5% - 4.0% ] 3.79% | 10,786 | 86.6% |
[ 3.5% - 4.0% ] 3.95% | 11,207 | 88.7% |
[ 4.0% - 4.5% ] 4.17% | 624 | 84.3% |
[ 4.5% - 5.0% ] 4.52% | 1,129 | 85.7% |
[ 4.5% - 5.0% ] 4.87% | 10,042 | 83.7% |
[ 5.0% - 5.5% ] 5.26% | 2,356 | 86.8% |
[ 5.0% - 5.5% ] 5.31% | 414 | 78.8% |
[ 6.0% - 6.5% ] 6.04% | 844 | 80.5% |
[ 6.0% - 6.5% ] 6.28% | 2,005 | 81.6% |
[ 6.5% - 7.0% ] 6.52% | 3,801 | 83.4% |
[ 6.5% - 7.0% ] 7.00% | 443 | 89.7% |
[ 7.0% - 7.5% ] 7.14% | 196 | 76.9% |
[ 7.0% - 7.5% ] 7.41% | 81 | 95.1% |
[ 7.5% - 8.0% ] 7.87% | 4,842 | 67.7% |
[ 7.5% - 8.0% ] 7.96% | 5,391 | 81.7% |
[ 8.0% - 8.5% ] 8.05% | 2,820 | 89.2% |
[ 8.0% - 8.5% ] 8.44% | 379 | 78.4% |
[ 8.5% - 9.0% ] 9.00% | 1,278 | 83.3% |
[ 9.0% - 9.5% ] 9.32% | 429 | 90.5% |
[ 10.5% - 11.0% ] 10.70% | 374 | 88.6% |
[ 18.0% - 18.5% ] 18.47% | 693 | 83.5% |
[ 32.0% - 32.5% ] 32.16% | 398 | 70.4% |