Immigrants from Micronesia 2 or more Vehicles in Household

COMPARE

Immigrants from Micronesia
Race
Ancestry
AfghanAfricanAlaska NativeAlaskan AthabascanAlbanianAleutAlsatianAmericanApacheArabArapahoArgentineanArmenianAssyrian/Chaldean/SyriacAustralianAustrianBahamianBangladeshiBarbadianBasqueBelgianBelizeanBermudanBhutaneseBlackfeetBolivianBrazilianBritishBritish West IndianBulgarianBurmeseCajunCambodianCanadianCape VerdeanCarpatho RusynCelticCentral AmericanCentral American IndianCherokeeCheyenneChickasawChileanChineseChippewaChoctawColombianColvilleComancheCosta RicanCreeCreekCroatianCrowCubanCypriotCzechCzechoslovakianDanishDelawareDominicanDutchDutch West IndianEastern EuropeanEcuadorianEgyptianEnglishEstonianEthiopianEuropeanFijianFilipinoFinnishFrenchFrench American IndianFrench CanadianGermanGerman RussianGhanaianGreekGuamanian/ChamorroGuatemalanGuyaneseHaitianHmongHonduranHopiHoumaHungarianIcelanderIndian (Asian)IndonesianInupiatIranianIraqiIrishIroquoisIsraeliItalianJamaicanJapaneseJordanianKenyanKiowaKoreanLaotianLatvianLebaneseLiberianLithuanianLumbeeLuxembourgerMacedonianMalaysianMalteseMarshalleseMenomineeMexicanMexican American IndianMongolianMoroccanNative HawaiianNavajoNepaleseNew ZealanderNicaraguanNigerianNorthern EuropeanNorwegianOkinawanOsageOttawaPaiutePakistaniPalestinianPanamanianParaguayanPennsylvania GermanPeruvianPimaPolishPortuguesePotawatomiPuebloPuerto RicanPuget Sound SalishRomanianRussianSalvadoranSamoanScandinavianScotch-IrishScottishSeminoleSenegaleseSerbianShoshoneSierra LeoneanSiouxSlavicSlovakSloveneSomaliSouth AfricanSouth AmericanSouth American IndianSoviet UnionSpaniardSpanishSpanish AmericanSpanish American IndianSri LankanSubsaharan AfricanSudaneseSwedishSwissSyrianTaiwaneseThaiTlingit-HaidaTohono O'OdhamTonganTrinidadian and TobagonianTsimshianTurkishU.S. Virgin IslanderUgandanUkrainianUruguayanUteVenezuelanVietnameseWelshWest IndianYakamaYaquiYugoslavianYumanYup'ikZimbabwean
Immigration
NonimmigrantsImmigrantsAfghanistanAfricaAlbaniaArgentinaArmeniaAsiaAustraliaAustriaBahamasBangladeshBarbadosBelarusBelgiumBelizeBoliviaBosnia and HerzegovinaBrazilBulgariaBurma/MyanmarCabo VerdeCambodiaCameroonCanadaCaribbeanCentral AmericaChileChinaColombiaCongoCosta RicaCroatiaCubaCzechoslovakiaDenmarkDominicaDominican RepublicEastern AfricaEastern AsiaEastern EuropeEcuadorEgyptEl SalvadorEnglandEritreaEthiopiaEuropeFijiFranceGermanyGhanaGreeceGrenadaGuatemalaGuyanaHaitiHondurasHong KongHungaryIndiaIndonesiaIranIraqIrelandIsraelItalyJamaicaJapanJordanKazakhstanKenyaKoreaKuwaitLaosLatin AmericaLatviaLebanonLiberiaLithuaniaMalaysiaMexicoMicronesiaMiddle AfricaMoldovaMoroccoNepalNetherlandsNicaraguaNigeriaNorth AmericaNorth MacedoniaNorthern AfricaNorthern EuropeNorwayOceaniaPakistanPanamaPeruPhilippinesPolandPortugalRomaniaRussiaSaudi ArabiaScotlandSenegalSerbiaSierra LeoneSingaporeSomaliaSouth AfricaSouth AmericaSouth Central AsiaSouth Eastern AsiaSouthern EuropeSpainSri LankaSt. Vincent and the GrenadinesSudanSwedenSwitzerlandSyriaTaiwanThailandTrinidad and TobagoTurkeyUgandaUkraineUruguayUzbekistanVenezuelaVietnamWest IndiesWestern AfricaWestern AsiaWestern EuropeYemenZaireZimbabweAzores
Select to Compare
Race
Ancestry
AfghanAfricanAlaska NativeAlaskan AthabascanAlbanianAleutAlsatianAmericanApacheArabArapahoArgentineanArmenianAssyrian/Chaldean/SyriacAustralianAustrianBahamianBangladeshiBarbadianBasqueBelgianBelizeanBermudanBhutaneseBlackfeetBolivianBrazilianBritishBritish West IndianBulgarianBurmeseCajunCambodianCanadianCape VerdeanCarpatho RusynCelticCentral AmericanCentral American IndianCherokeeCheyenneChickasawChileanChineseChippewaChoctawColombianColvilleComancheCosta RicanCreeCreekCroatianCrowCubanCypriotCzechCzechoslovakianDanishDelawareDominicanDutchDutch West IndianEastern EuropeanEcuadorianEgyptianEnglishEstonianEthiopianEuropeanFijianFilipinoFinnishFrenchFrench American IndianFrench CanadianGermanGerman RussianGhanaianGreekGuamanian/ChamorroGuatemalanGuyaneseHaitianHmongHonduranHopiHoumaHungarianIcelanderIndian (Asian)IndonesianInupiatIranianIraqiIrishIroquoisIsraeliItalianJamaicanJapaneseJordanianKenyanKiowaKoreanLaotianLatvianLebaneseLiberianLithuanianLumbeeLuxembourgerMacedonianMalaysianMalteseMarshalleseMenomineeMexicanMexican American IndianMongolianMoroccanNative HawaiianNavajoNepaleseNew ZealanderNicaraguanNigerianNorthern EuropeanNorwegianOkinawanOsageOttawaPaiutePakistaniPalestinianPanamanianParaguayanPennsylvania GermanPeruvianPimaPolishPortuguesePotawatomiPuebloPuerto RicanPuget Sound SalishRomanianRussianSalvadoranSamoanScandinavianScotch-IrishScottishSeminoleSenegaleseSerbianShoshoneSierra LeoneanSiouxSlavicSlovakSloveneSomaliSouth AfricanSouth AmericanSouth American IndianSoviet UnionSpaniardSpanishSpanish AmericanSpanish American IndianSri LankanSubsaharan AfricanSudaneseSwedishSwissSyrianTaiwaneseThaiTlingit-HaidaTohono O'OdhamTonganTrinidadian and TobagonianTsimshianTurkishU.S. Virgin IslanderUgandanUkrainianUruguayanUteVenezuelanVietnameseWelshWest IndianYakamaYaquiYugoslavianYumanYup'ikZimbabwean
Immigration
NonimmigrantsImmigrantsAfghanistanAfricaAlbaniaArgentinaArmeniaAsiaAustraliaAustriaBahamasBangladeshBarbadosBelarusBelgiumBelizeBoliviaBosnia and HerzegovinaBrazilBulgariaBurma/MyanmarCabo VerdeCambodiaCameroonCanadaCaribbeanCentral AmericaChileChinaColombiaCongoCosta RicaCroatiaCubaCzechoslovakiaDenmarkDominicaDominican RepublicEastern AfricaEastern AsiaEastern EuropeEcuadorEgyptEl SalvadorEnglandEritreaEthiopiaEuropeFijiFranceGermanyGhanaGreeceGrenadaGuatemalaGuyanaHaitiHondurasHong KongHungaryIndiaIndonesiaIranIraqIrelandIsraelItalyJamaicaJapanJordanKazakhstanKenyaKoreaKuwaitLaosLatin AmericaLatviaLebanonLiberiaLithuaniaMalaysiaMexicoMiddle AfricaMoldovaMoroccoNepalNetherlandsNicaraguaNigeriaNorth AmericaNorth MacedoniaNorthern AfricaNorthern EuropeNorwayOceaniaPakistanPanamaPeruPhilippinesPolandPortugalRomaniaRussiaSaudi ArabiaScotlandSenegalSerbiaSierra LeoneSingaporeSomaliaSouth AfricaSouth AmericaSouth Central AsiaSouth Eastern AsiaSouthern EuropeSpainSri LankaSt. Vincent and the GrenadinesSudanSwedenSwitzerlandSyriaTaiwanThailandTrinidad and TobagoTurkeyUgandaUkraineUruguayUzbekistanVenezuelaVietnamWest IndiesWestern AfricaWestern AsiaWestern EuropeYemenZaireZimbabweAzores
2 or more Vehicles in Household
Income
Poverty
Unemployment
Labor Participation
Family Structure
Vehicle Availability
Education Level
Disability

Immigrants from Micronesia 2 or more Vehicles in Household
Fair

55.1%
2+ VEHICLES AVAILABLE
38.2/ 100
METRIC RATING
181st/ 347
METRIC RANK

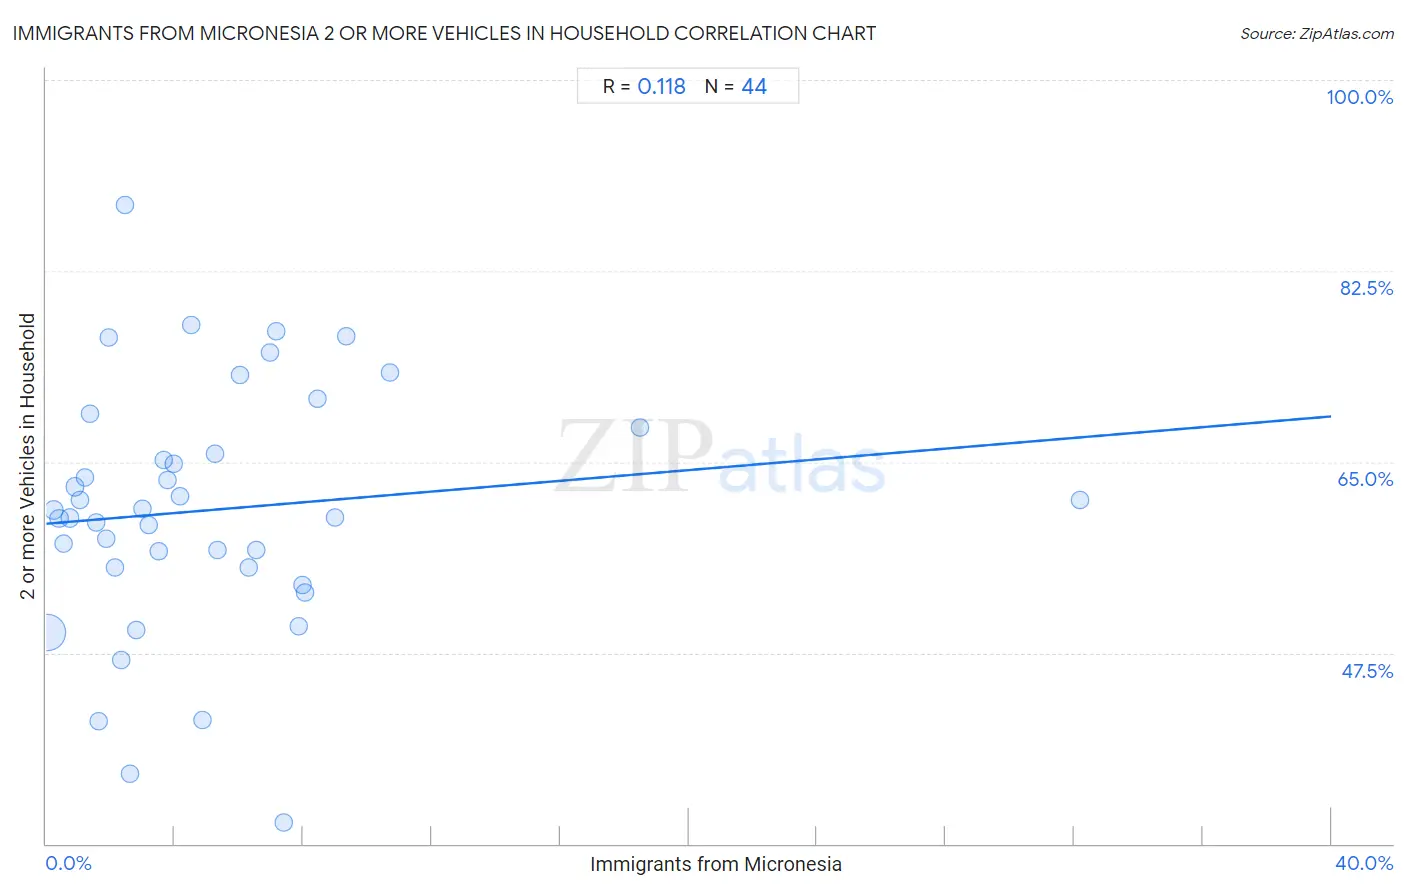
Immigrants from Micronesia 2 or more Vehicles in Household Correlation Chart

The statistical analysis conducted on geographies consisting of 61,601,070 people shows a poor positive correlation between the proportion of Immigrants from Micronesia and percentage of households with 2 or more vehicles available in the United States with a correlation coefficient (R) of 0.118 and weighted average of 55.1%. On average, for every 1% (one percent) increase in Immigrants from Micronesia within a typical geography, there is an increase of 0.25% in percentage of households with 2 or more vehicles available.
Immigrants from Micronesia 2 or more Vehicles in Household
It is essential to understand that the correlation between the percentage of Immigrants from Micronesia and percentage of households with 2 or more vehicles available does not imply a direct cause-and-effect relationship. It remains uncertain whether the presence of Immigrants from Micronesia influences an upward or downward trend in the level of percentage of households with 2 or more vehicles available within an area, or if Immigrants from Micronesia simply ended up residing in those areas with higher or lower levels of percentage of households with 2 or more vehicles available due to other factors.

Demographics Similar to Immigrants from Micronesia by 2 or more Vehicles in Household

In terms of 2 or more vehicles in household, the demographic groups most similar to Immigrants from Micronesia are Cree (55.1%, a difference of 0.0%), Immigrants from Cameroon (55.1%, a difference of 0.040%), Apache (55.1%, a difference of 0.060%), Immigrants from Kenya (55.1%, a difference of 0.090%), and Arab (55.0%, a difference of 0.10%).
DemographicsRating | Rank2 or more Vehicles in Household
Navajo
50.0
/100
|
#174
Average
55.3%
Immigrants from Denmark
49.4
/100
|
#175
Average
55.3%
Immigrants from Cuba
47.0
/100
|
#176
Average
55.3%
Menominee
46.2
/100
|
#177
Average
55.3%
Immigrants from Sweden
45.3
/100
|
#178
Average
55.2%
Alaskan Athabascans
42.9
/100
|
#179
Average
55.2%
Immigrants from Kenya
40.4
/100
|
#180
Average
55.1%
Immigrants from Micronesia
38.2
/100
|
#181
Fair
55.1%
Cree
38.2
/100
|
#182
Fair
55.1%
Immigrants from Cameroon
37.3
/100
|
#183
Fair
55.1%
Apache
36.7
/100
|
#184
Fair
55.1%
Arabs
35.9
/100
|
#185
Fair
55.0%
Peruvians
33.7
/100
|
#186
Fair
55.0%
Immigrants from Uganda
33.4
/100
|
#187
Fair
55.0%
Marshallese
30.5
/100
|
#188
Fair
54.9%

Immigrants from Micronesia 2 or more Vehicles in Household Correlation Summary

MeasurementImmigrants from Micronesia Data2 or more Vehicles in Household Data
Minimum0.022%31.9%
Maximum32.2%88.6%
Range32.1%56.6%
Mean5.1%60.6%
Median3.7%60.3%
Interquartile 25% (IQ1)1.7%55.3%
Interquartile 75% (IQ3)7.1%66.9%
Interquartile Range (IQR)5.3%11.6%
Standard Deviation (Sample)5.5%11.4%
Standard Deviation (Population)5.4%11.3%

Correlation Details

Immigrants from Micronesia PercentileSample Size2 or more Vehicles in Household
[
0.0%
-
0.5%
]
0.022%
53,363,86749.4%
[
0.0%
-
0.5%
]
0.22%
3,462,05560.6%
[
0.0%
-
0.5%
]
0.39%
1,633,11159.8%
[
0.5%
-
1.0%
]
0.54%
910,38957.5%
[
0.5%
-
1.0%
]
0.73%
521,69259.8%
[
0.5%
-
1.0%
]
0.90%
465,45862.7%
[
1.0%
-
1.5%
]
1.05%
183,11561.5%
[
1.0%
-
1.5%
]
1.22%
79,62263.6%
[
1.0%
-
1.5%
]
1.35%
37,86869.5%
[
1.5%
-
2.0%
]
1.56%
130,25759.4%
[
1.5%
-
2.0%
]
1.63%
382,52441.3%
[
1.5%
-
2.0%
]
1.86%
10,98958.0%
[
1.5%
-
2.0%
]
1.95%
66776.4%
[
2.0%
-
2.5%
]
2.13%
133,47855.3%
[
2.0%
-
2.5%
]
2.33%
78,52646.8%
[
2.0%
-
2.5%
]
2.46%
1,90788.6%
[
2.5%
-
3.0%
]
2.59%
55,47336.4%
[
2.5%
-
3.0%
]
2.81%
3,70149.5%
[
2.5%
-
3.0%
]
2.99%
8,25460.7%
[
3.0%
-
3.5%
]
3.19%
58,74259.2%
[
3.0%
-
3.5%
]
3.48%
9,70256.8%
[
3.5%
-
4.0%
]
3.66%
9,38365.1%
[
3.5%
-
4.0%
]
3.79%
10,78663.4%
[
3.5%
-
4.0%
]
3.95%
11,20764.9%
[
4.0%
-
4.5%
]
4.17%
62461.8%
[
4.5%
-
5.0%
]
4.52%
1,12977.5%
[
4.5%
-
5.0%
]
4.87%
10,04241.3%
[
5.0%
-
5.5%
]
5.26%
2,35665.8%
[
5.0%
-
5.5%
]
5.31%
41456.9%
[
6.0%
-
6.5%
]
6.04%
84473.0%
[
6.0%
-
6.5%
]
6.28%
2,00555.3%
[
6.5%
-
7.0%
]
6.52%
3,80156.9%
[
6.5%
-
7.0%
]
6.97%
20175.0%
[
7.0%
-
7.5%
]
7.14%
19677.0%
[
7.0%
-
7.5%
]
7.41%
8131.9%
[
7.5%
-
8.0%
]
7.87%
4,84249.9%
[
7.5%
-
8.0%
]
7.96%
5,39153.7%
[
8.0%
-
8.5%
]
8.05%
2,82053.0%
[
8.0%
-
8.5%
]
8.44%
37970.8%
[
8.5%
-
9.0%
]
9.00%
1,27860.0%
[
9.0%
-
9.5%
]
9.32%
42976.6%
[
10.5%
-
11.0%
]
10.70%
37473.2%
[
18.0%
-
18.5%
]
18.47%
69368.1%
[
32.0%
-
32.5%
]
32.16%
39861.5%